Start
text
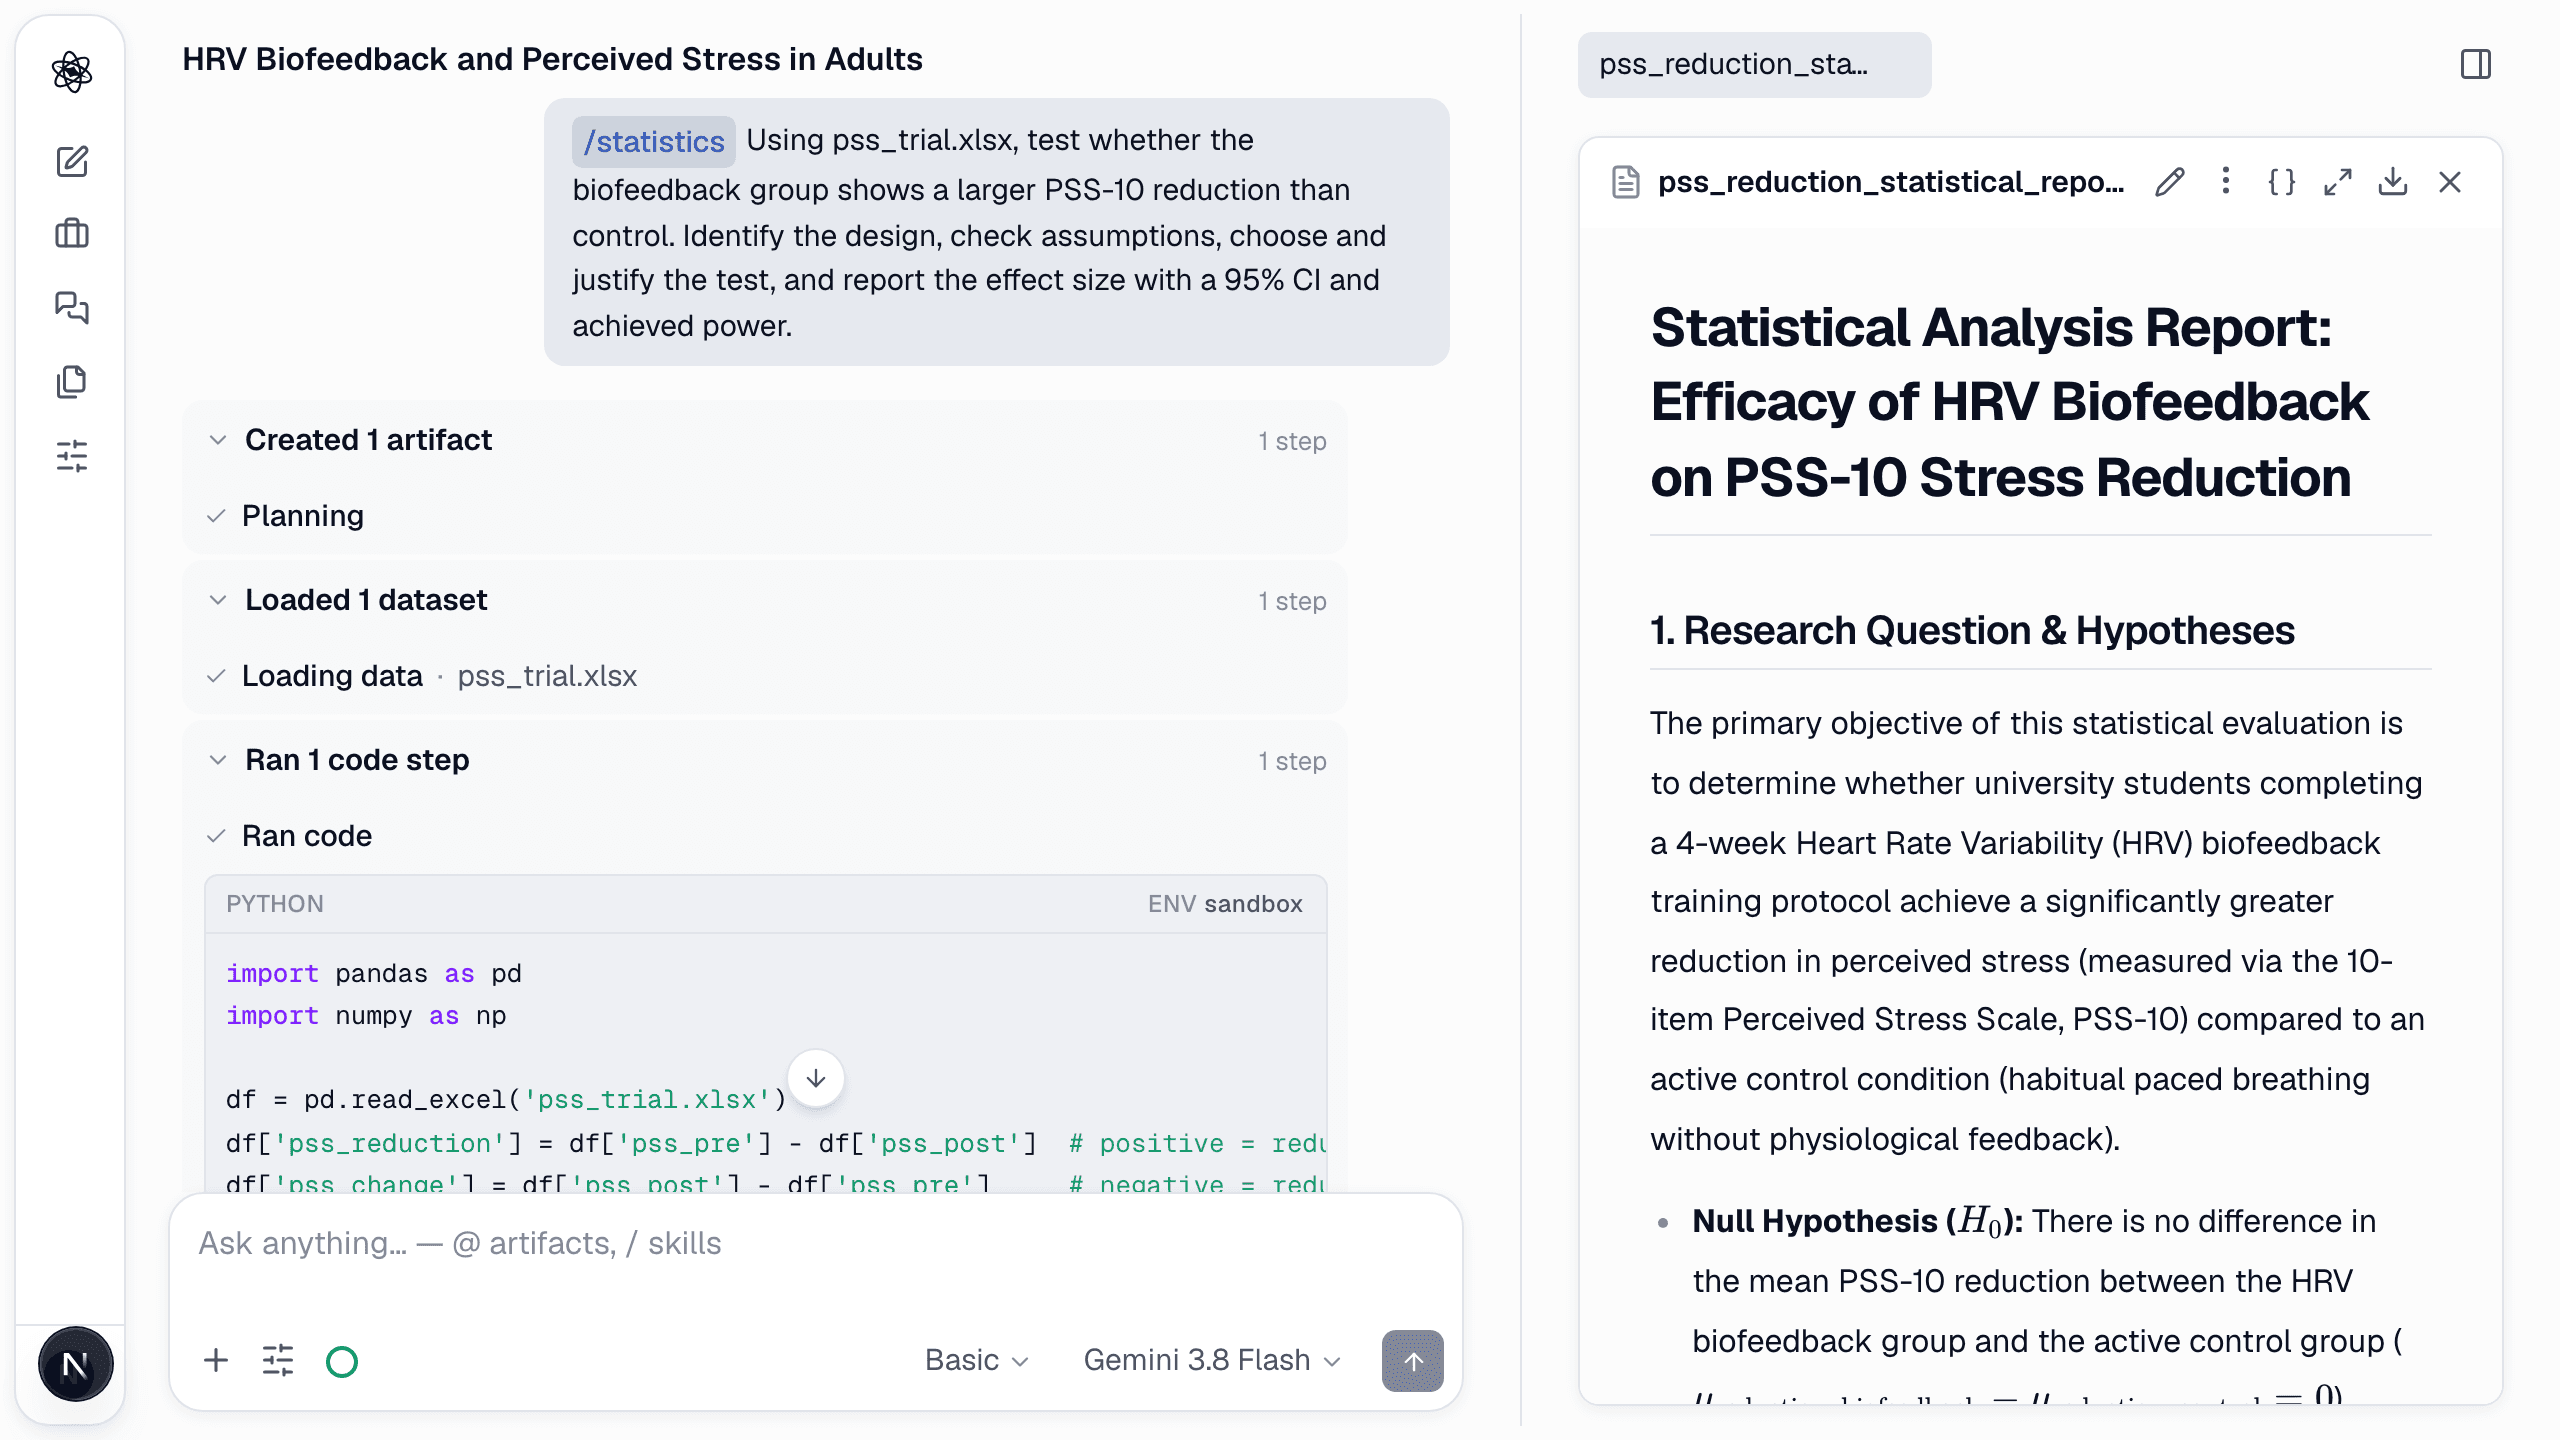
/stats Using pss_trial.xlsx, test whether the biofeedback group reduced PSS-10 more than control. Identify the design, check assumptions, choose and justify the test, and report the effect size with a 95% CI and achieved power.
If the data was already analyzed in the session, you can just say "test the group difference in change scores".
What happens
- Design recognition — between/within, number of groups, repeated measures, covariates.
- Assumption checks — normality, variance homogeneity, outliers; the choice between parametric and non-parametric tests is made from the checks and stated.
- Test — run with the verified tools; multiple-comparison correction when relevant.
- Effect sizes — Cohen's d, η², odds ratios and the like, with 95% CIs, plus achieved power for the observed effect.
What you get
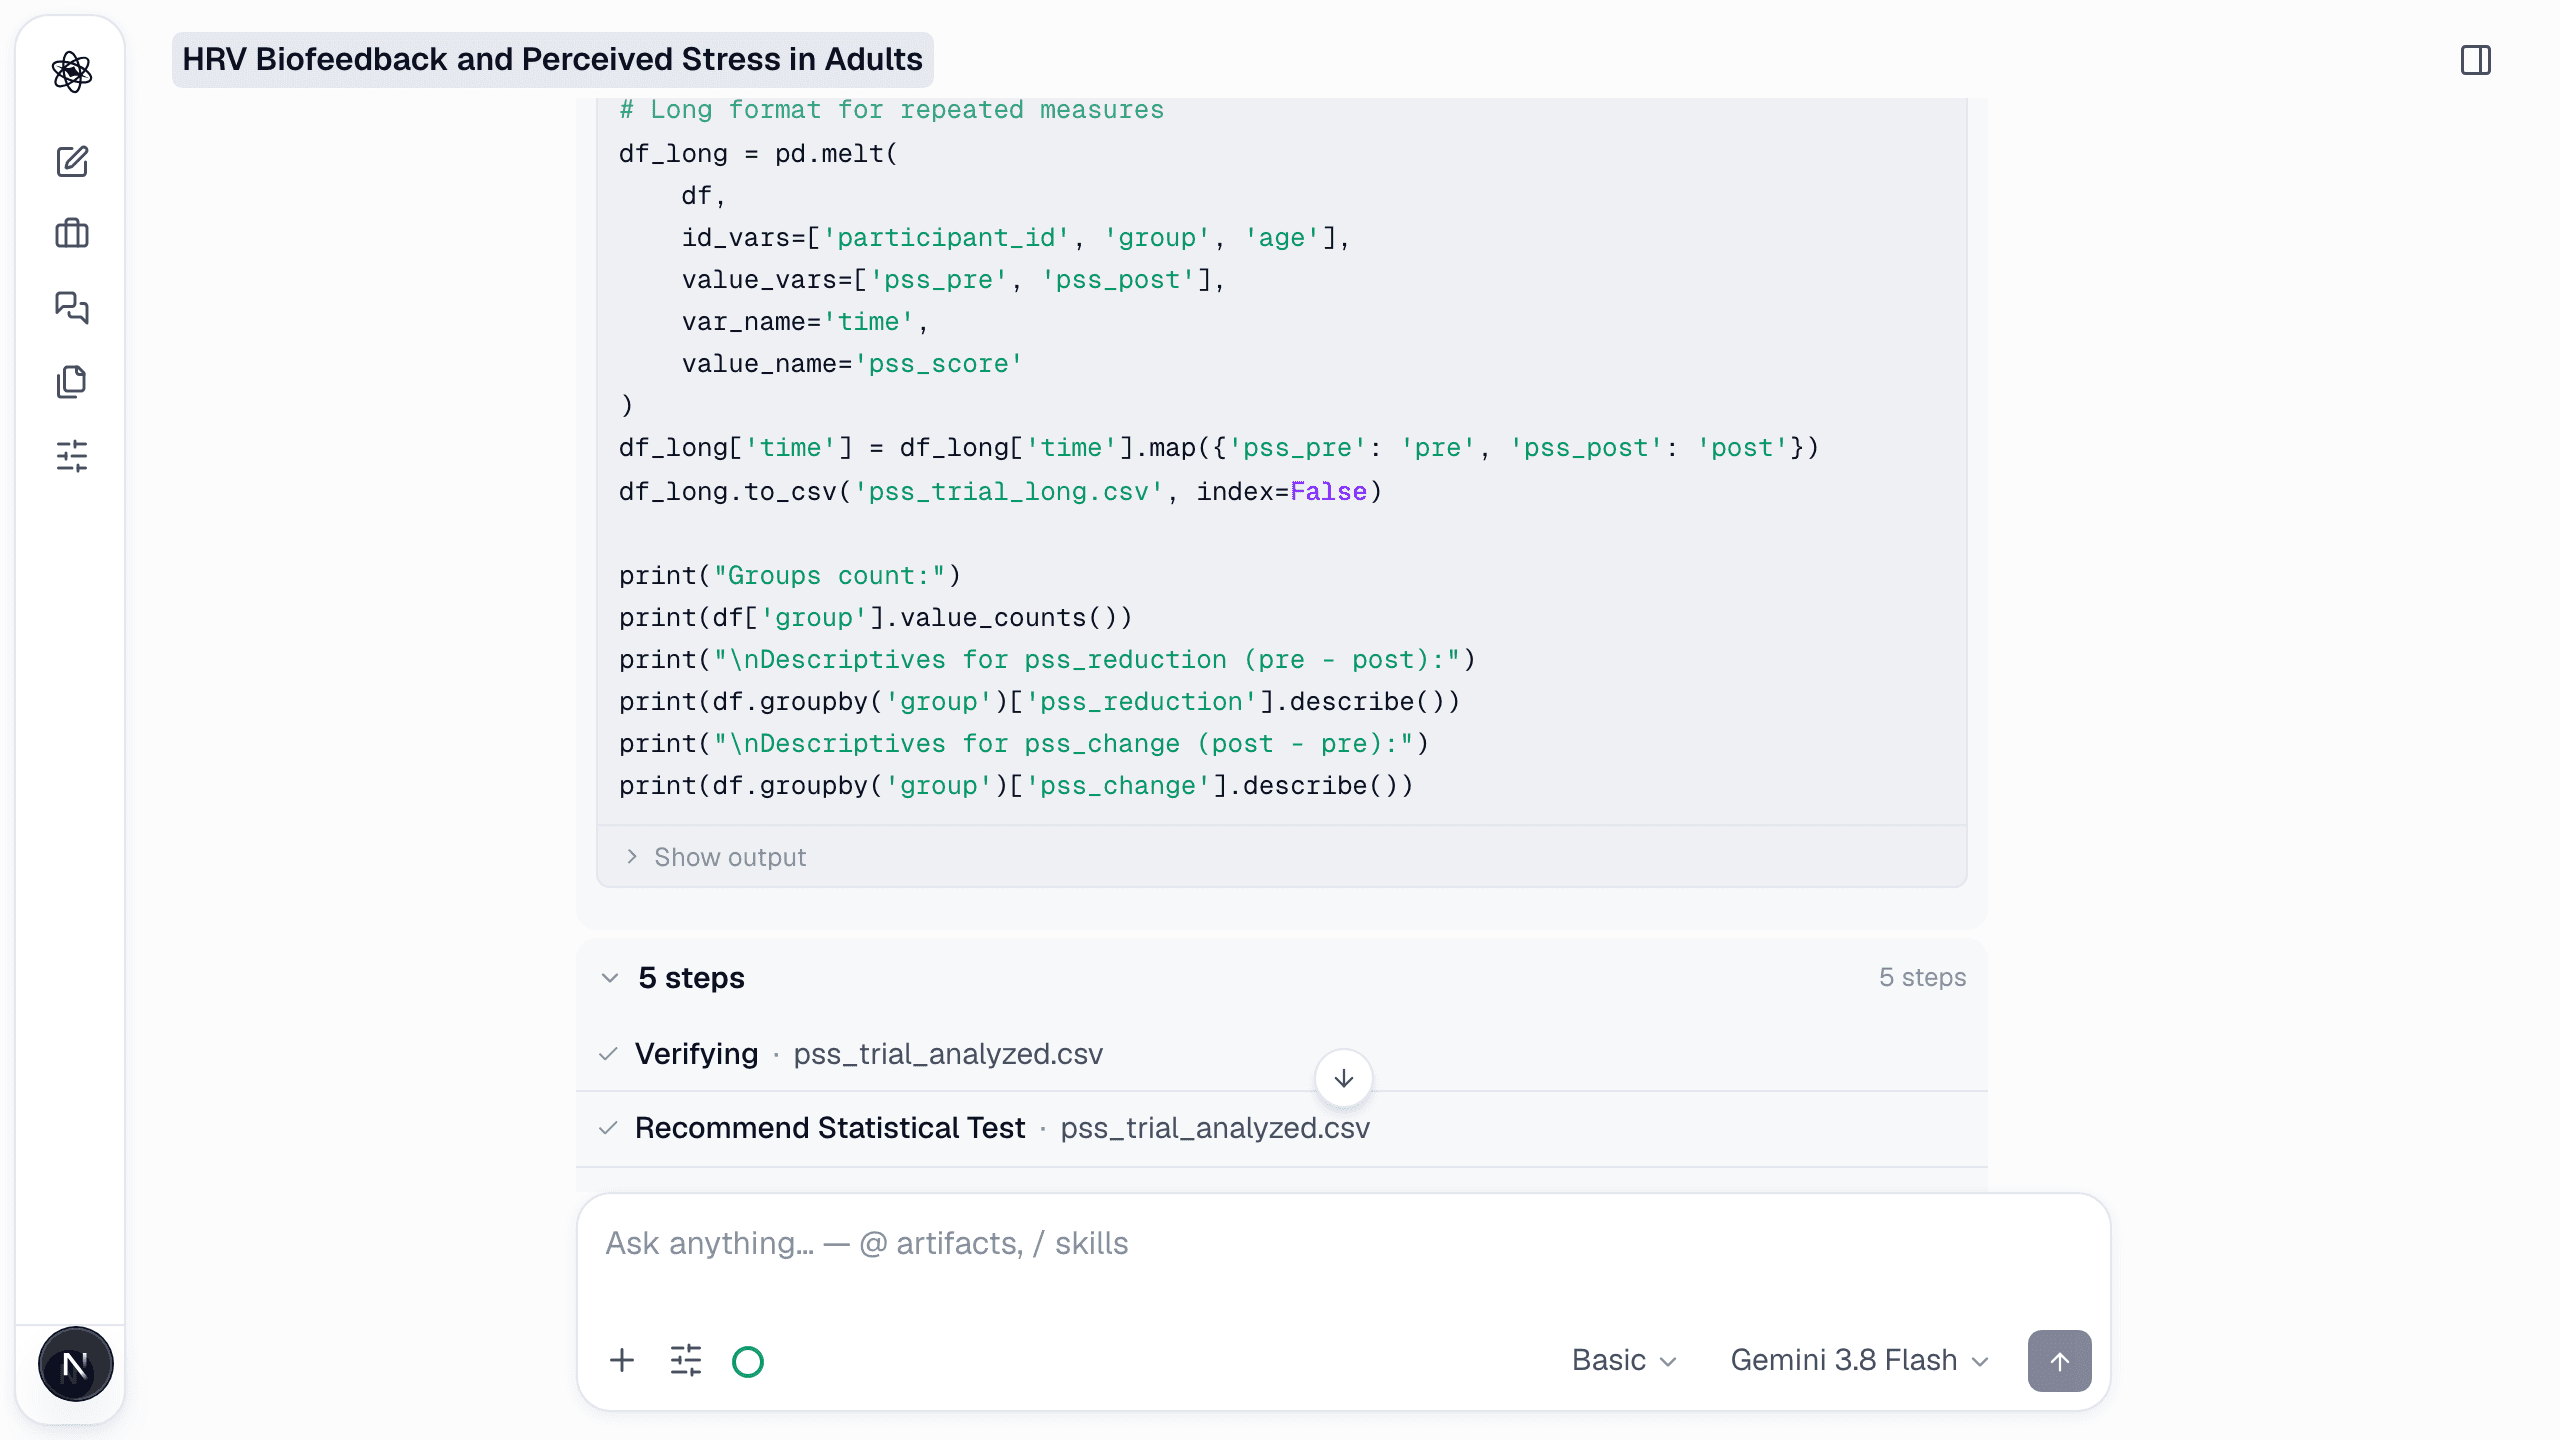
<analysis>_statistical_report.md— question and hypotheses, design, assumption checks, test selection and justification, results, effect sizes, power, interpretation.<analysis>_descriptives.csv, a group plot (boxplot with means and CIs), andstatistics_structured.jsonfor downstream use.
Psychometrics
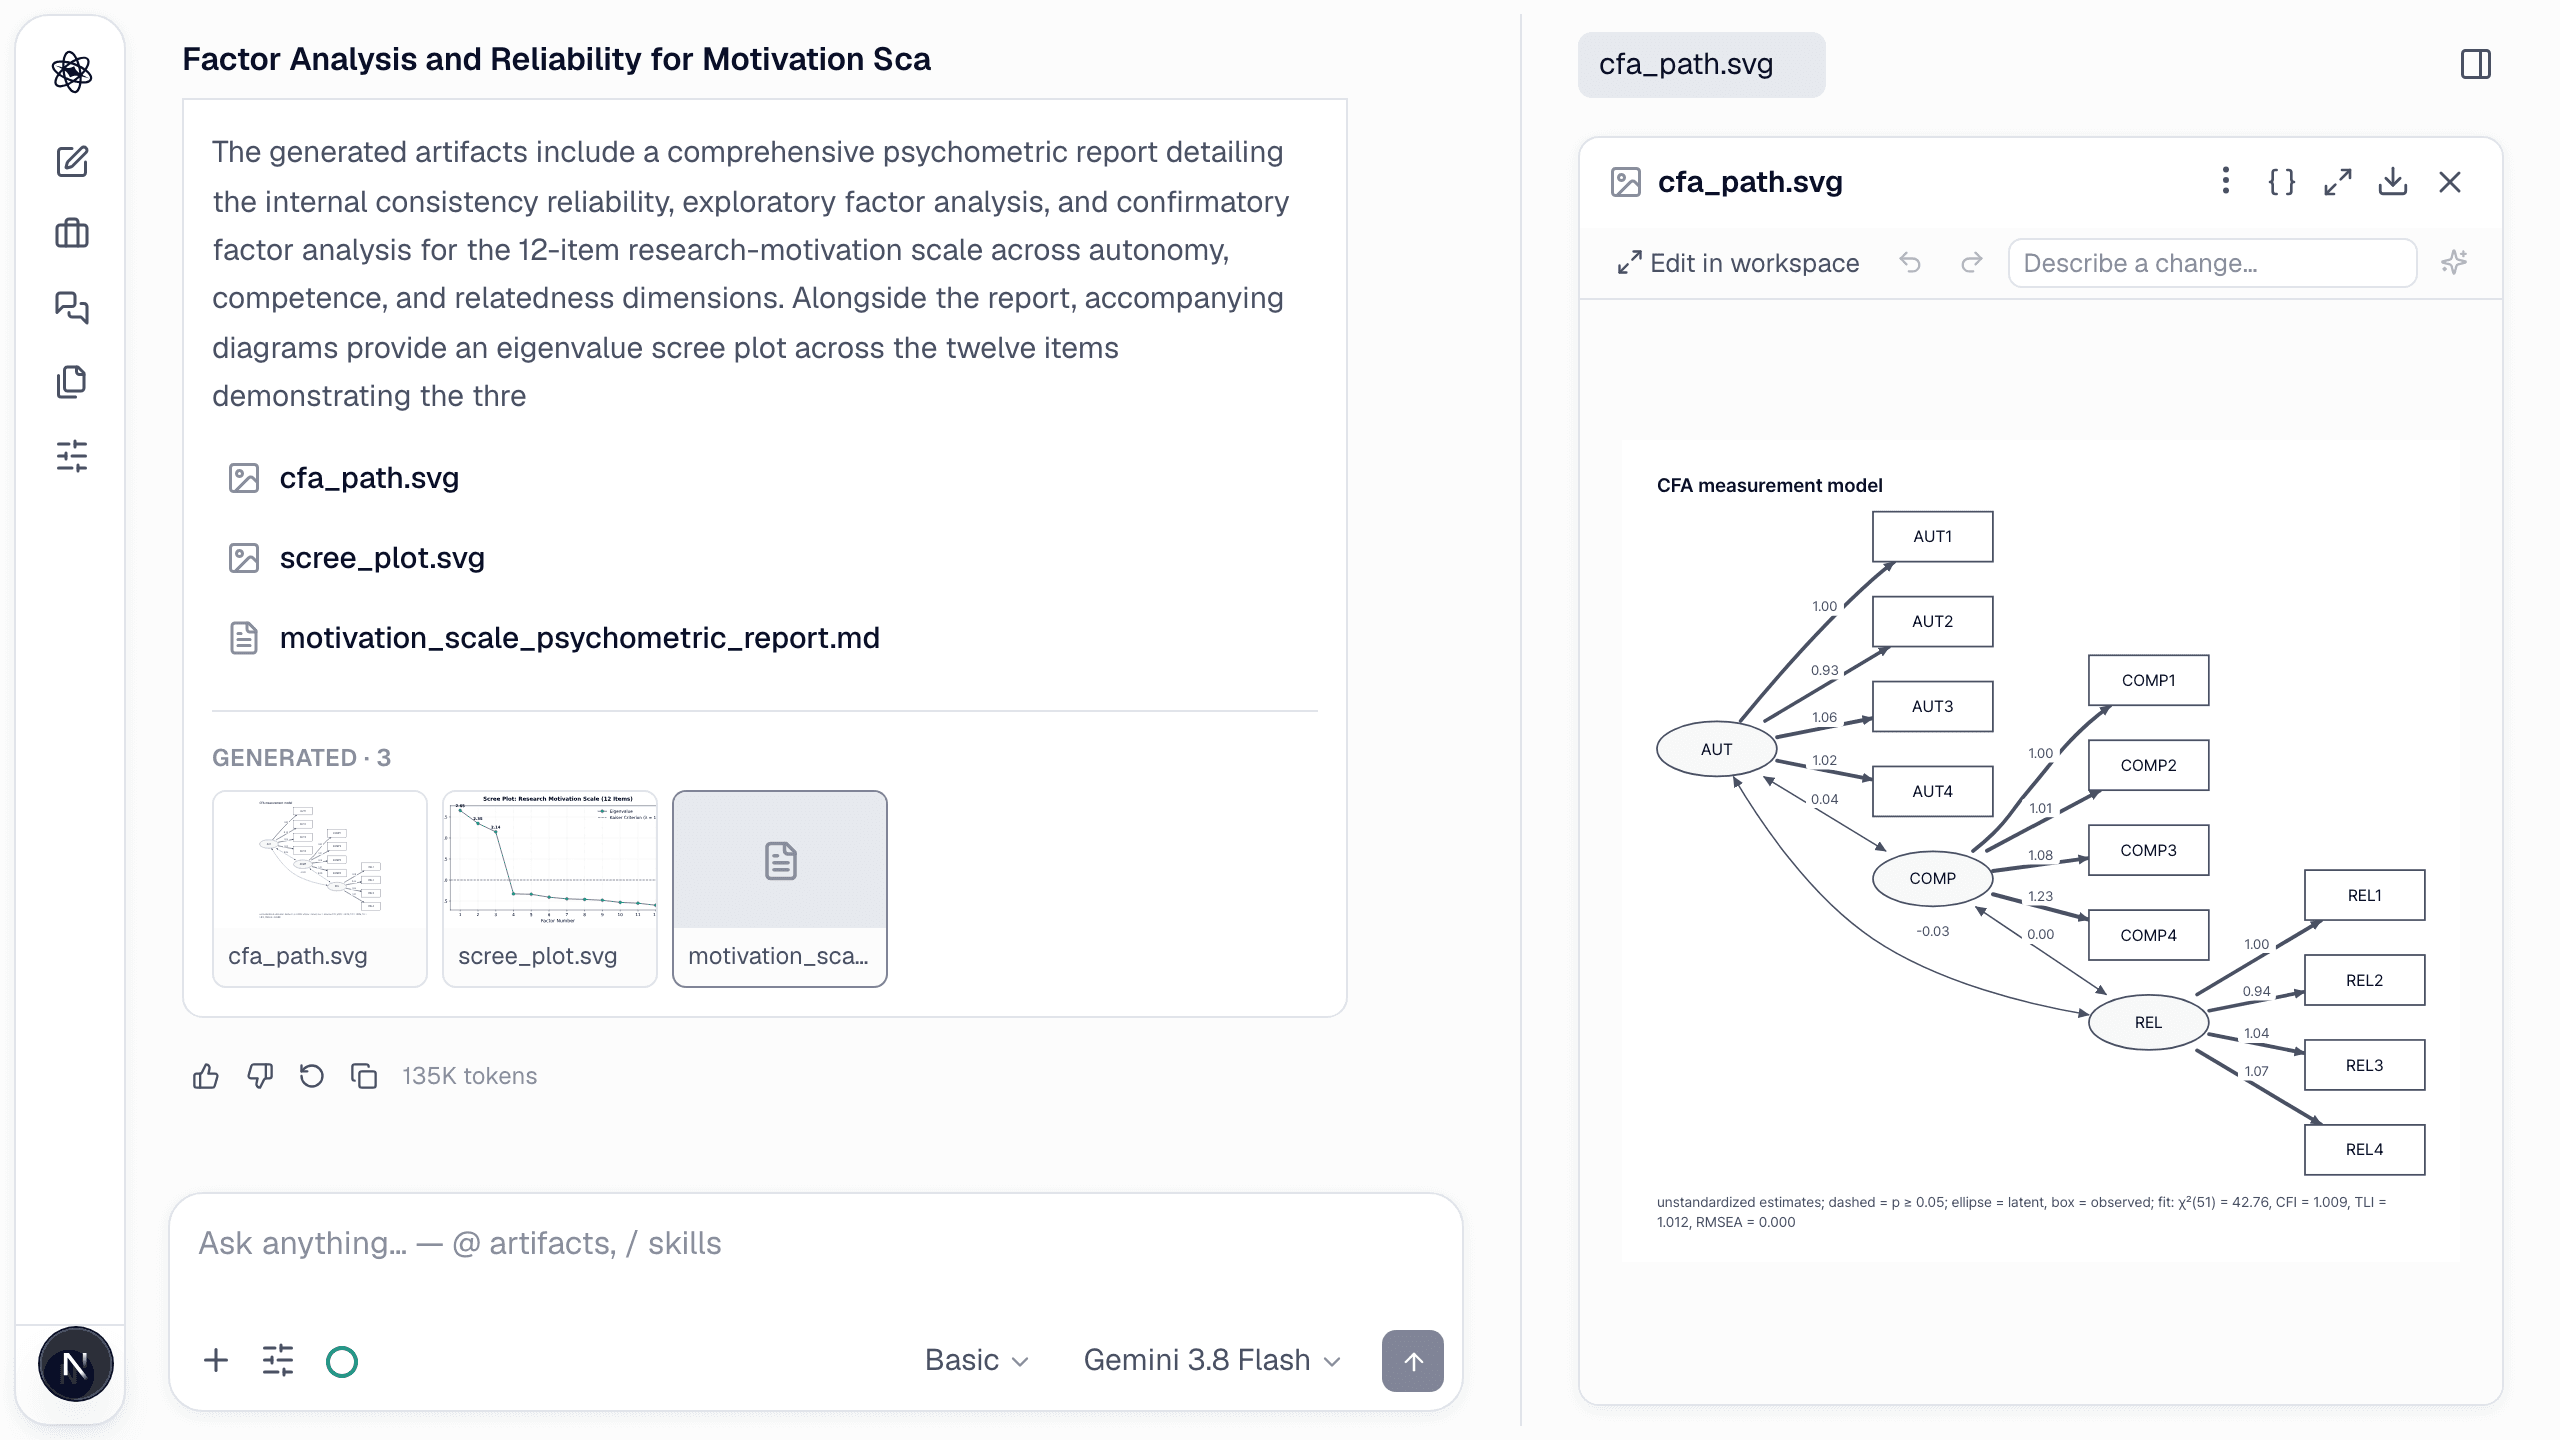
Reliability (Cronbach's α, McDonald's ω), EFA, CFA, SEM, IRT, mixed models, Bayesian estimation and power analysis are available as method skills — ask for them by name. See Neutropic for psychometrics.
Walkthrough: Running the statistics.