Scale validation is where psychology's methods are most codified and most often botched under deadline: an alpha reported without omega, an EFA whose rotation is never stated, a CFA whose fit indices are printed but not read. Neutropic runs the whole sequence — reliability, exploratory and confirmatory factor analysis — from one message, and shows its reasoning. The screenshots are from one real session on a 12-item research-motivation scale (N = 320, sample data).
Step 1 — Describe the scale, not the software
Attach the item-level data and say what the scale is supposed to measure. The statistics skill identifies the design (three hypothesized subscales, four items each) and plans reliability → EFA → CFA.
/stats The uploaded motivation_scale_items.csv holds 12 five-point items of a research-motivation scale (AUT1-4 autonomy, COMP1-4 competence, REL1-4 relatedness; N = 320). Run reliability (Cronbach's alpha and McDonald's omega per subscale), an exploratory factor analysis, and a three-factor CFA, and report fit indices and the loading table with figures.
Step 2 — Reliability as alpha and omega, with intervals
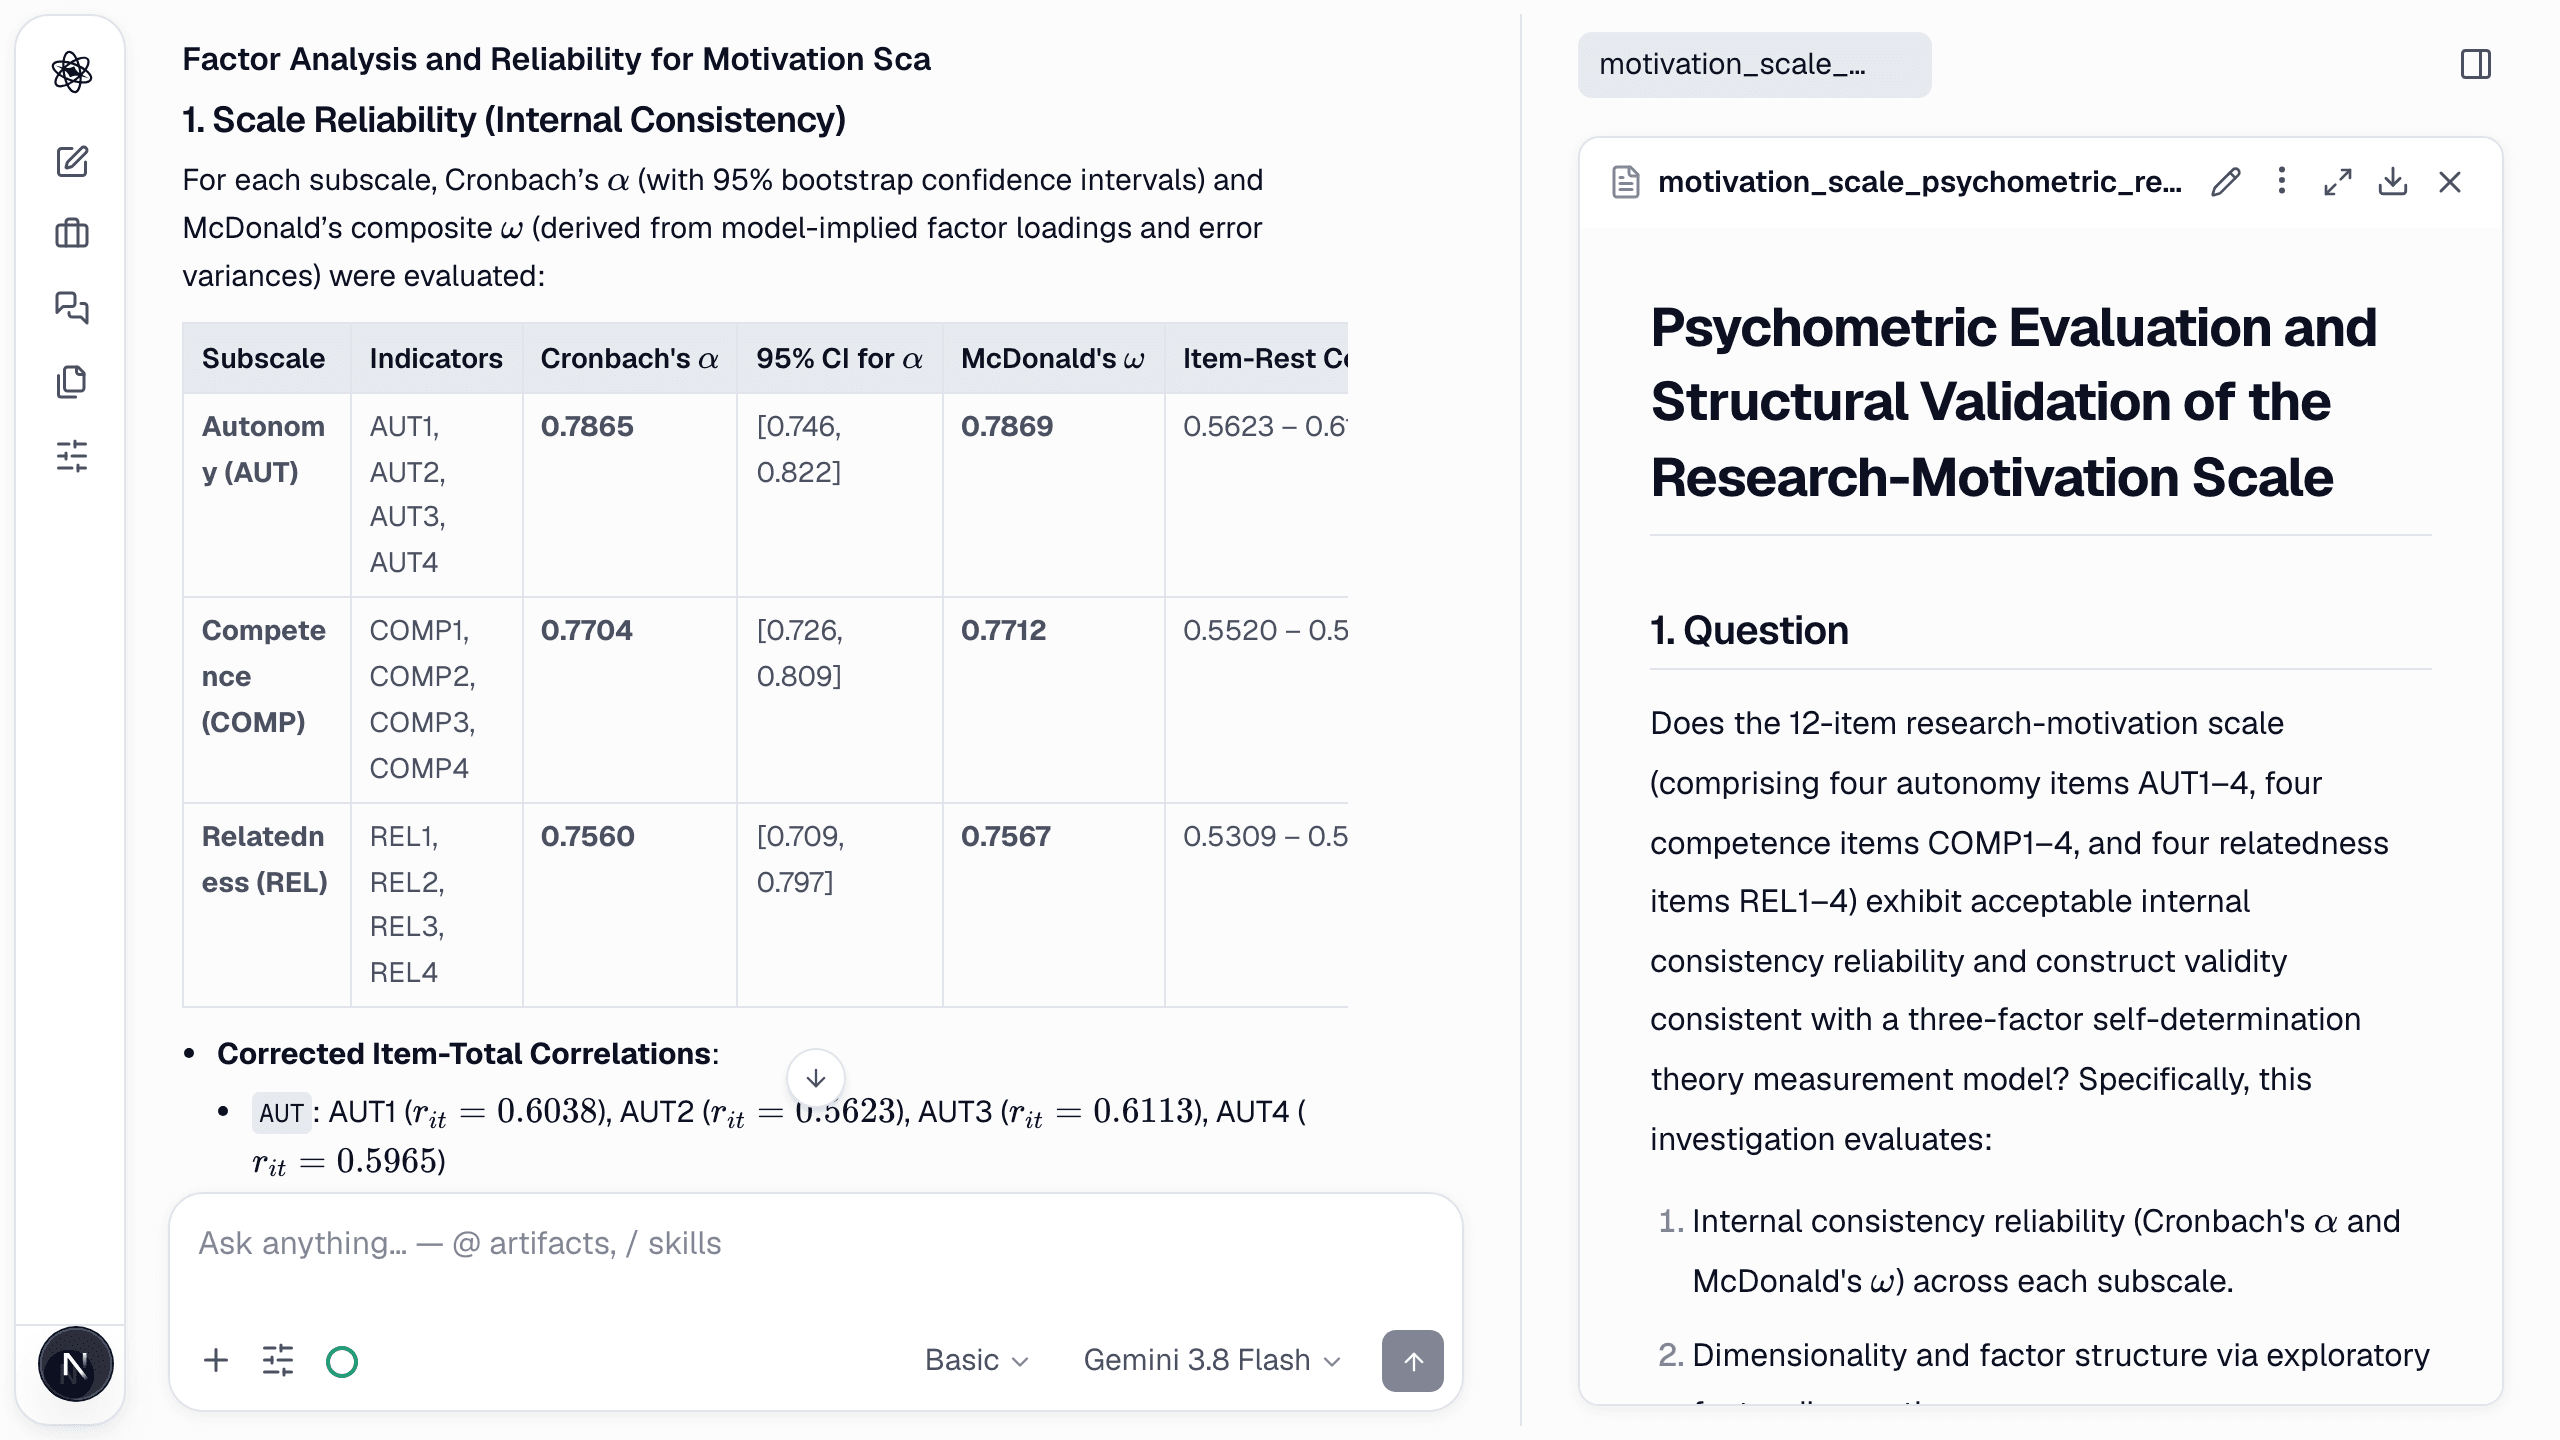
Each subscale gets Cronbach's α with a bootstrap confidence interval, McDonald's ω, and corrected item-rest correlations — so an item that drags its scale down is visible before the factor analysis, not after.
Step 3 — Dimensionality you can see
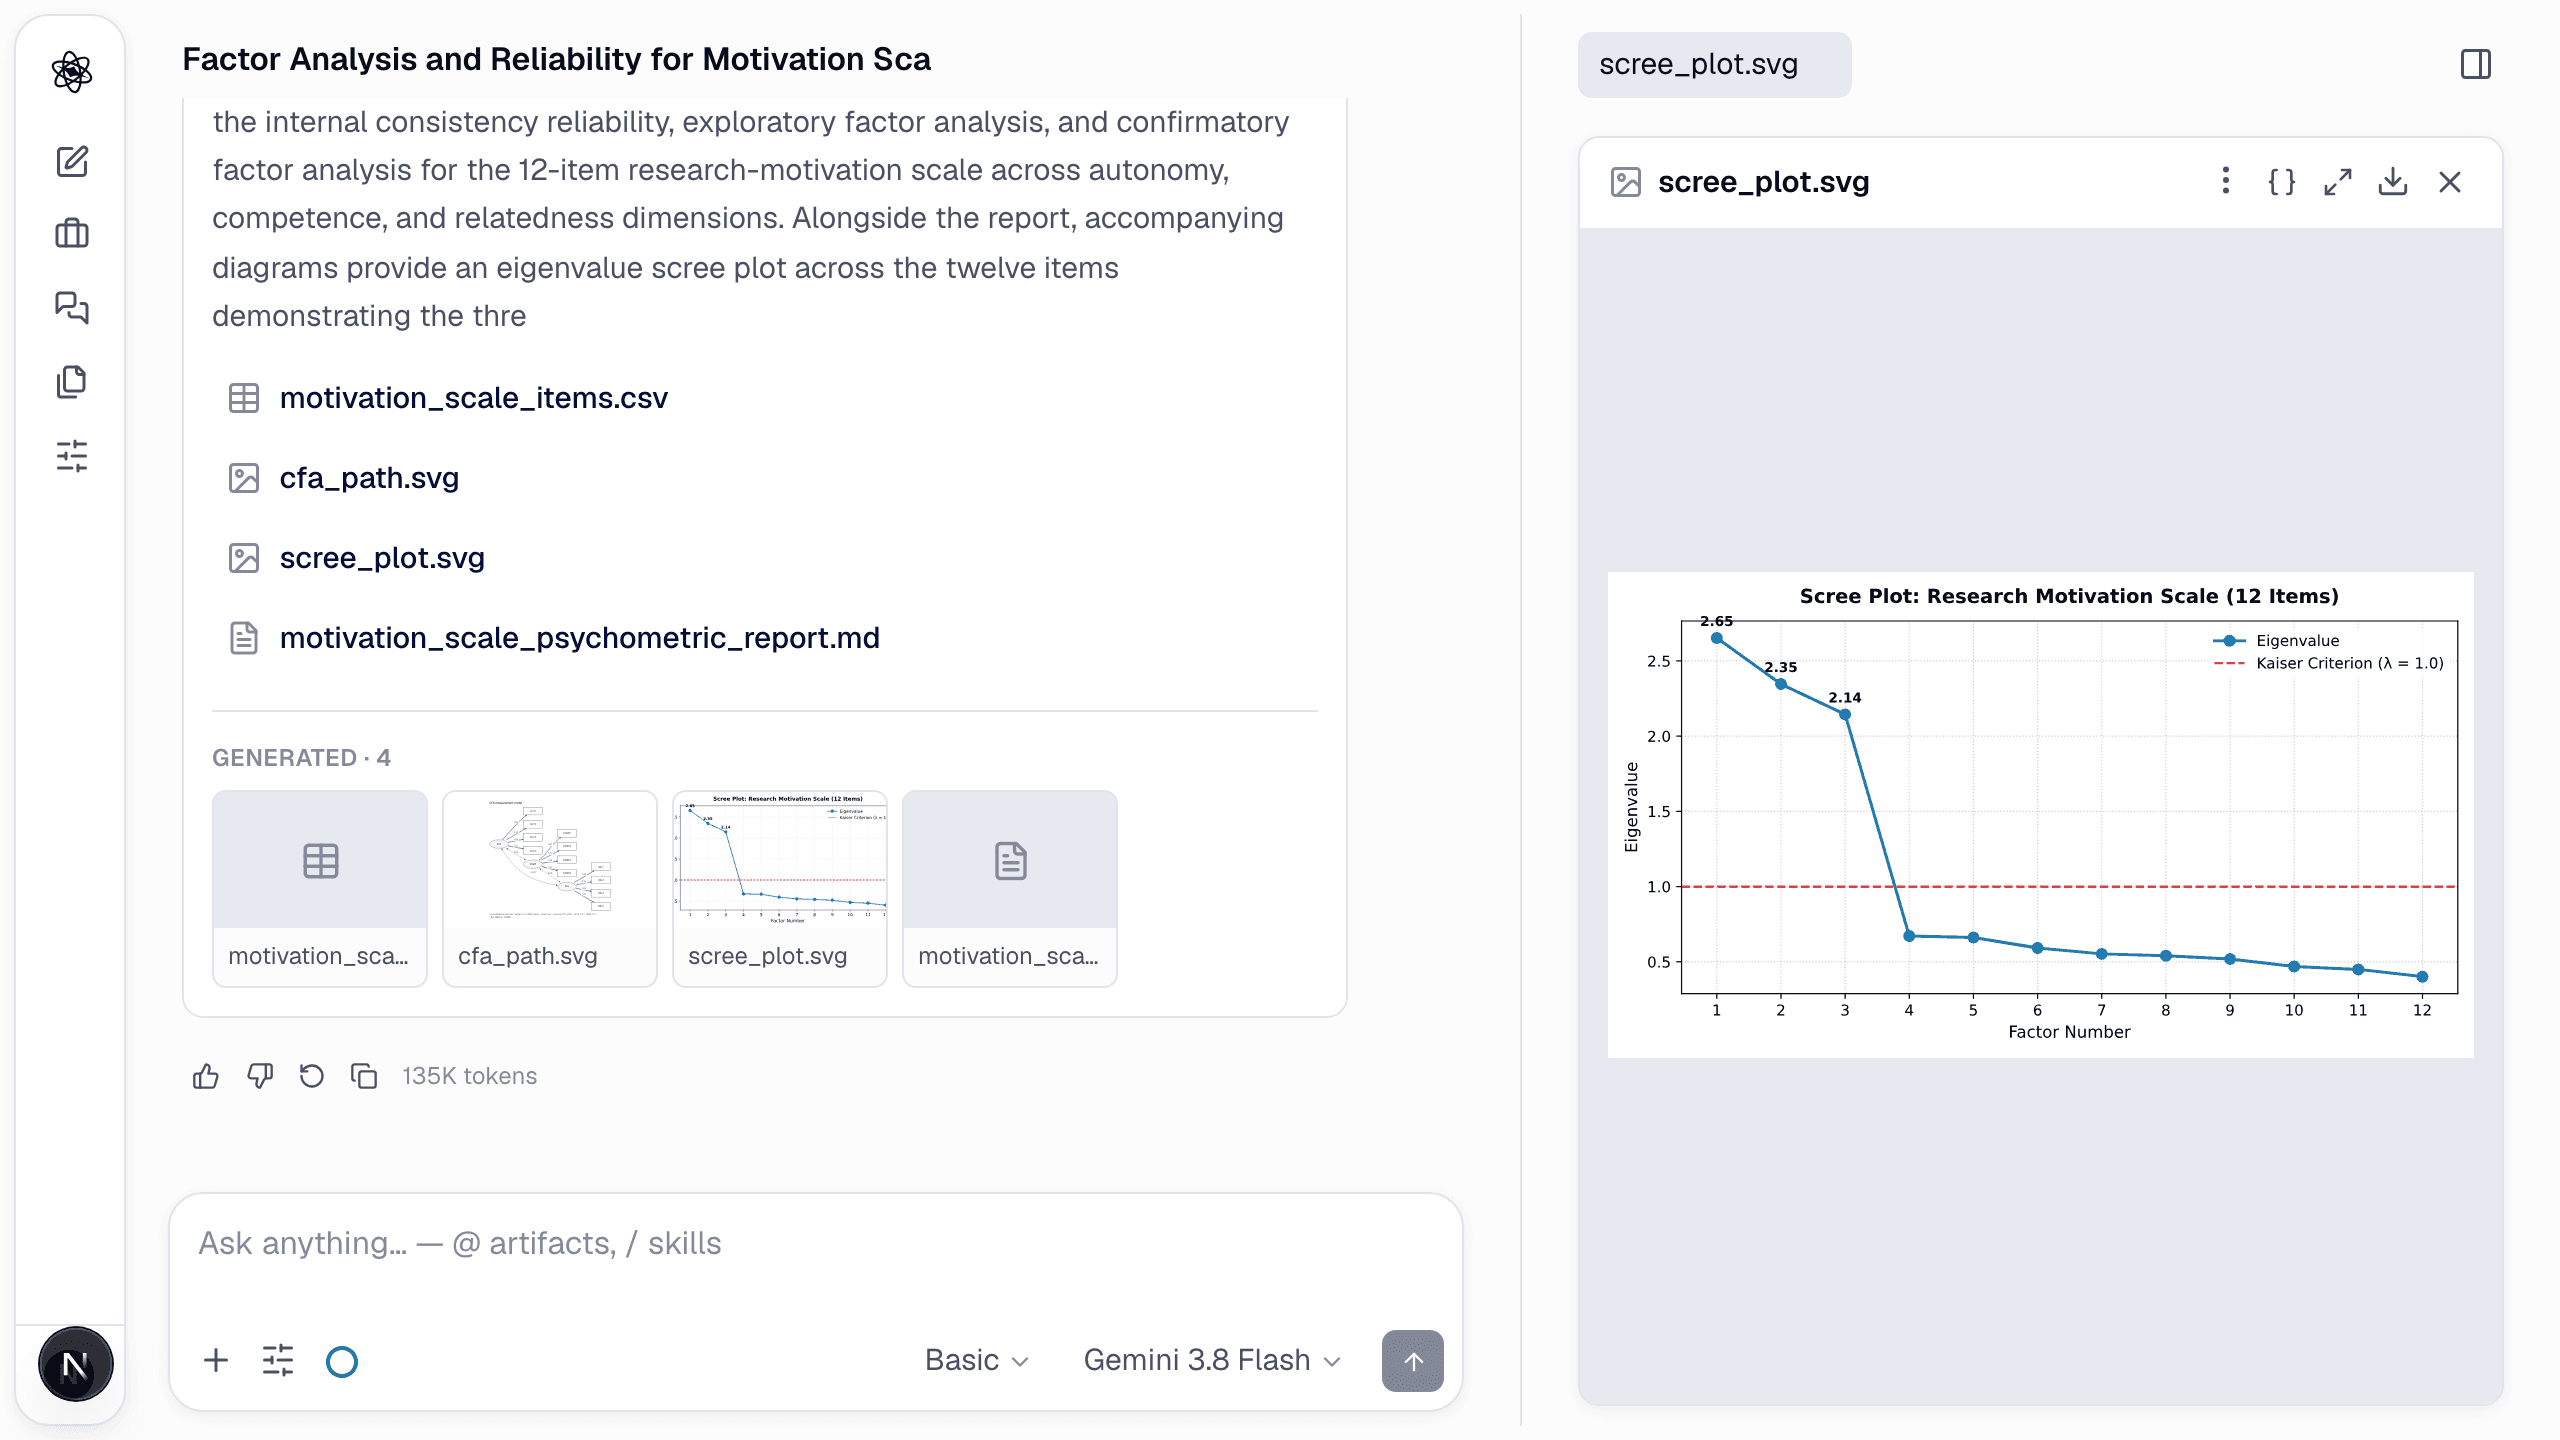
The exploratory analysis reports eigenvalues against the Kaiser criterion and parallel analysis on a scree plot, so the number of factors is a judgment you can inspect rather than a default you inherit.
Step 4 — The measurement model, drawn
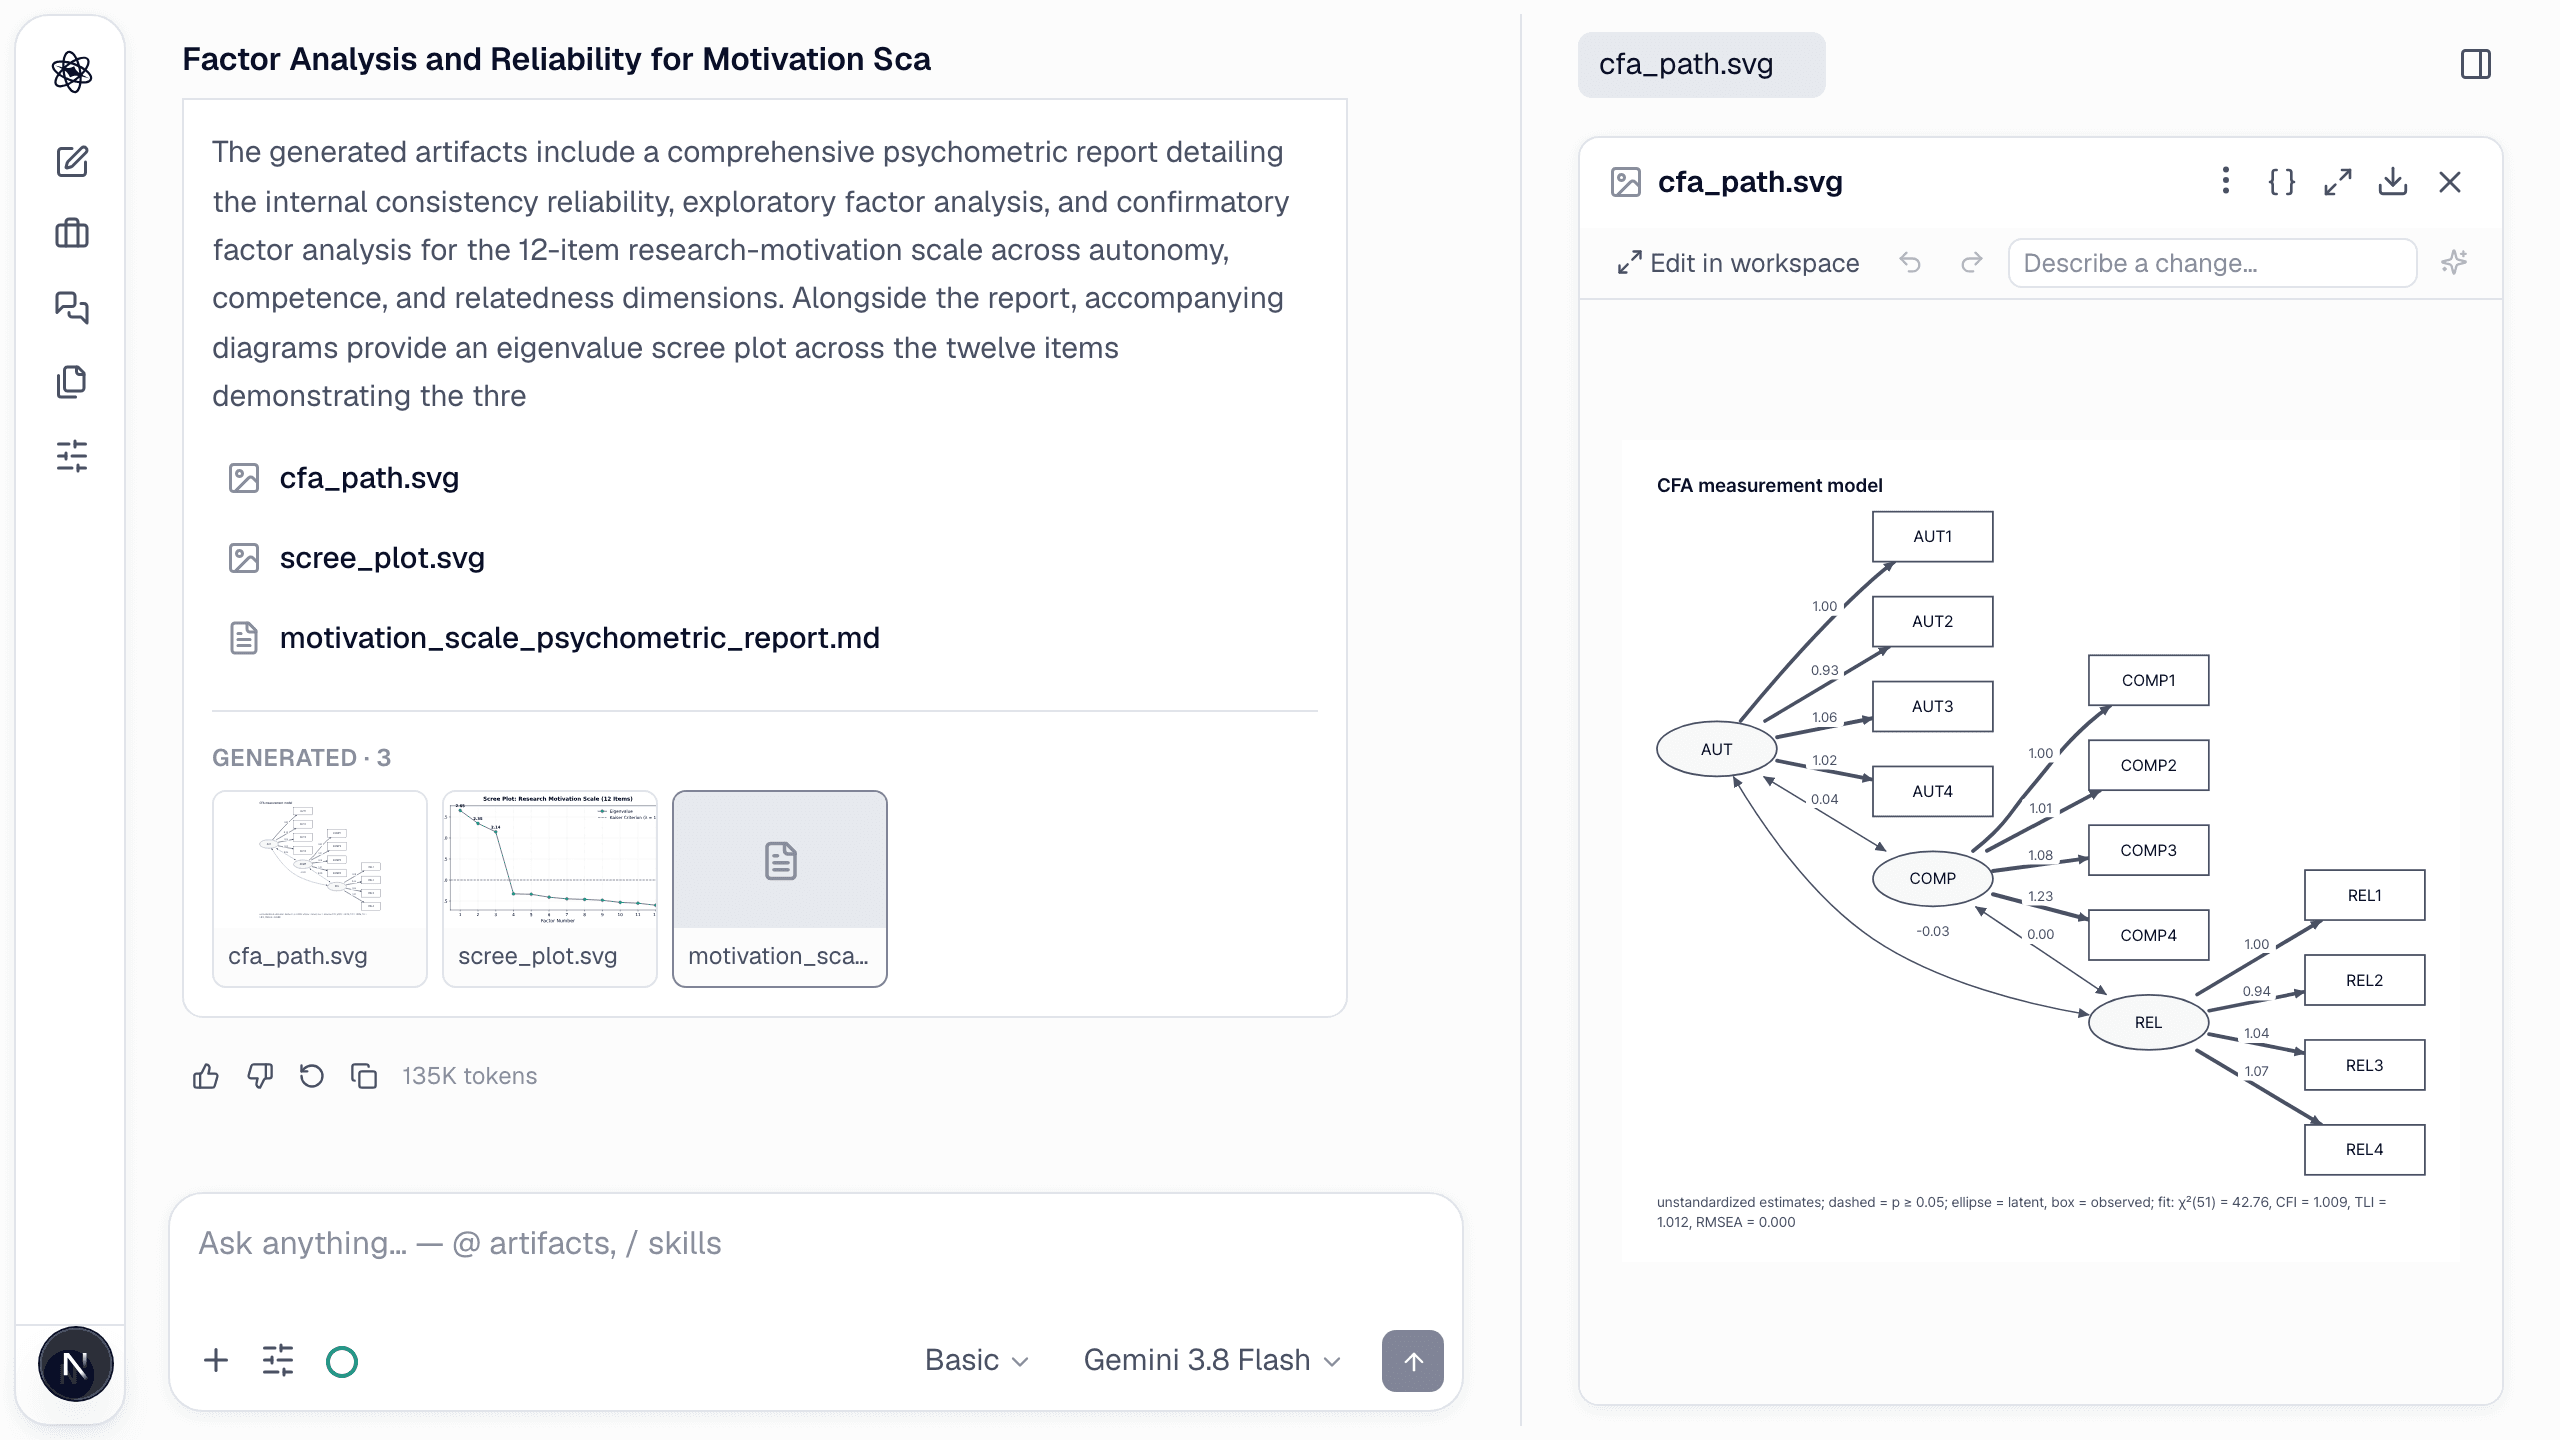
The three-factor CFA is drawn as a path diagram — latent variables as ellipses, indicators as boxes, loadings on the arrows, non-significant paths dashed — with the fit indices in the caption: χ²(51) = 42.8, CFI = 1.01, TLI = 1.01, RMSEA = 0.000. The figure is an editable vector, ready for the paper.
Also native
- SEM with mediation and moderation paths, fit compared across nested models.
- Item response theory (1PL–3PL, graded response) with item information curves.
- Measurement invariance across groups, reported as the configural → metric → scalar sequence.
Every number traceable
The report, the loading tables and the figures all carry the code that produced them, and the review agent checks the assumptions — sample size for the factor solution, multivariate normality, the fit-index thresholds actually applied — before the results are presented as findings.