Figures are where a study becomes visible — and where most labs still lose an afternoon to PowerPoint arrows. Neutropic draws figures as native vector objects you can keep editing until submission: diagrams (study flows, frameworks, path models, pipelines) and scientific illustrations (apparatus, rigs, anatomy, procedures). Here is how both happened in the same session as the trial above.
Step 1 — Ask for a diagram from what the session already knows
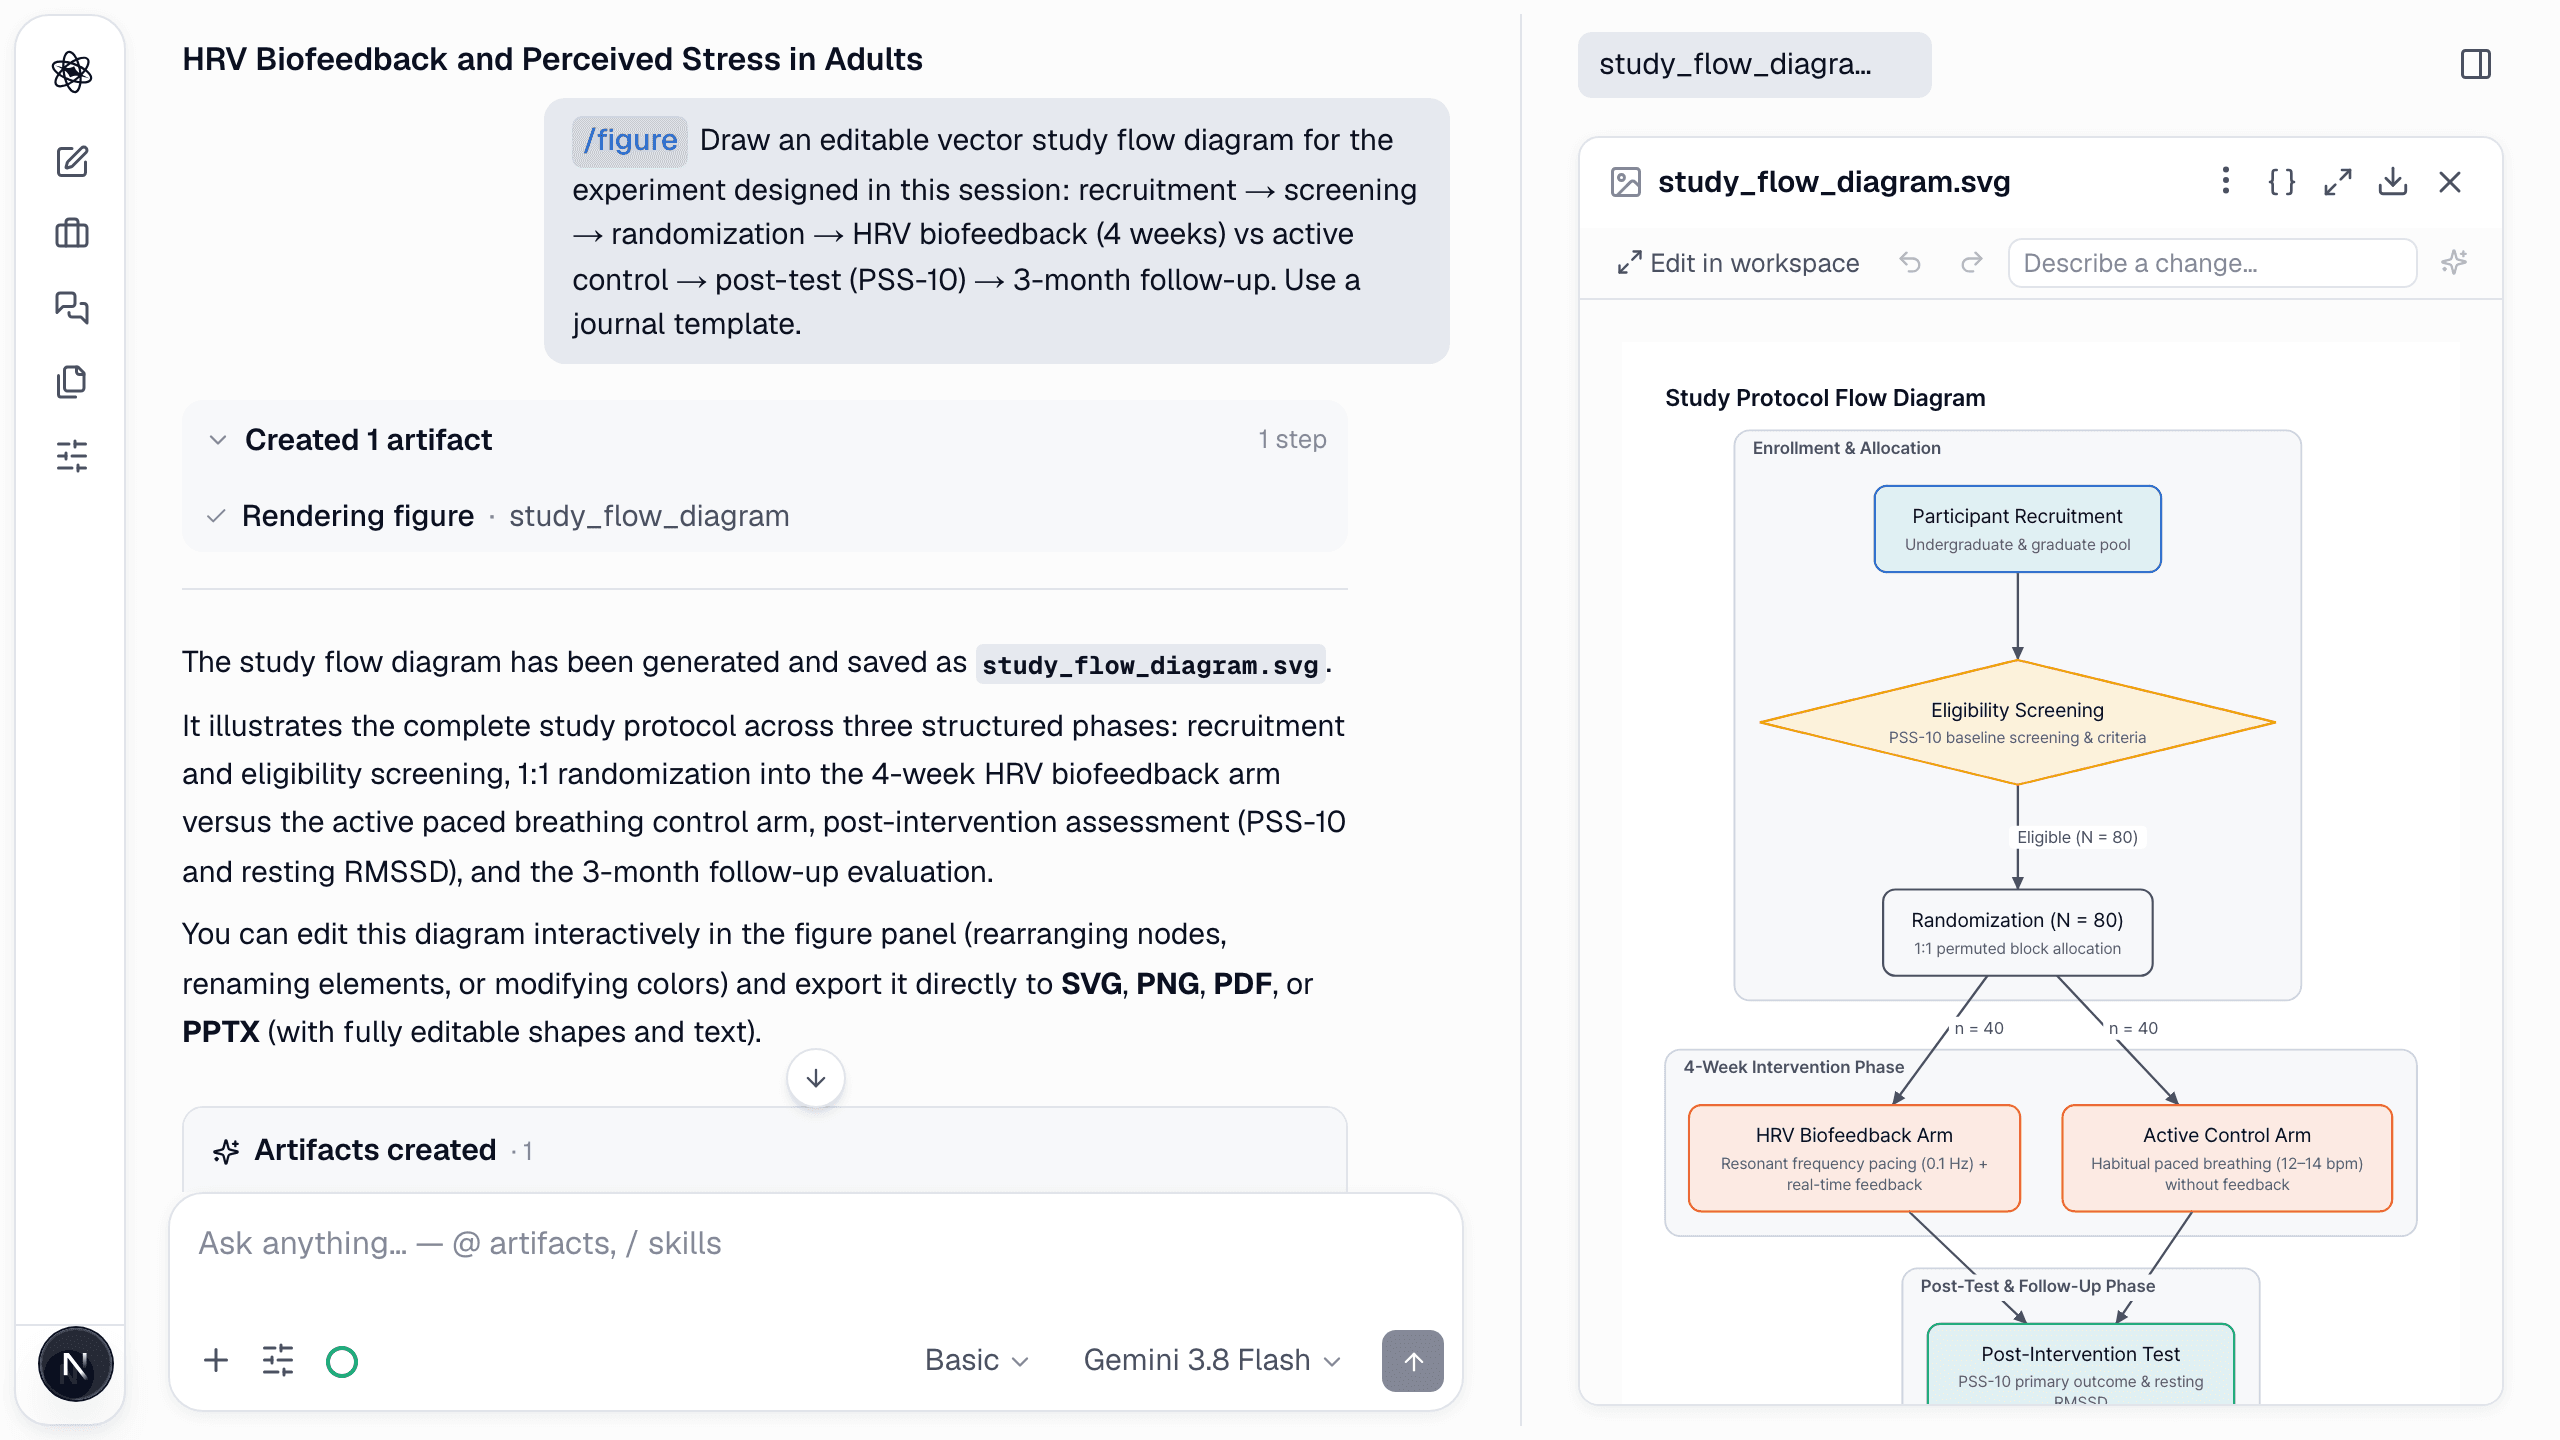
The /figure command reads the design earlier in the chat, so you describe the figure, not the study. A journal template is one word away.
/figure Draw the study flow diagram for the experiment designed in this session: recruitment → screening → randomization → HRV biofeedback (4 weeks) vs active control → post-test (PSS-10) → 3-month follow-up. Use a journal template.
Step 2 — Get an editable diagram, not a picture
The result is a native vector figure — grouped phases, arms, sample sizes on the arrows — that opens in an editor, not a preview. Drag nodes, rename labels, or type a change in plain language ("make the follow-up box green") in the "Describe a change…" box and the figure is revised in place, with undo and redo.
Step 3 — Open the full editor when you need precision
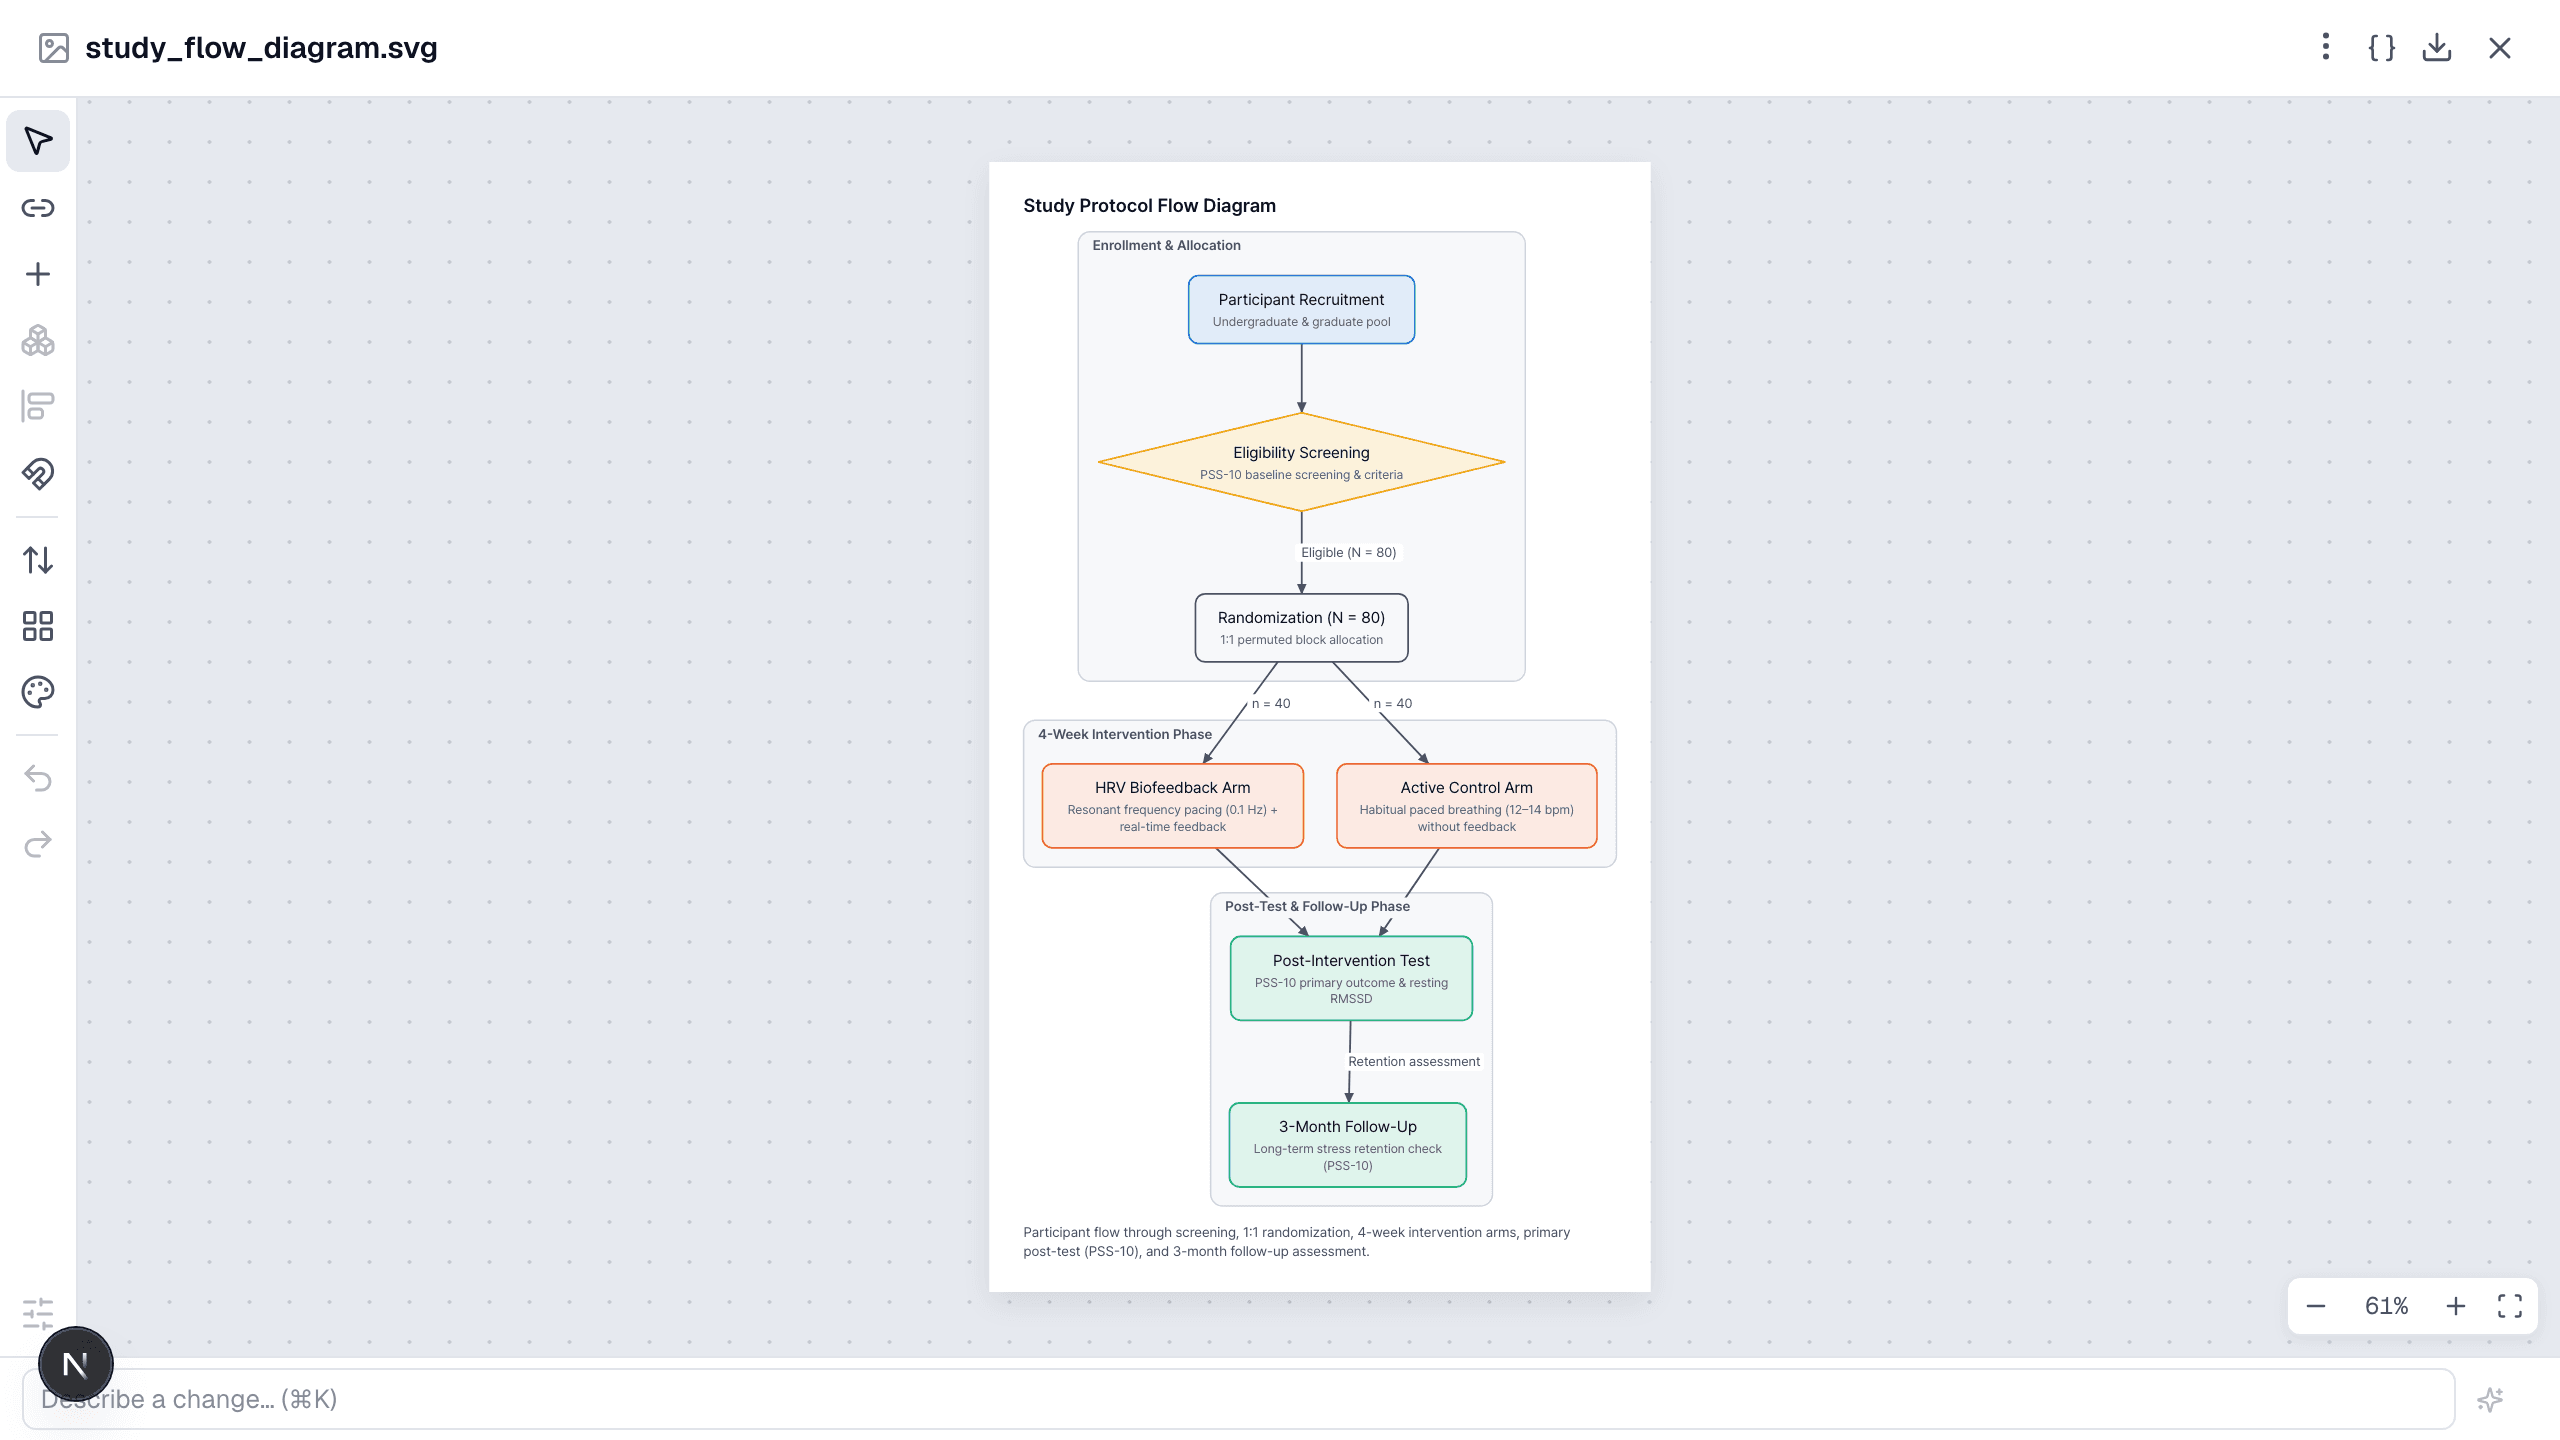
"Edit in workspace" opens the figure on its own page: select any shape to see its points, shift-click to select several, align and recolor, and save a new version — the chat keeps the history.
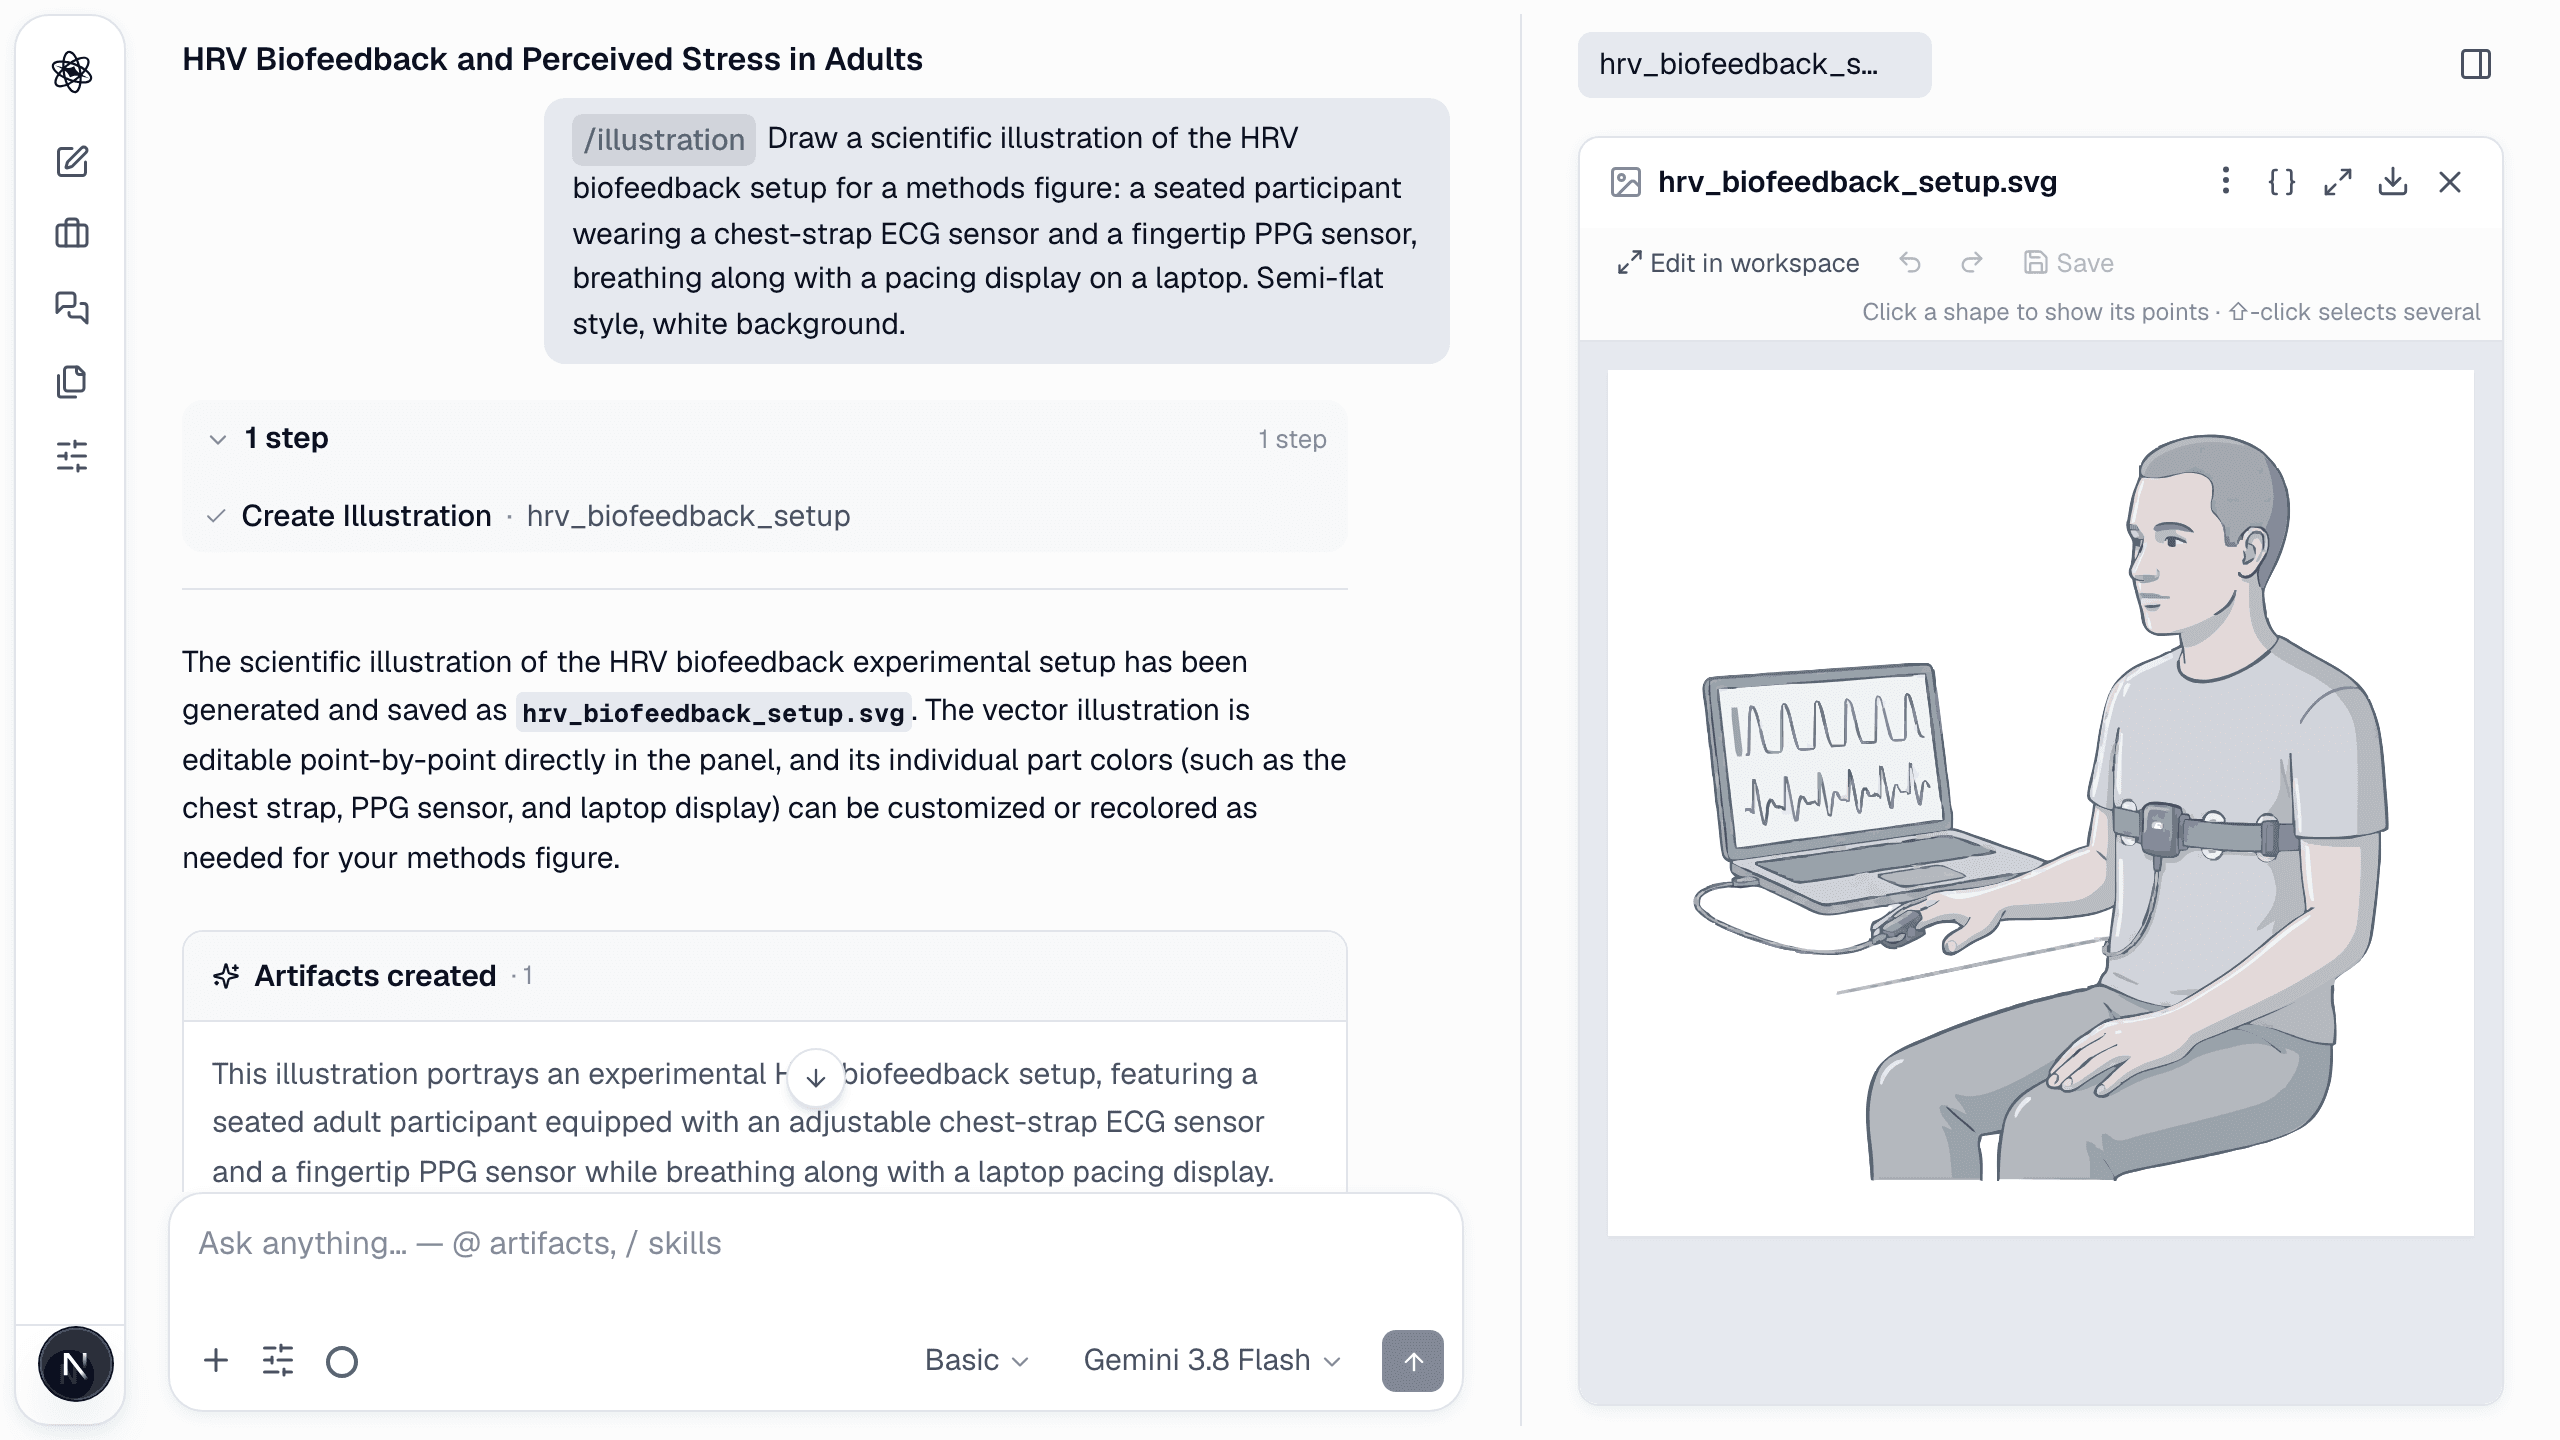
Step 4 — Ask for an illustration for the methods figure
Diagrams show structure; illustrations show the thing itself. The /illustrate command turns a description of an apparatus, a recording rig, a body structure or a procedure into a scientific vector illustration in a consistent semi-flat style — the kind that sits in a methods figure or a slide without looking like clip art.
/illustrate Draw a scientific illustration of the HRV biofeedback setup for a methods figure: a seated participant wearing a chest-strap ECG sensor and a fingertip PPG sensor, breathing along with a pacing display on a laptop. Semi-flat style, white background.
Step 5 — Compose and export
Illustrations can be placed inside a diagram as node icons, and several figures can be composed into a multi-panel figure with panel letters. Export any of them as SVG, PNG, PDF or PPTX with the shapes and text still editable — and because each figure records the session sources and results it was drawn from, the caption can cite them.
A figure you can still edit the night before submission is worth ten you have to redraw.