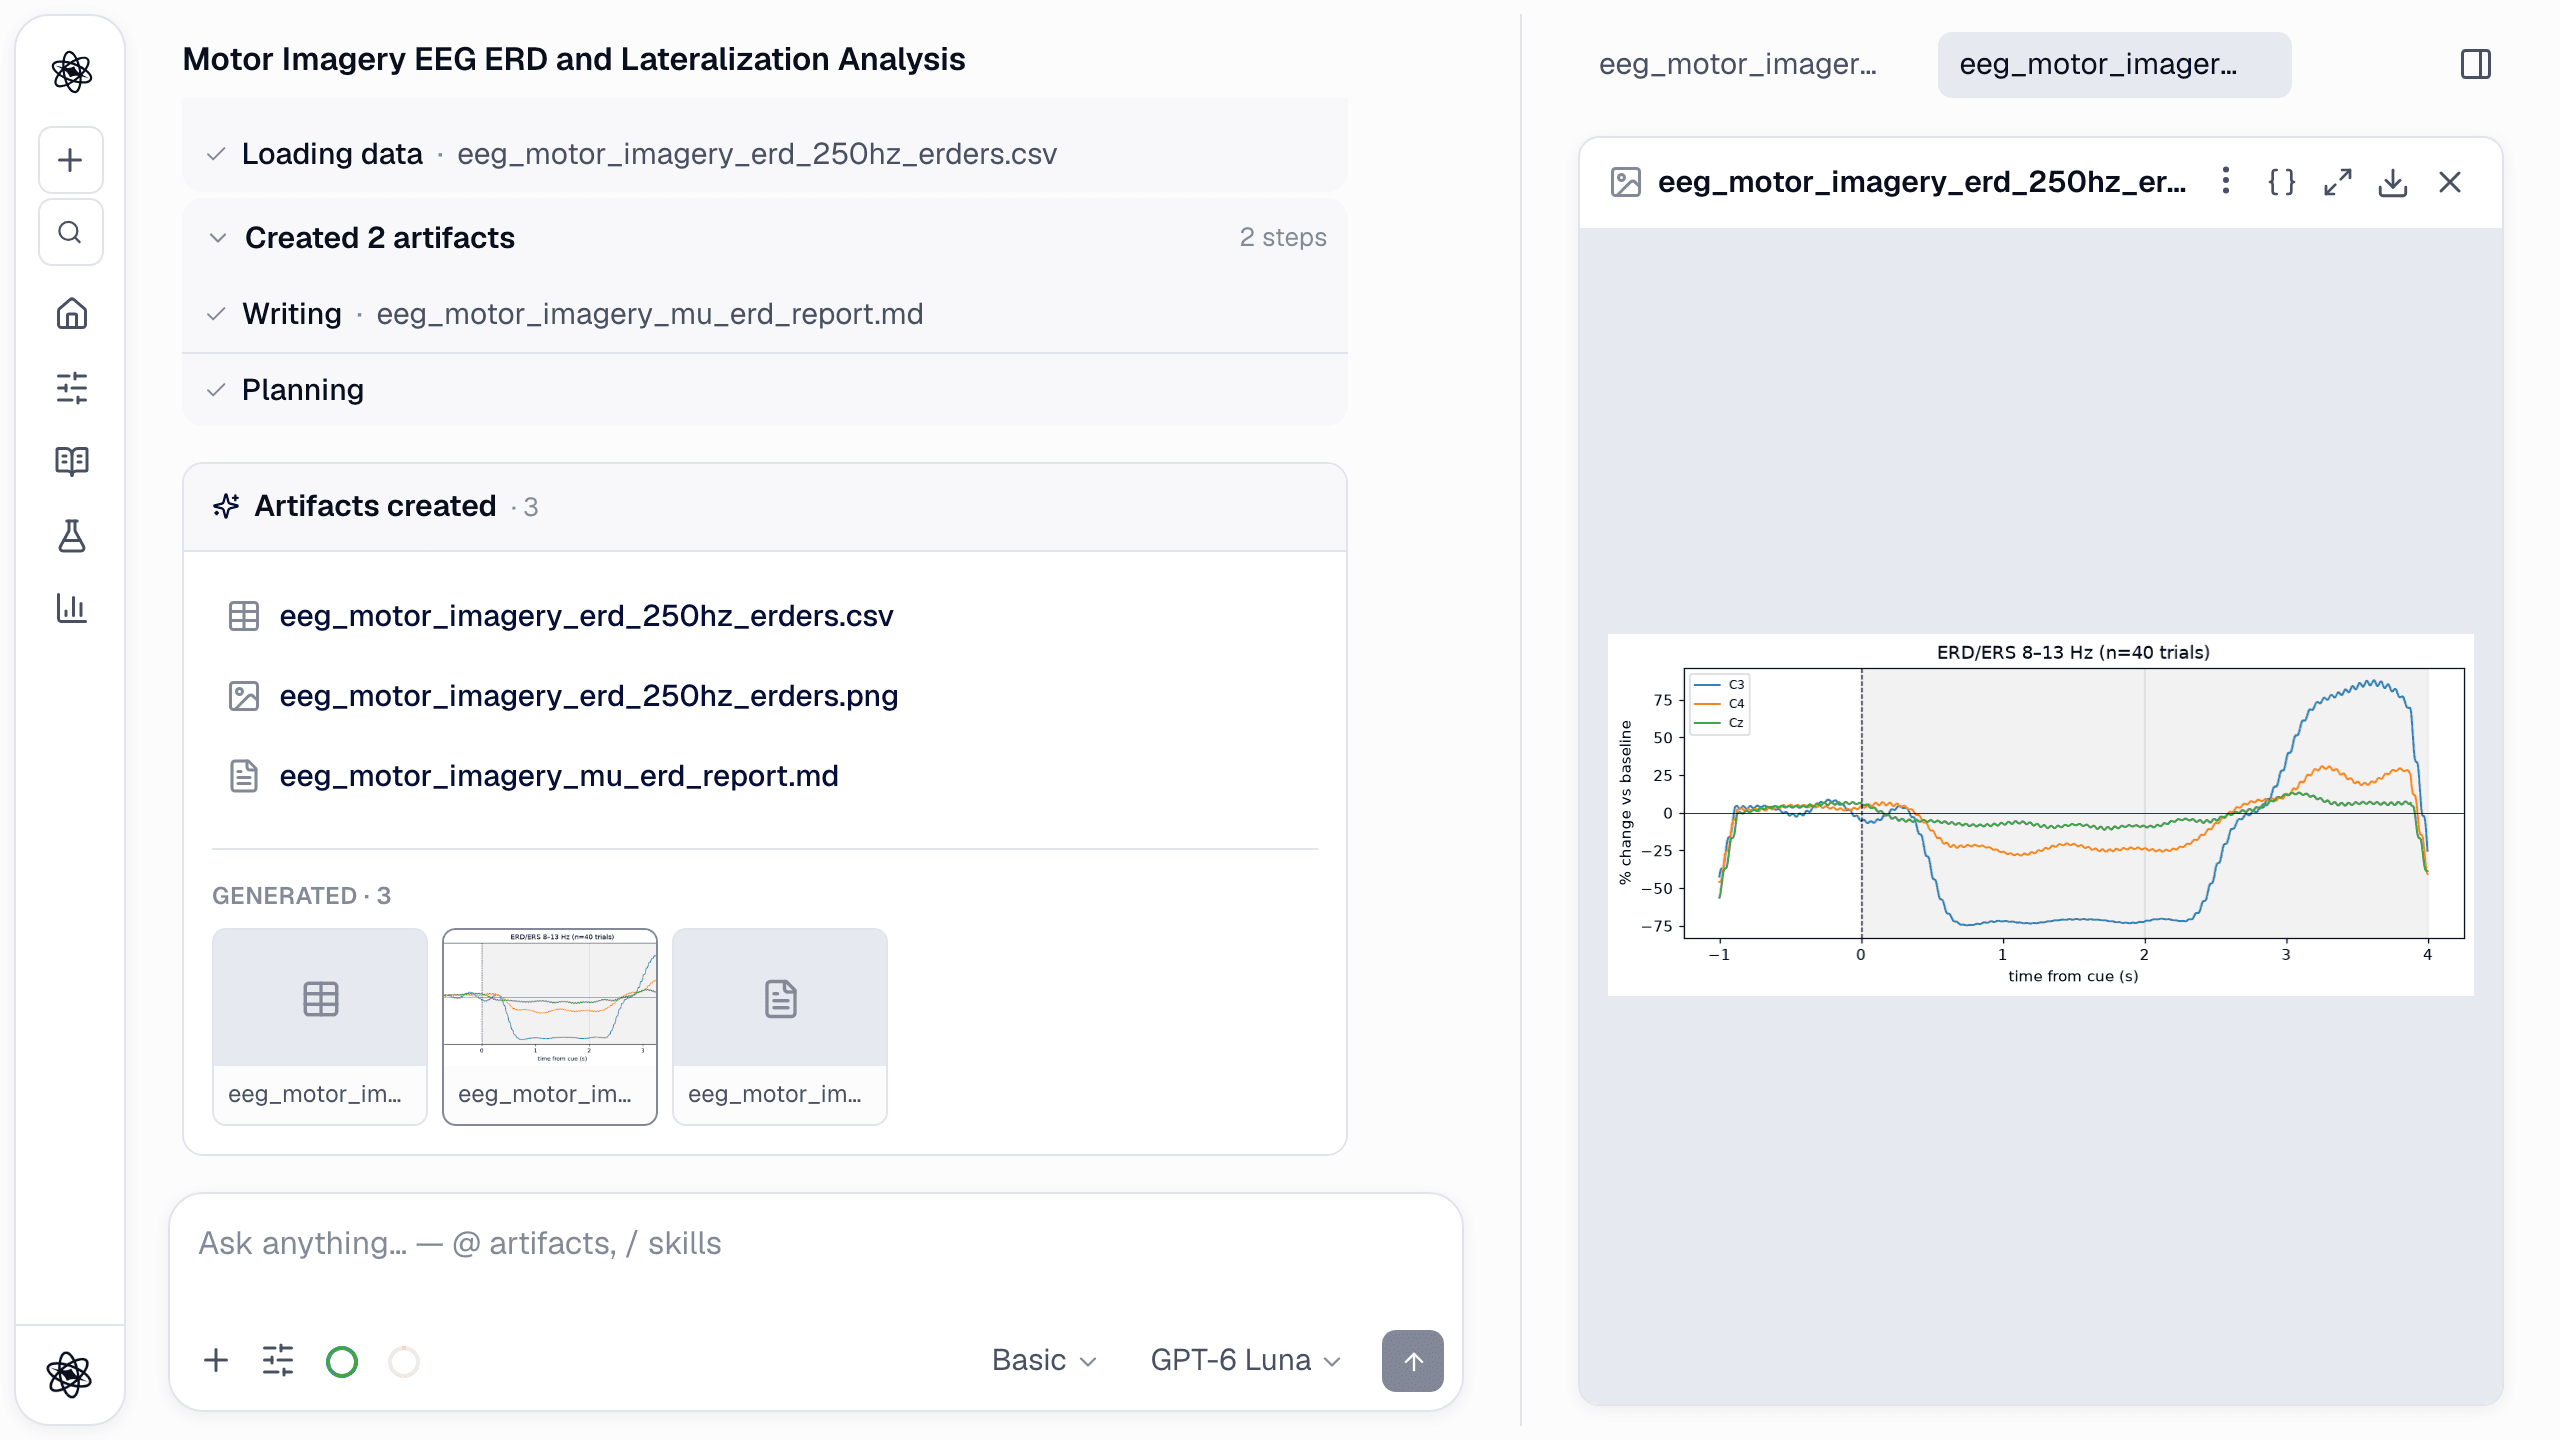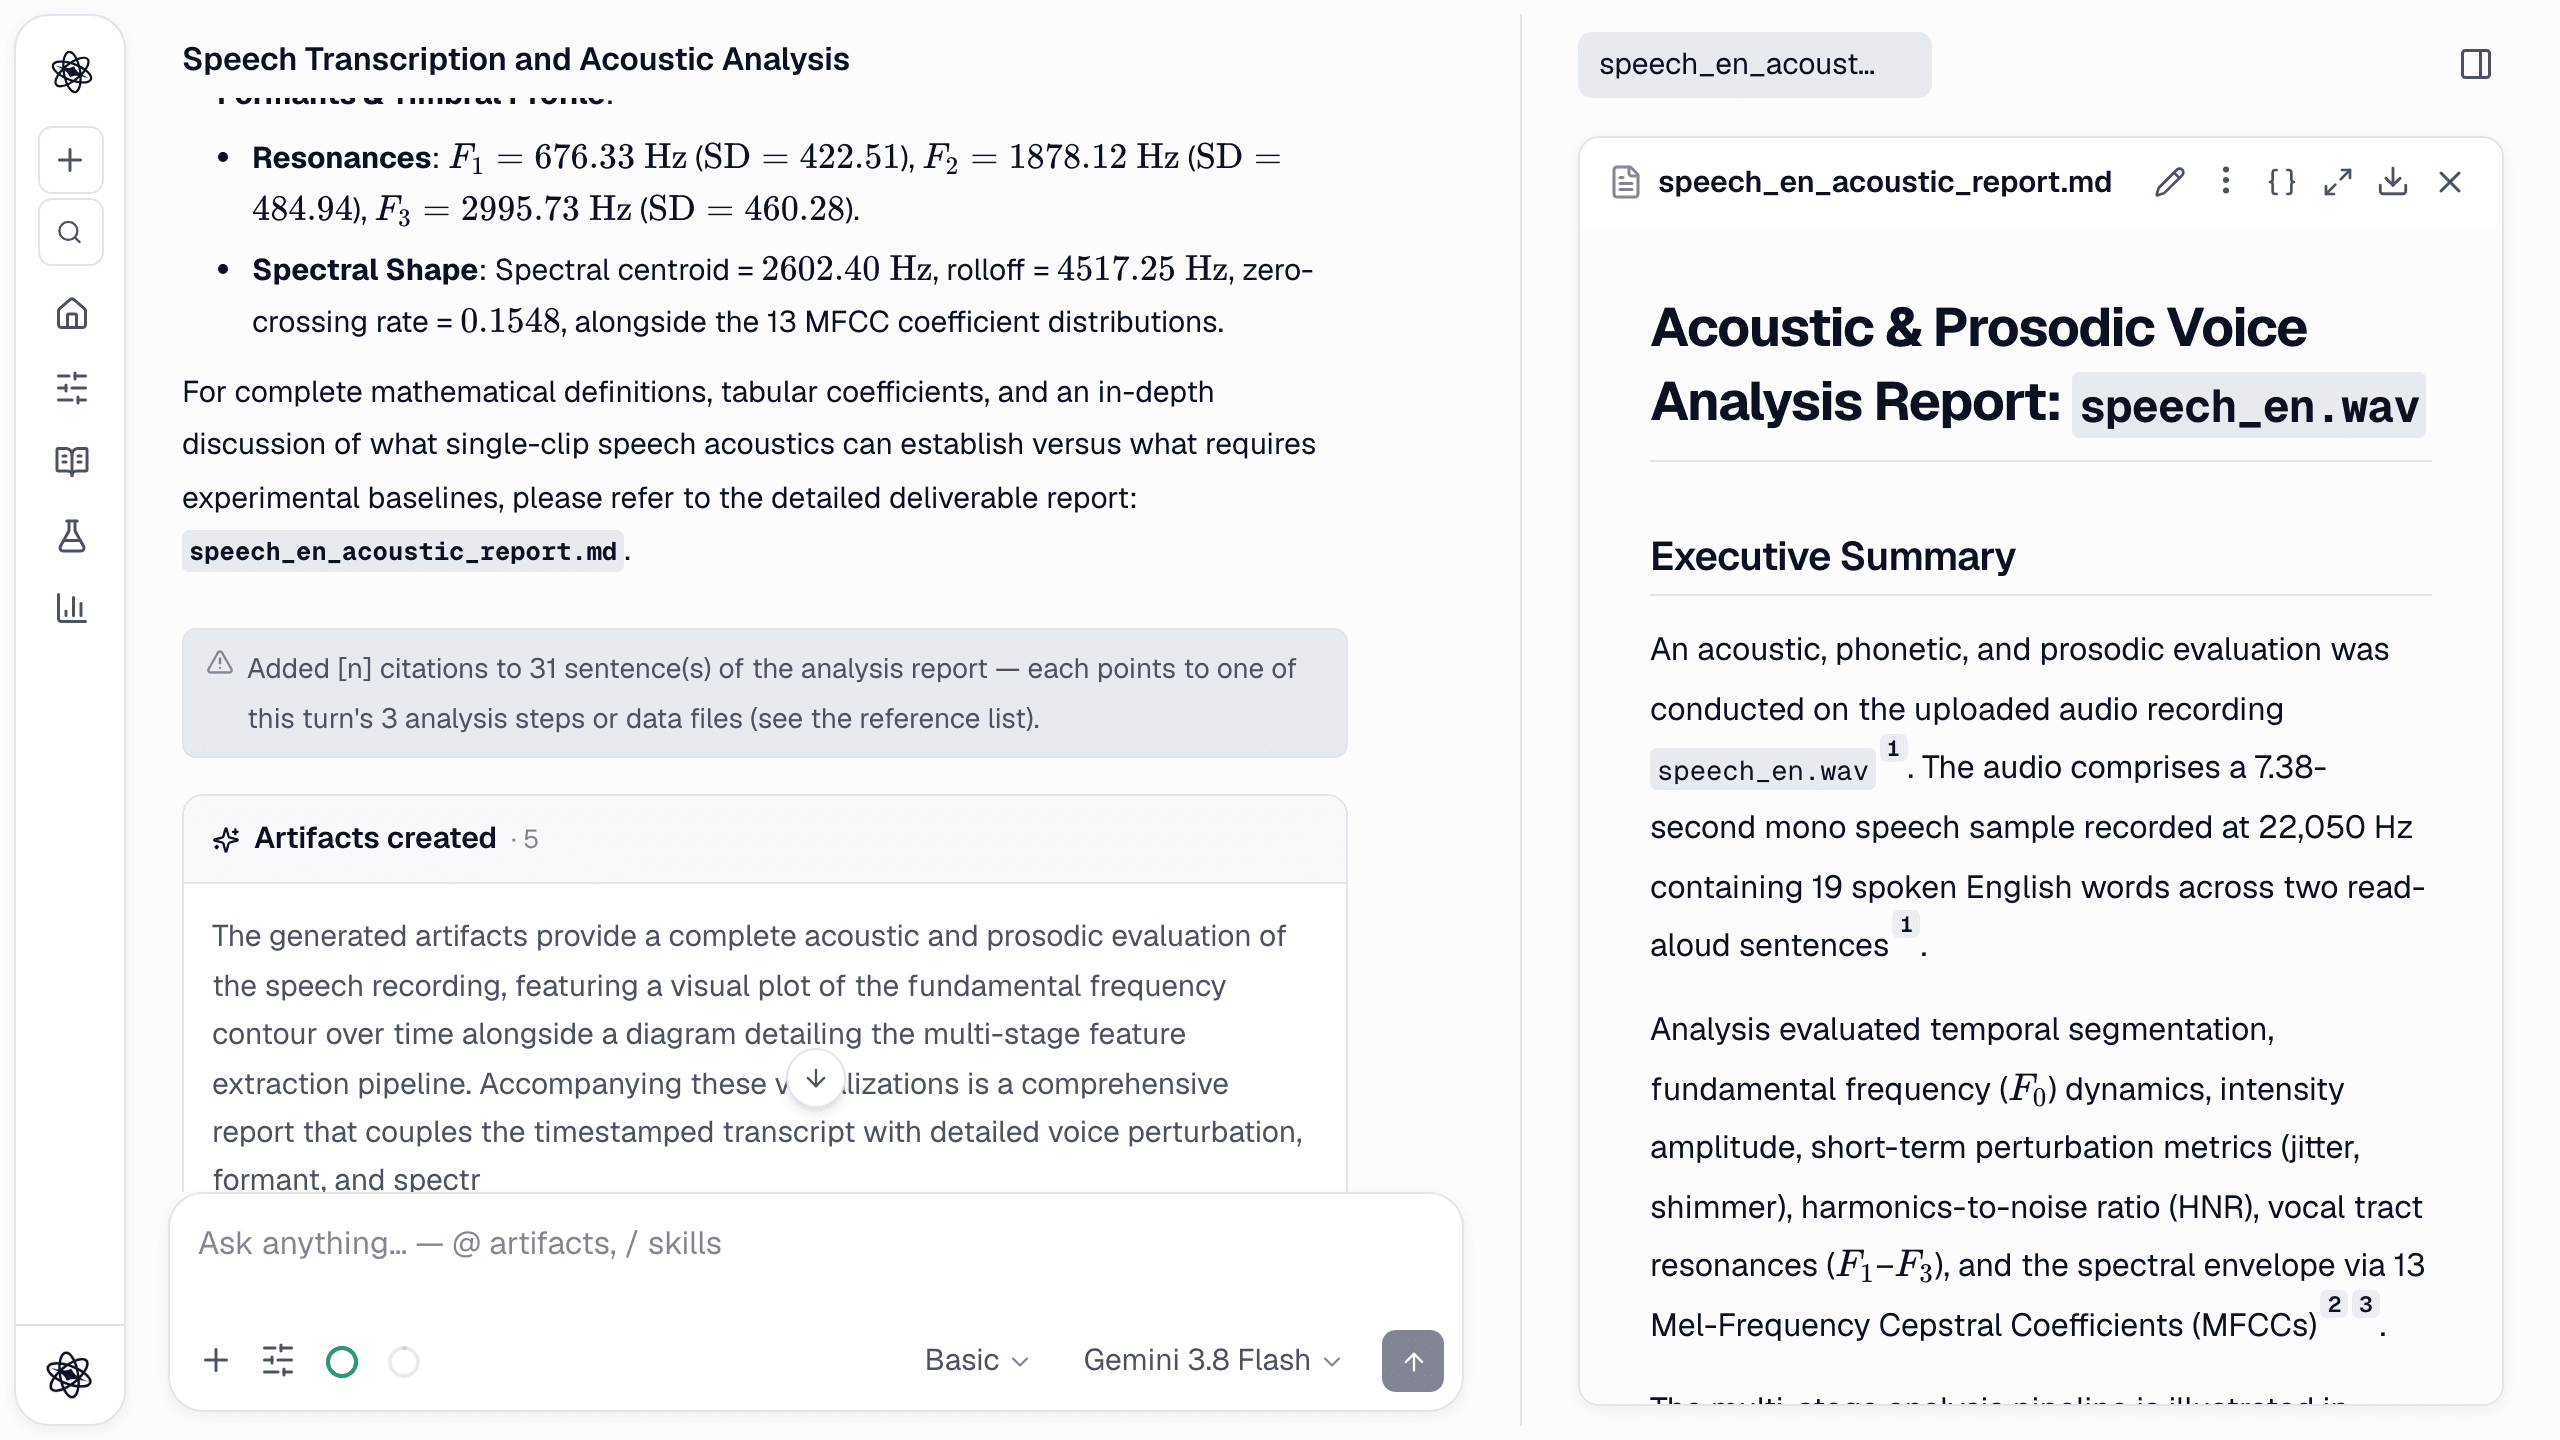
Between a hypothesis and a running study sits a wall of decisions: design type, conditions, measures, sample size, exclusion rules. Each one is defensible only in the context of the others — which is why design documents written piecemeal fall apart under review. Neutropic drafts the whole structure at once. Here is how it went in the same session, right after the literature review.
Step 1 — Describe the study you want to run
One message, in the same chat. Because the literature is already in the session, the agent knows what an "active control" usually means in this field and which instruments are standard.
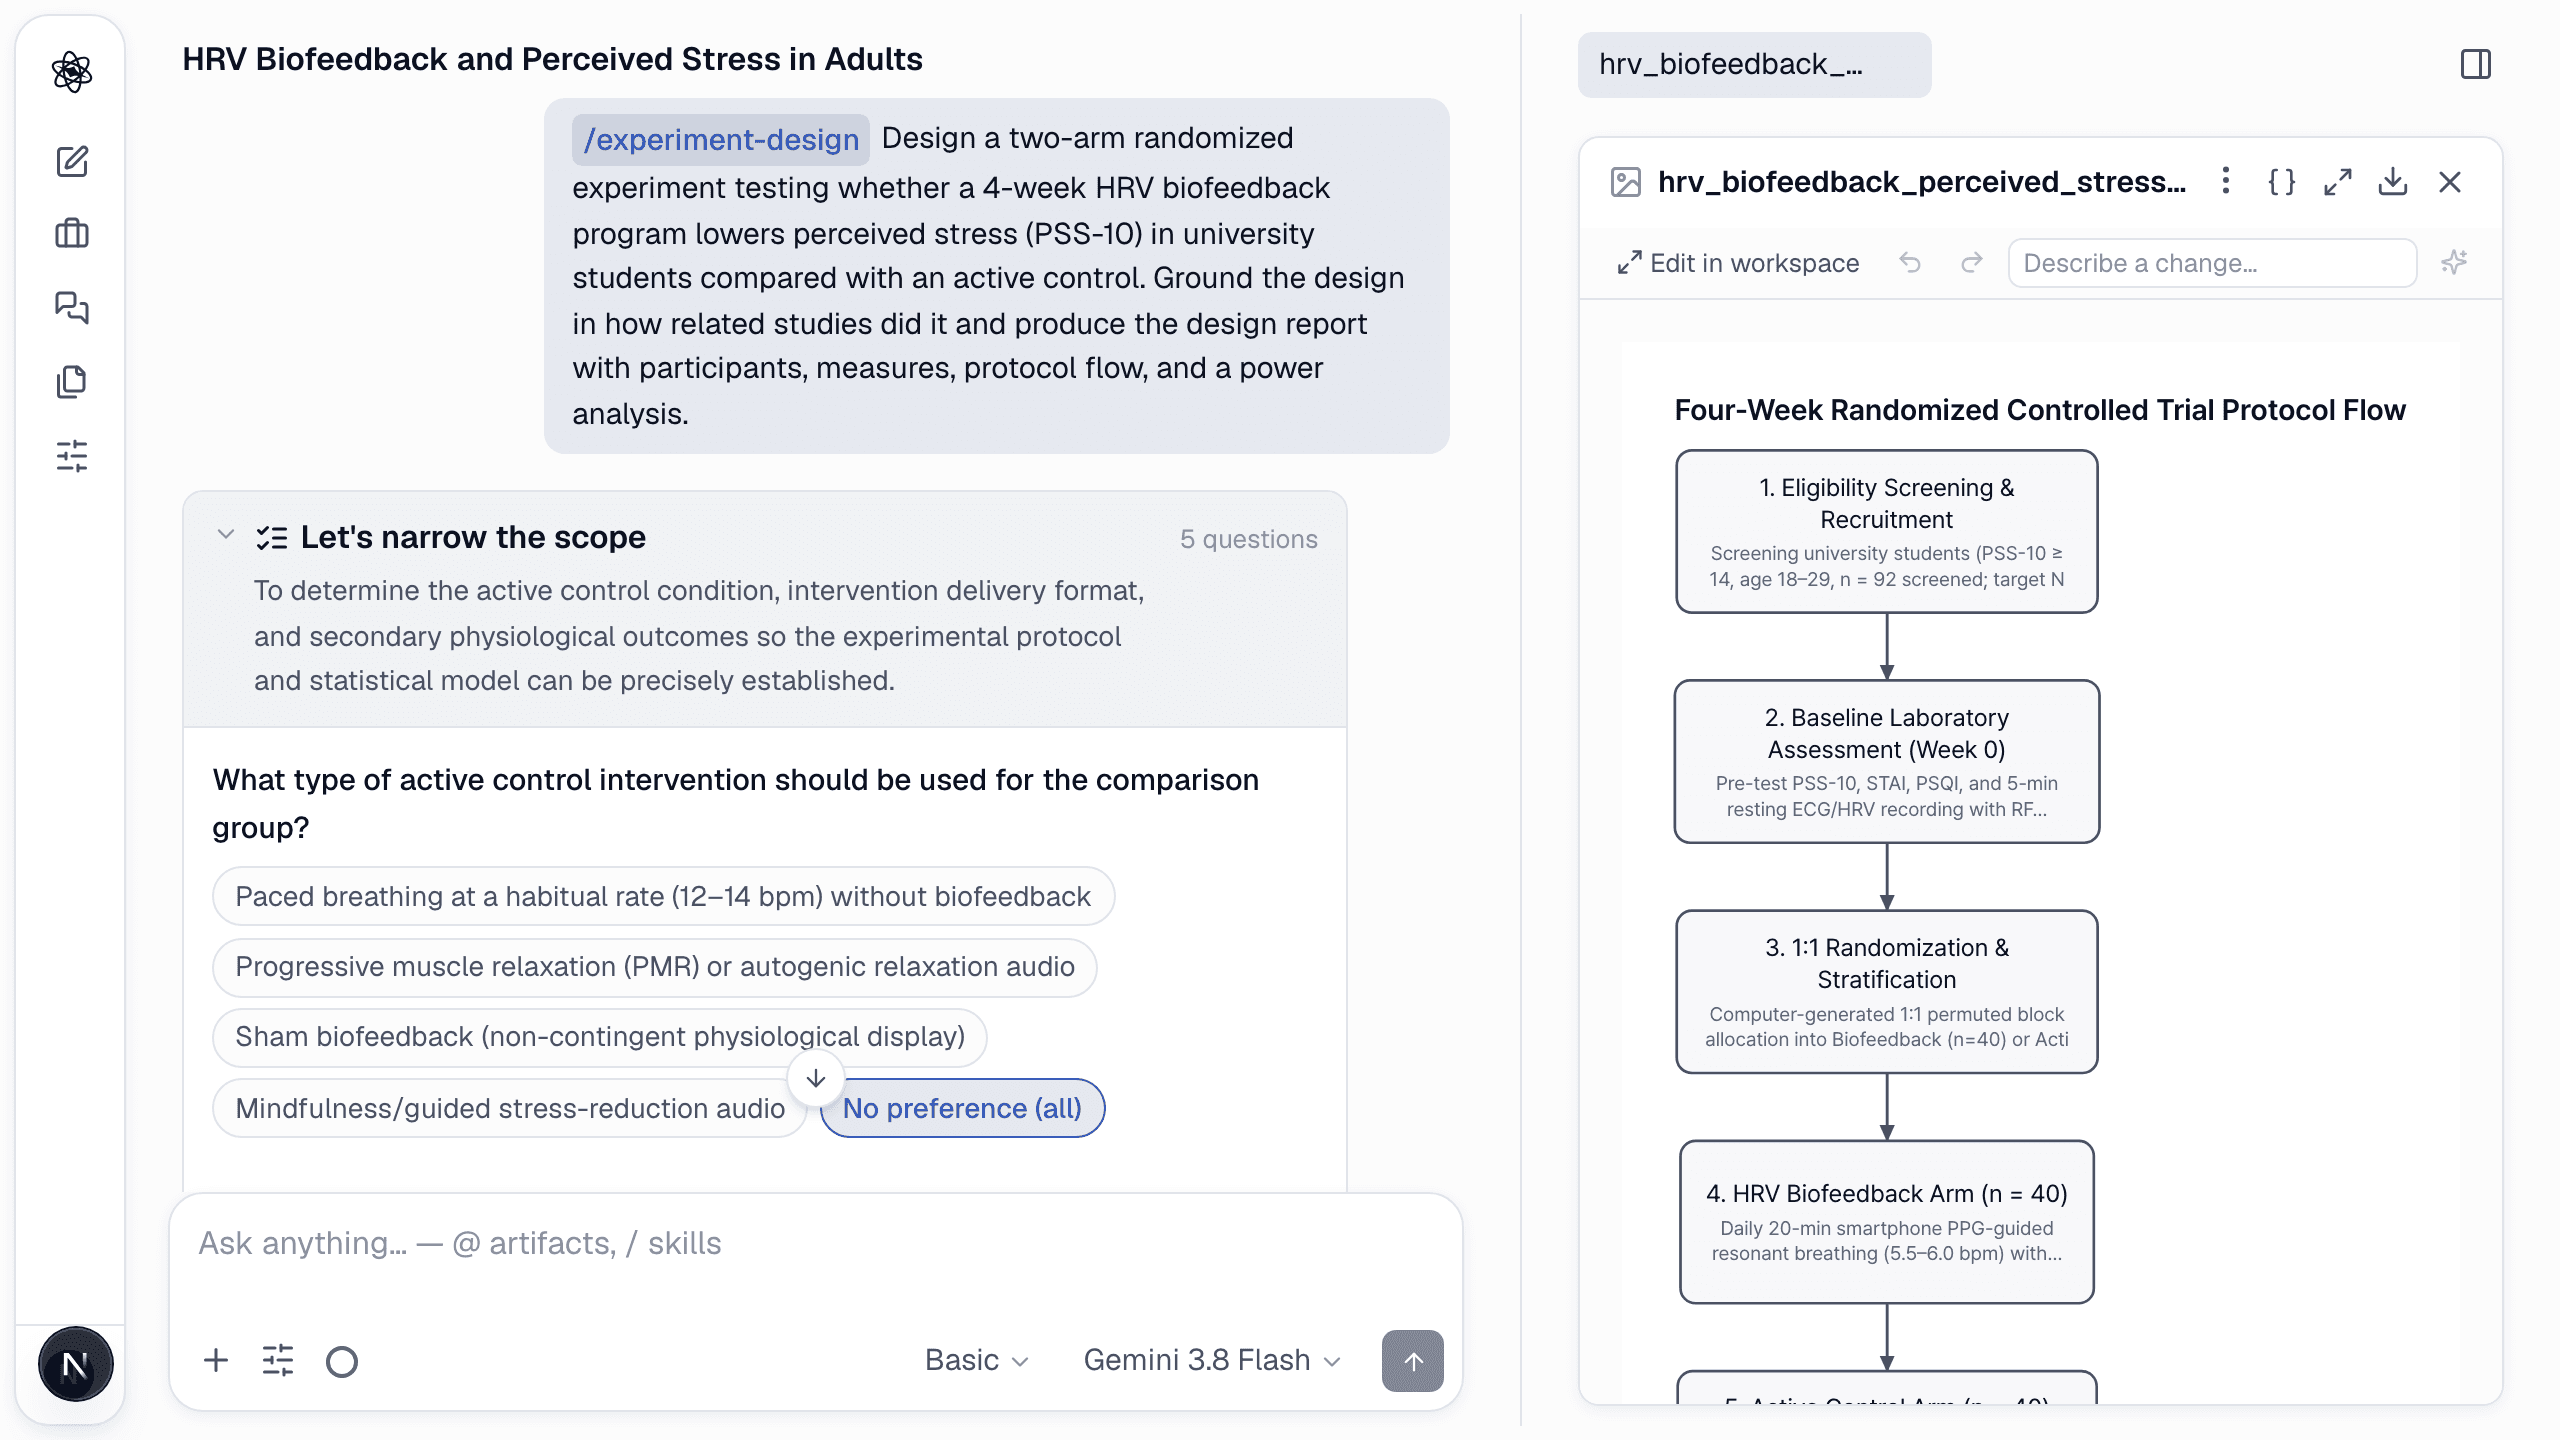
/experiment-design Design a two-arm randomized experiment testing whether a 4-week HRV biofeedback program lowers perceived stress (PSS-10) in university students compared with an active control. Include participants, measures, protocol flow, and a power analysis.
Step 2 — What you did not specify is settled from the literature
The agent does not ask anything first. What the request leaves open — the control condition, how sessions are delivered and monitored, secondary measures, screening criteria — it settles from what comparable trials do, and each such choice is recorded in the design basis as an assumption with its source. Anything you care about goes into the request itself.
Step 3 — Grounded in how the field designs
The agent then surveys how comparable trials designed theirs — typical manipulations, standard instruments, common sample sizes and their observed effects — and writes the design report from that practice, with the reference study cited next to each choice. Deviating is fine; it's on the record.
Step 4 — A design document, not a chat transcript
The output is a structured document your collaborators, IRB, and future self can read:
- Protocol flow — screening, baseline, 1:1 randomization, the two arms, post-test and follow-up — as an editable diagram.
- Measures — each instrument named, with what it operationalizes and where it was validated.
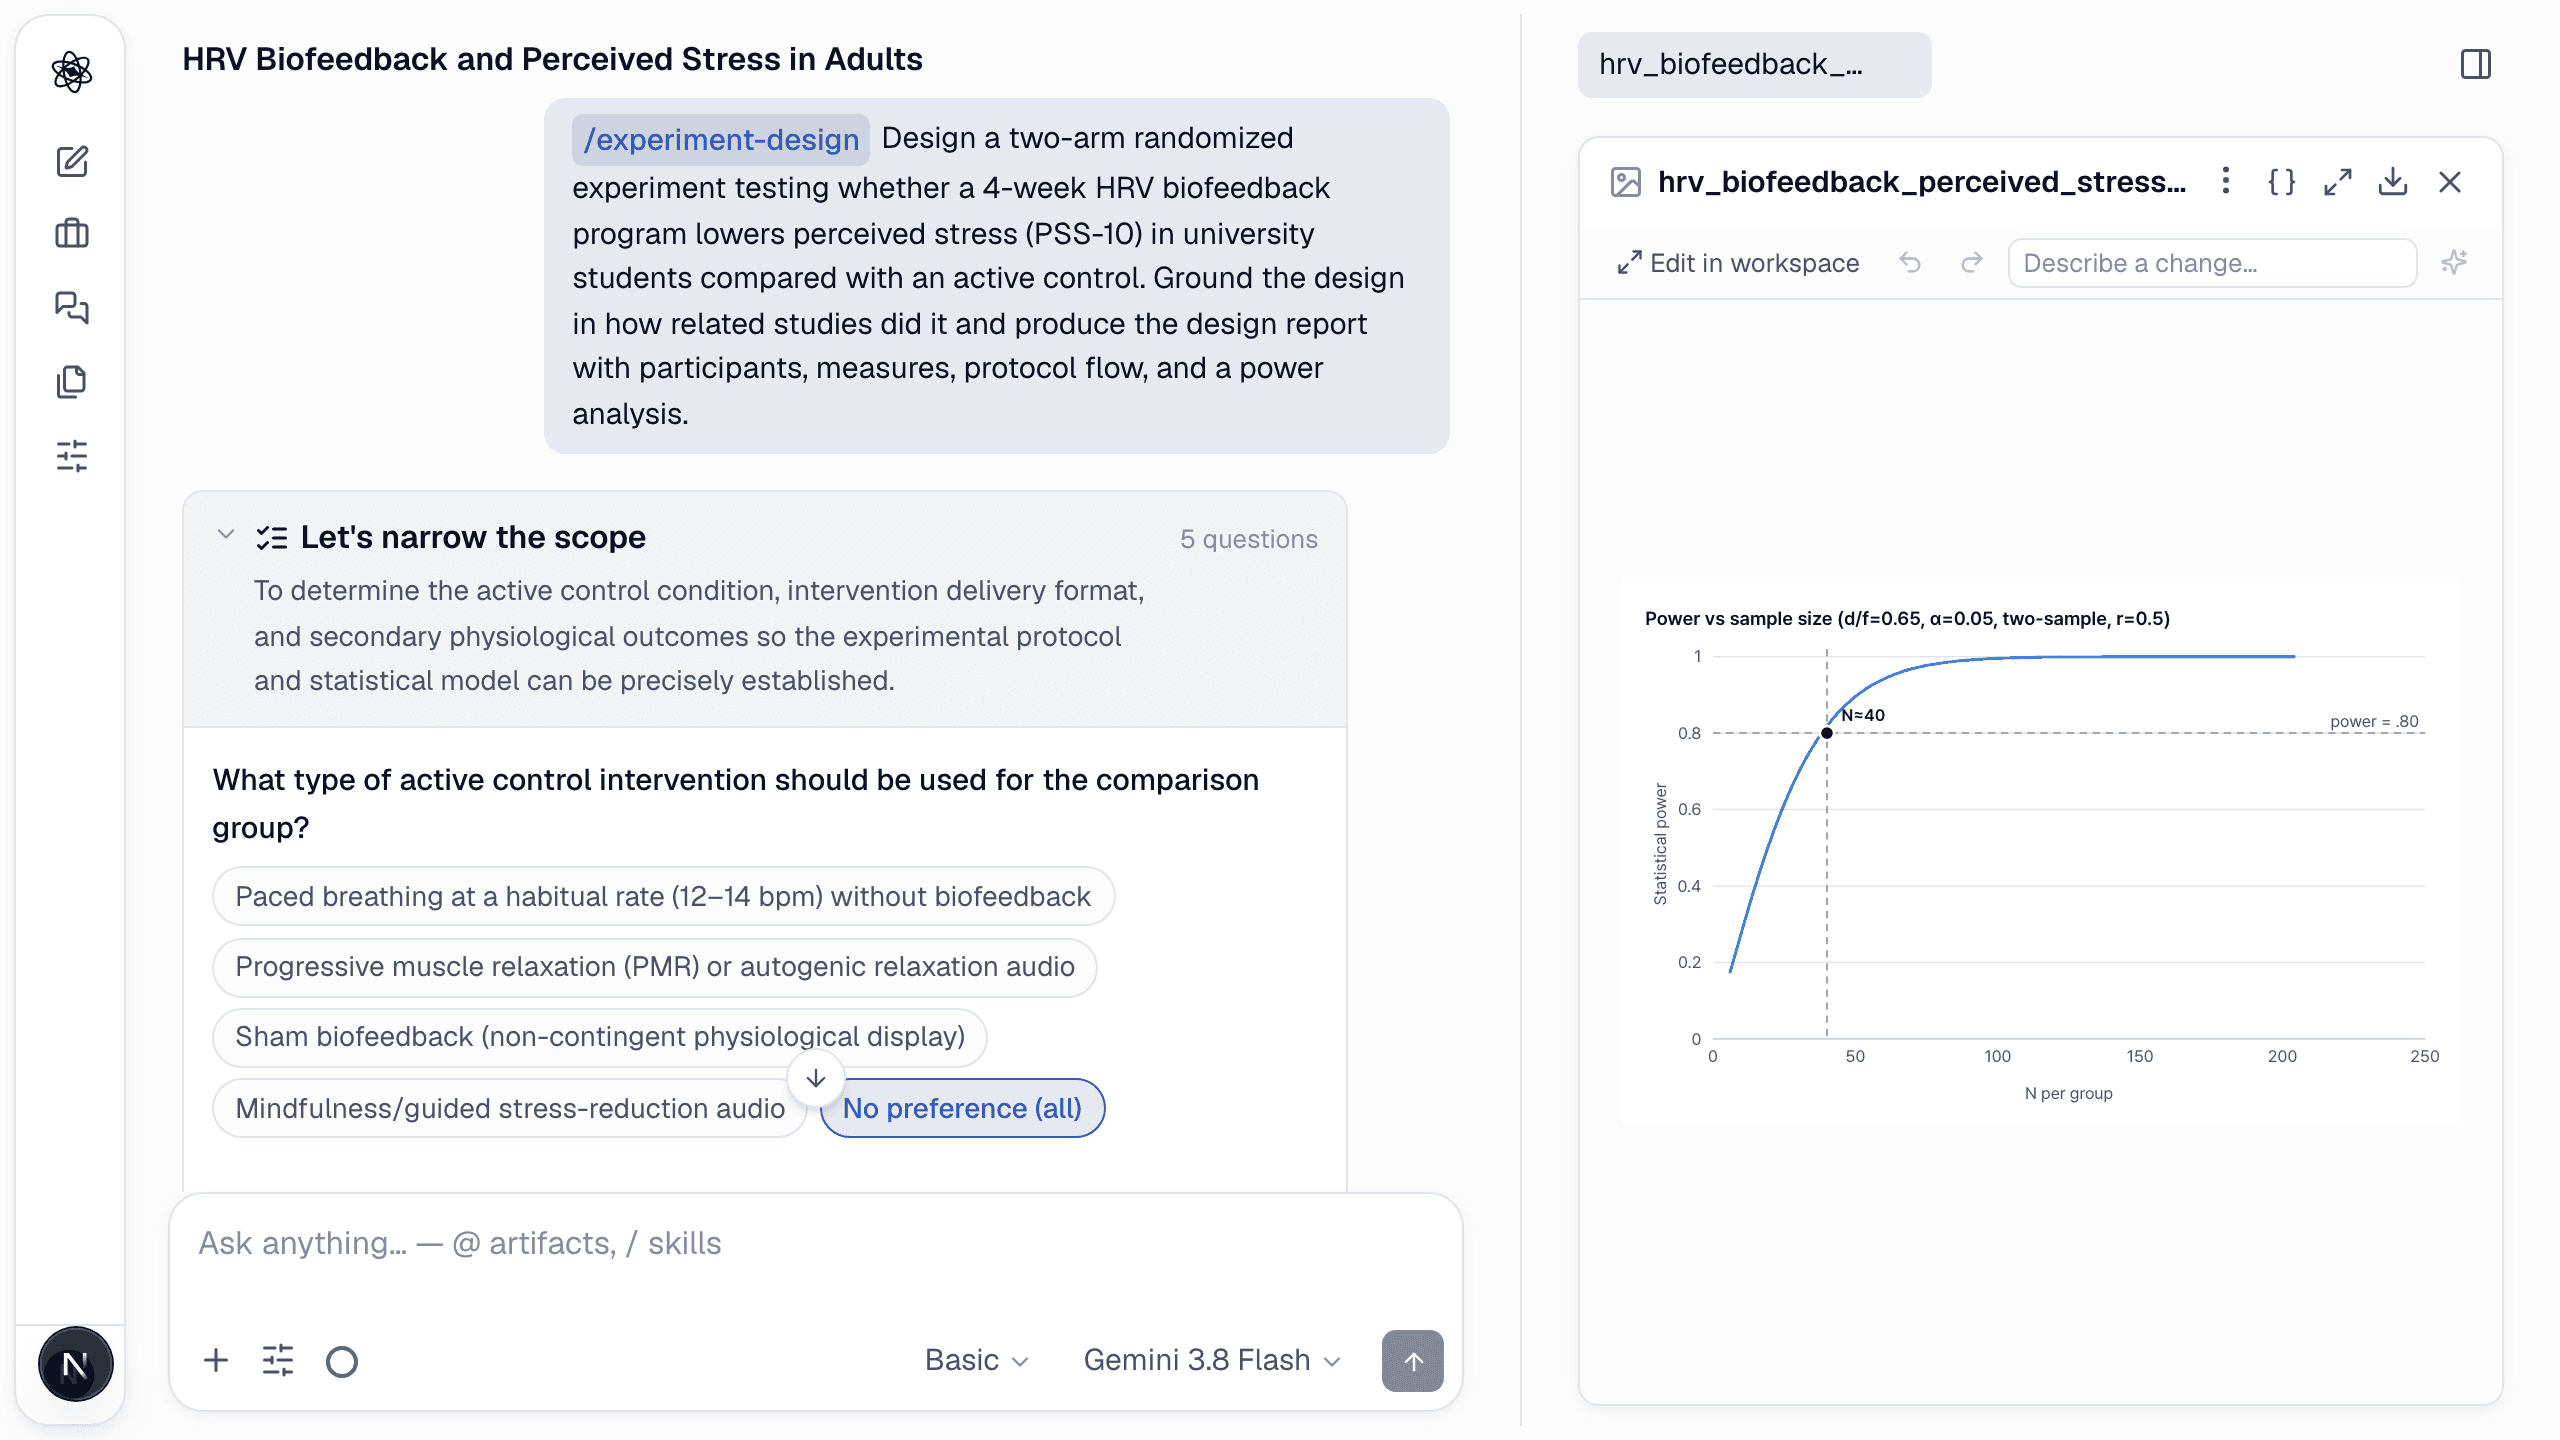
- Participants and sample plan — eligibility, exclusion rules, and a power curve for the planned effect size.
- Constraints and the rationale behind every design choice.
Step 5 — Check the power curve
Sample size is a curve, not a number. In this run the curve shows that n = 64 per group reaches 80% power for d = 0.5 — and how quickly that drops if the true effect is smaller. Hand the document to your IRB or to Qualtrics and PsychoPy as is.
A design document that carries its own rationale survives review — and survives the year between writing it and analyzing the data.