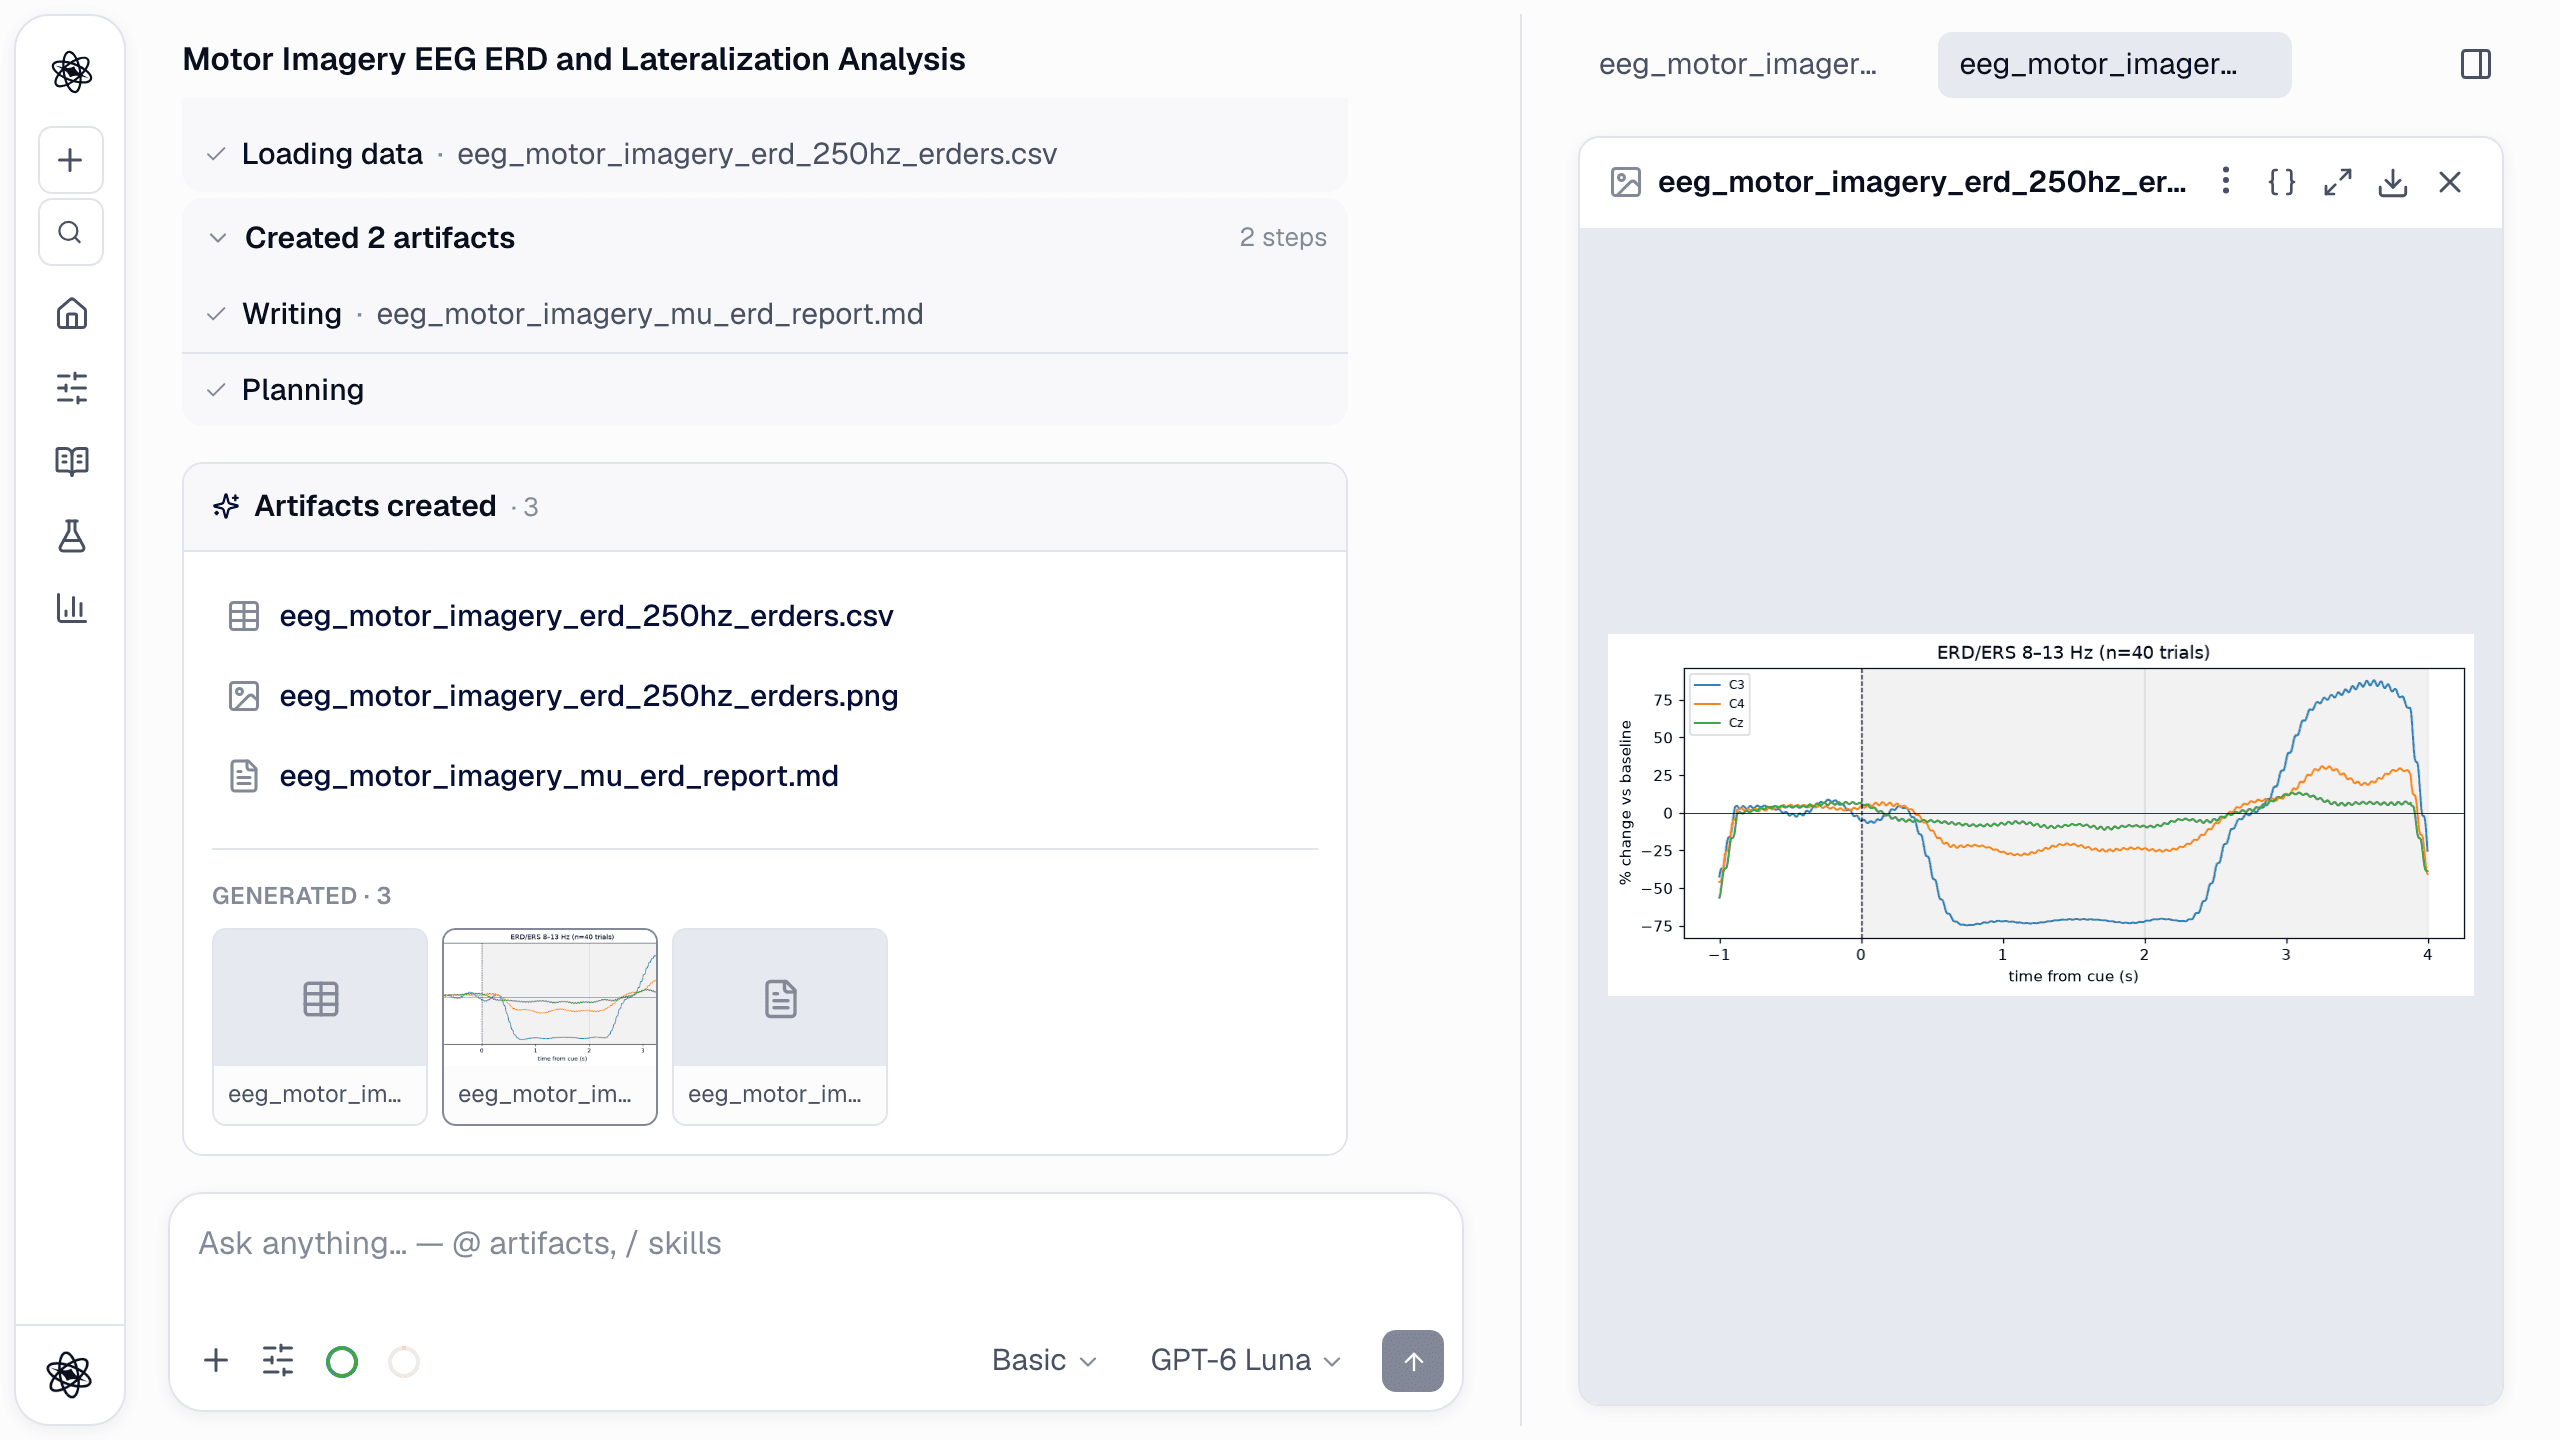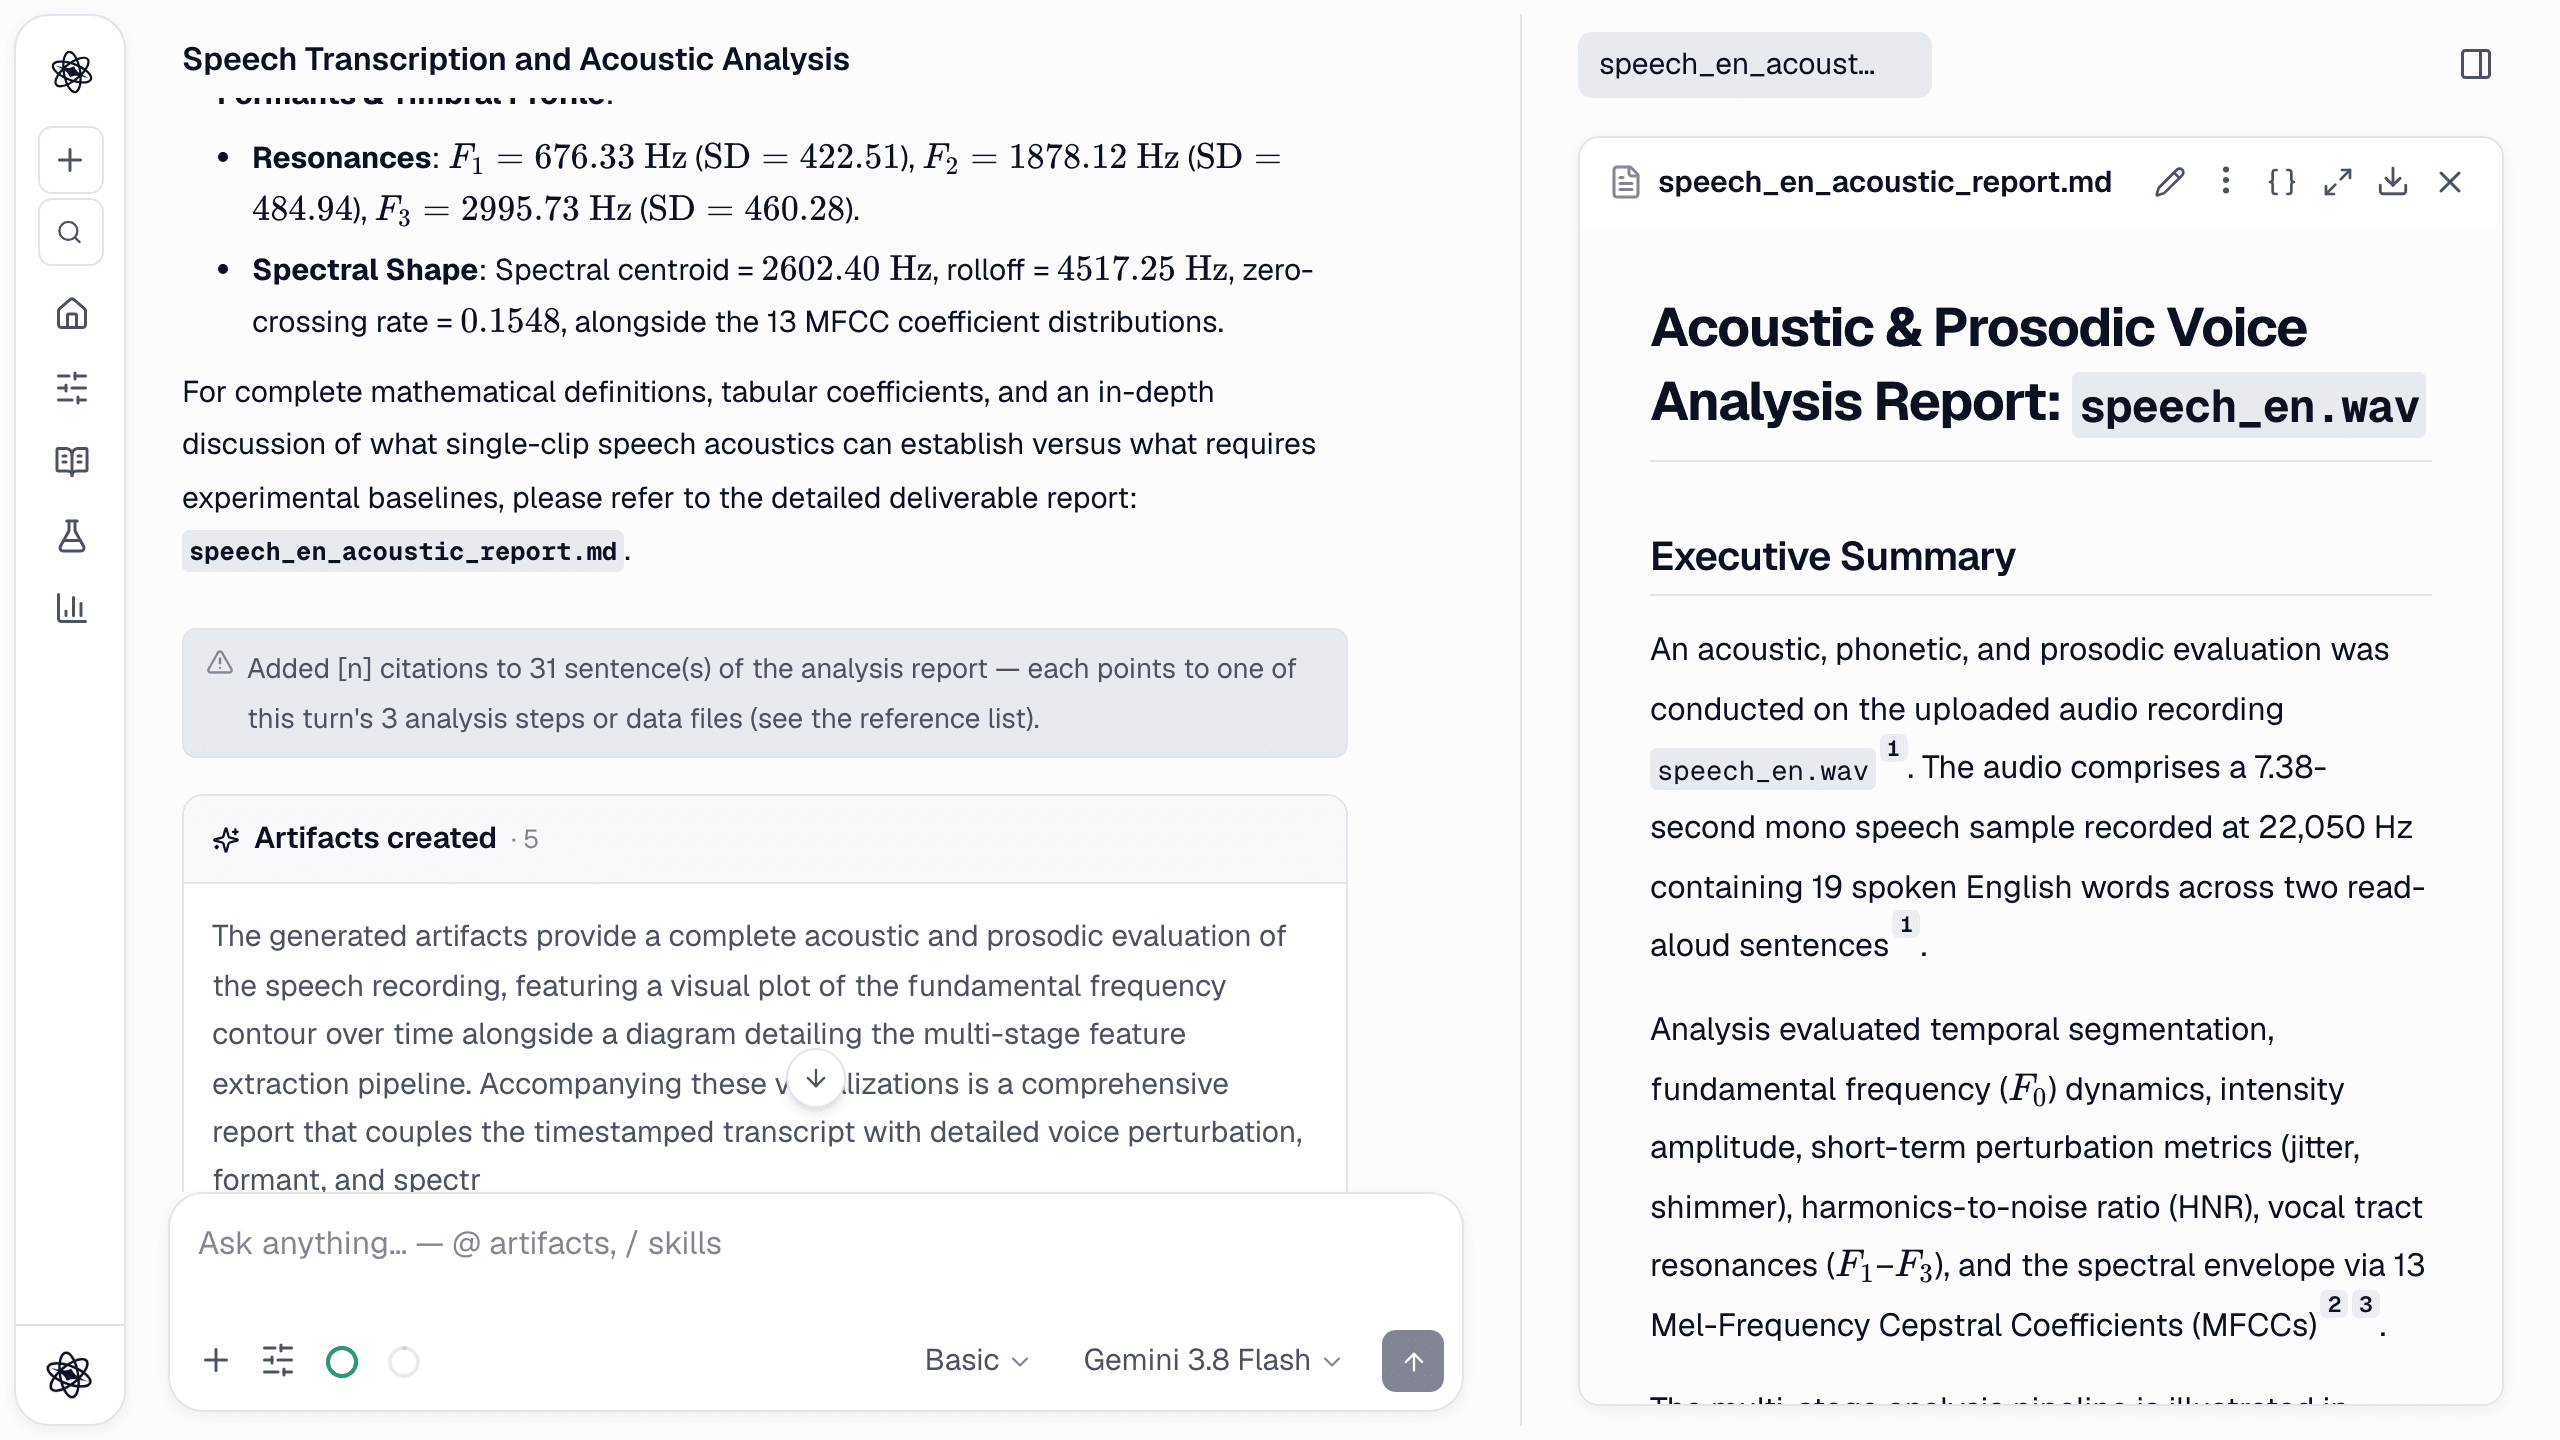
Most analysis errors don't happen in the model. They happen earlier — in a merge that silently dropped rows, an exclusion rule applied inconsistently, a sensor artifact that became a "finding." Neutropic treats data preparation as the part of analysis that most needs daylight. Here is the step in the same session: the trial has been run (on sample data) and the spreadsheet comes in.
Step 1 — Attach the data once
Press + in the composer and attach the file — Excel, CSV, interaction logs, recordings and biosignal exports all work. The file stays in the session, so every later step refers to it by name; no re-uploading, no guessing which of three near-identical CSVs is current.
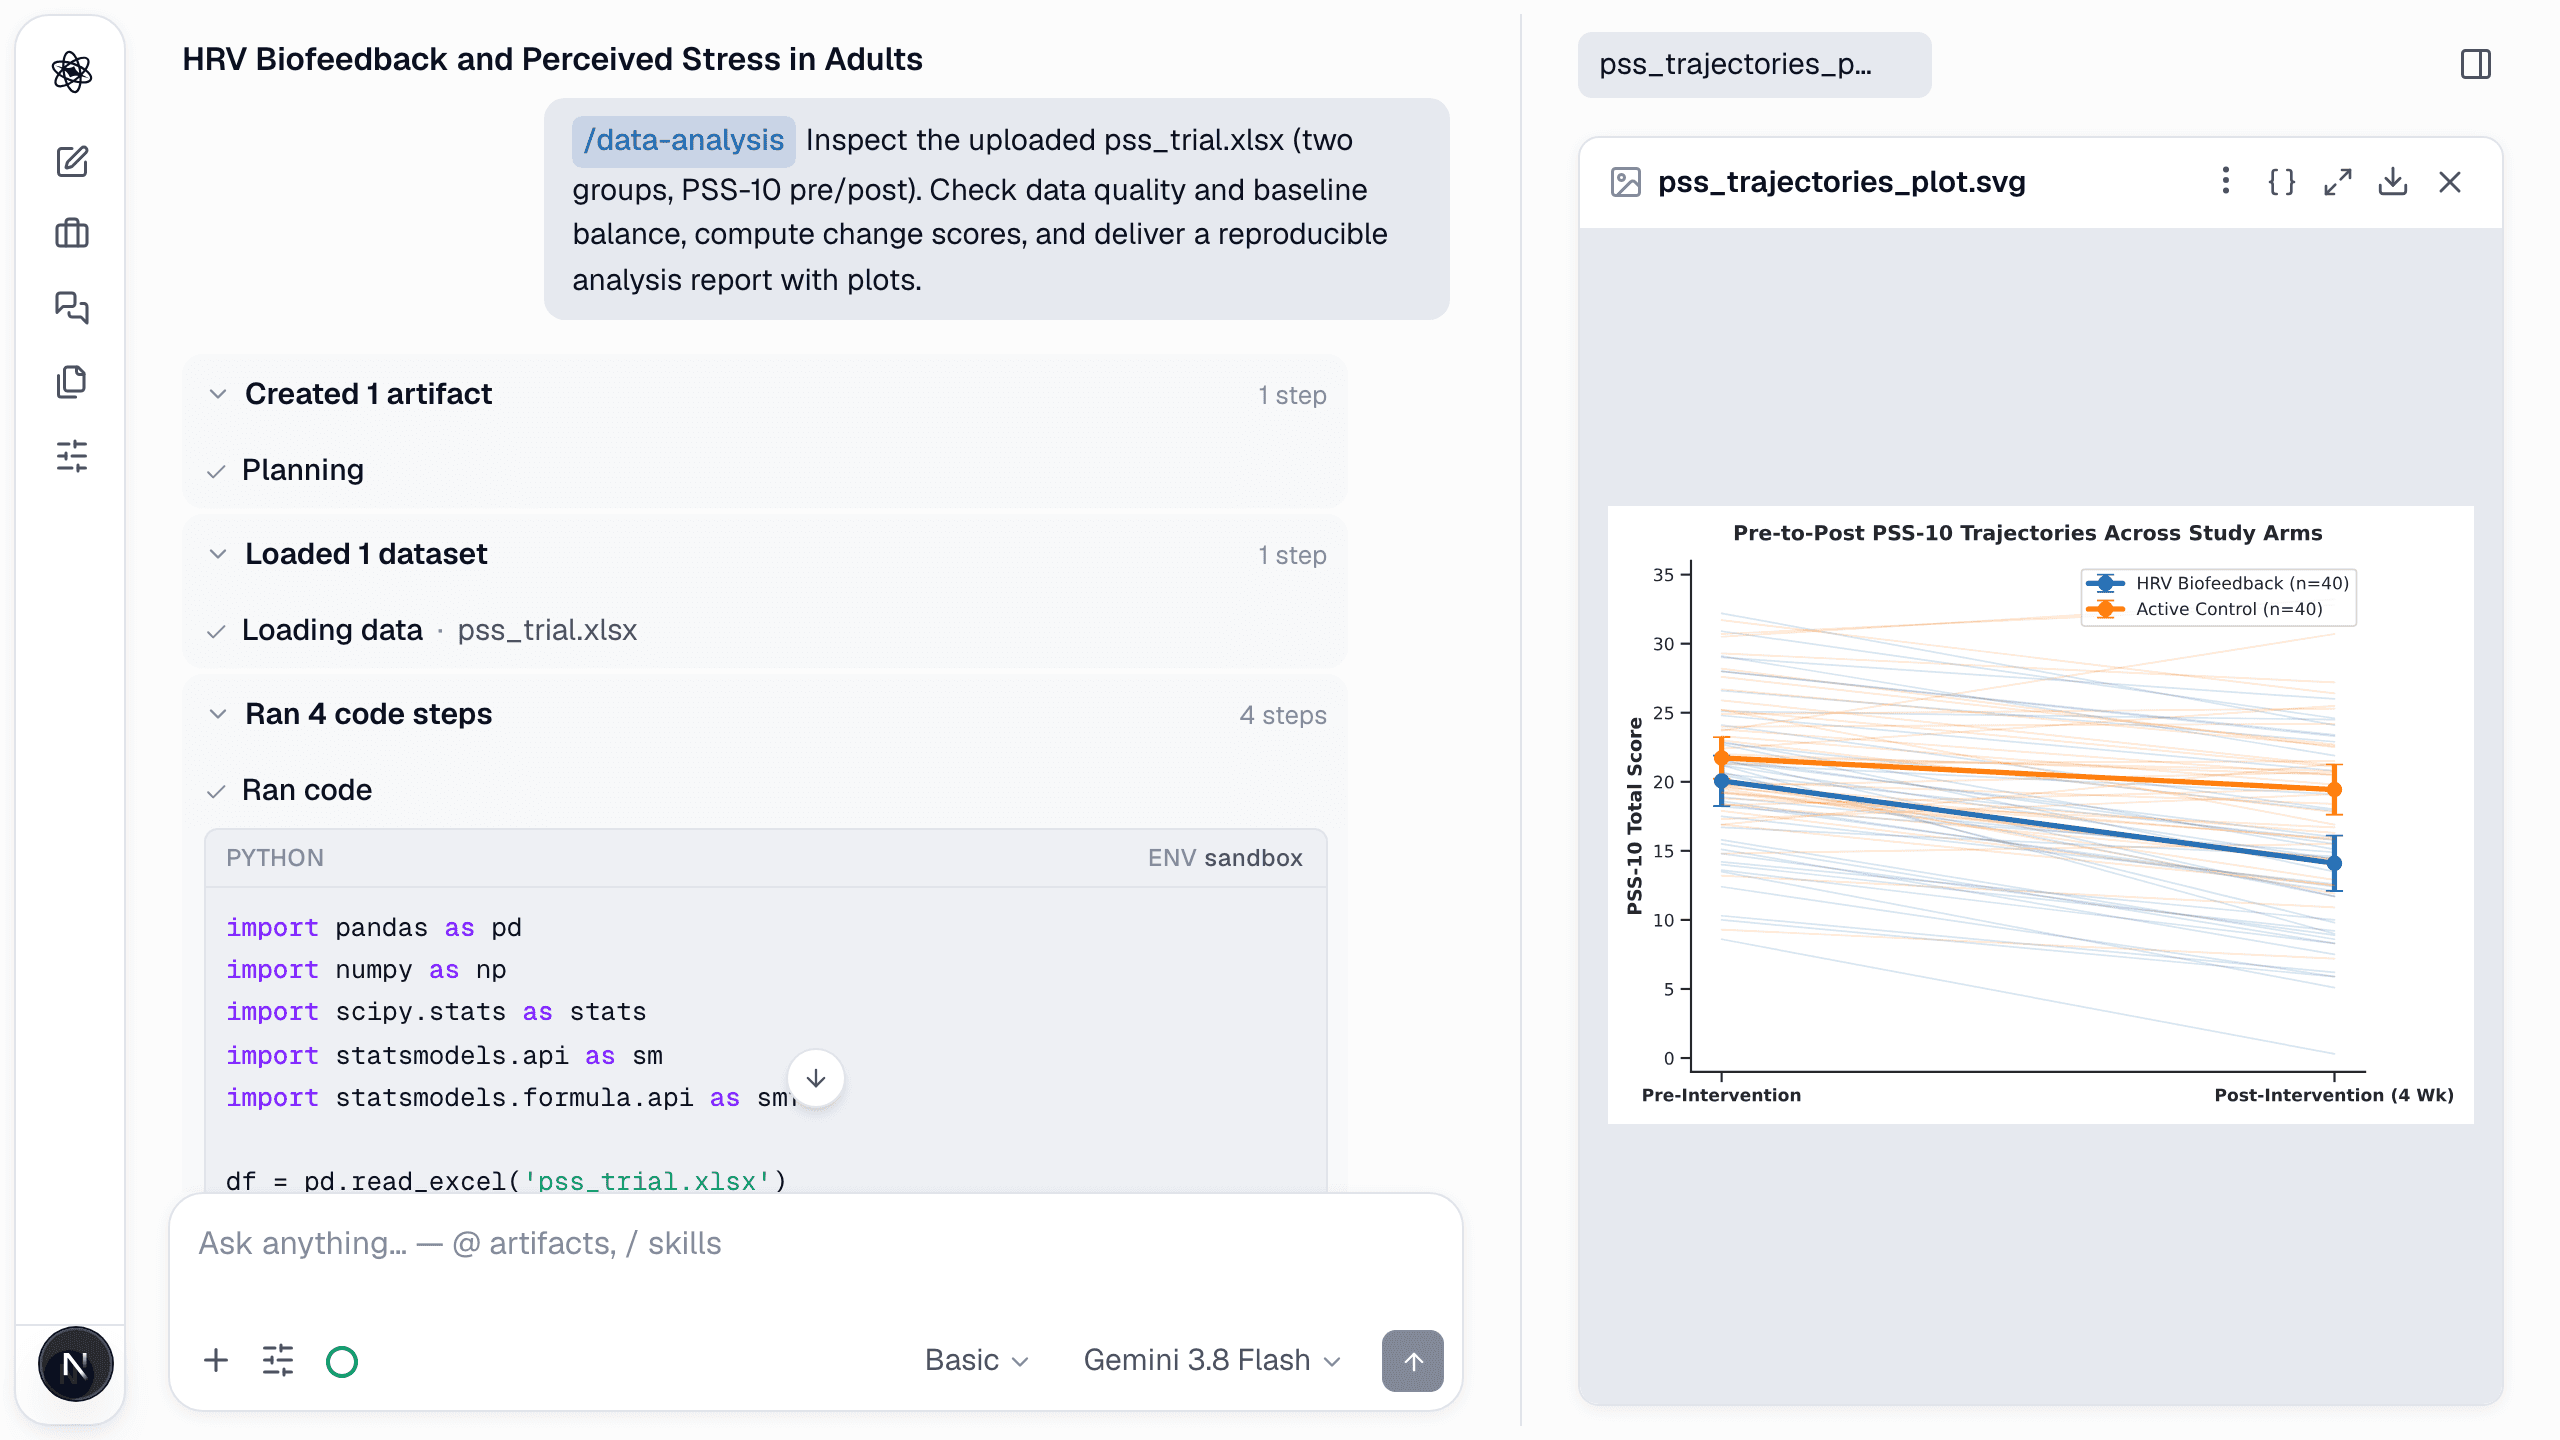
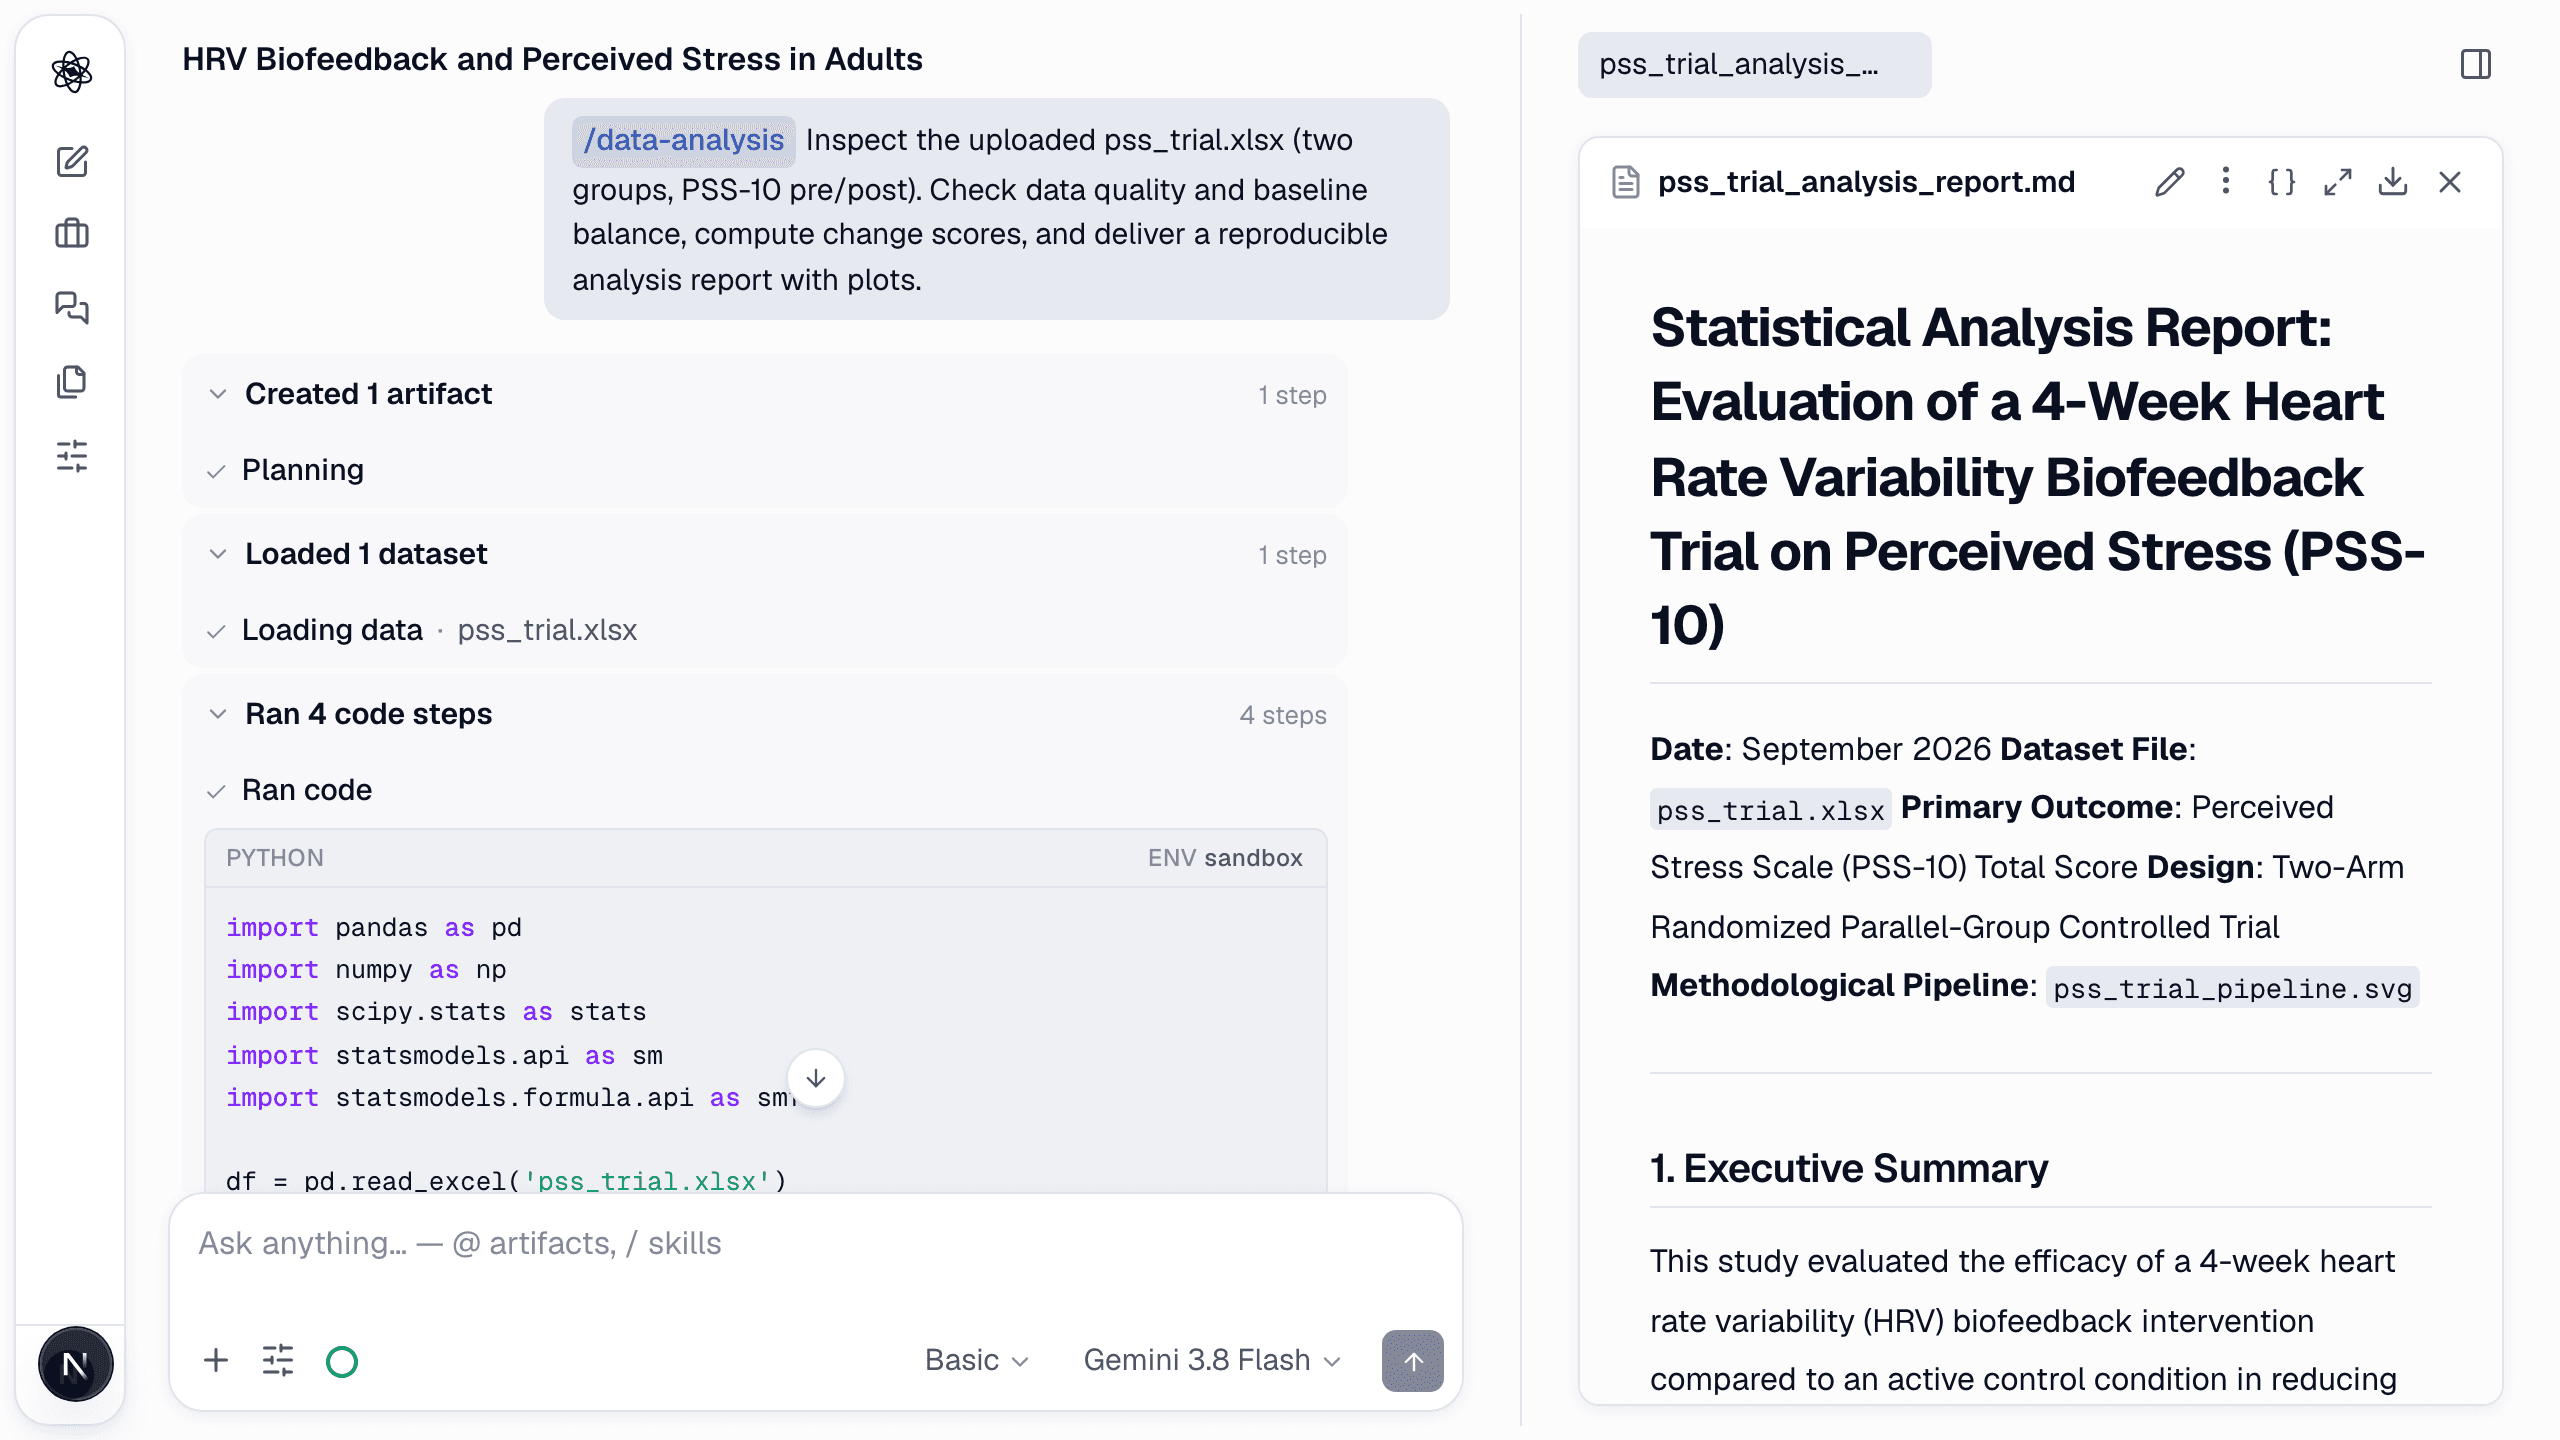
/data-analysis Inspect the uploaded pss_trial.xlsx (two groups, PSS-10 pre/post). Check data quality and baseline balance, compute change scores, and deliver a reproducible analysis report with plots.
Step 2 — Inspect before analyzing
The agent reads the structure first — 80 rows, 5 columns, no missing values, PSS-10 scores within range, baseline balance between groups — and writes an explicit analysis plan. Only then does it run the plan, in a sandbox, with each code step visible and expandable in the chat.
- Missing data is reported per variable and per participant before any imputation or exclusion.
- Exclusion rules are stated as rules, applied uniformly, and counted.
- Multimodal inputs — facial expression, gaze, pose, voice, rPPG/HRV, EDA, EEG — get the same treatment on a shared timeline.
Step 3 — Look at the data, not just the summary
Six artifacts come out of one message: a data-quality report, individual pre-to-post trajectories, change-score distributions, an ANCOVA fit, a pipeline diagram of what was done to the data, and a structured JSON of the results.
Step 4 — Read the report that names its inputs
The analysis report names the dataset, the design and the methodological pipeline before any number is reported — so a reviewer can follow the path from file to figure.
Step 5 — Reproducible by construction
Every artifact records the code and the data snapshot that produced it. Change an exclusion rule and re-run, and every downstream figure updates from the same pipeline — the cleaning log shows exactly what changed.
Preparation is where studies are won or lost. Give it the same rigor as the model, and the model gets easier.