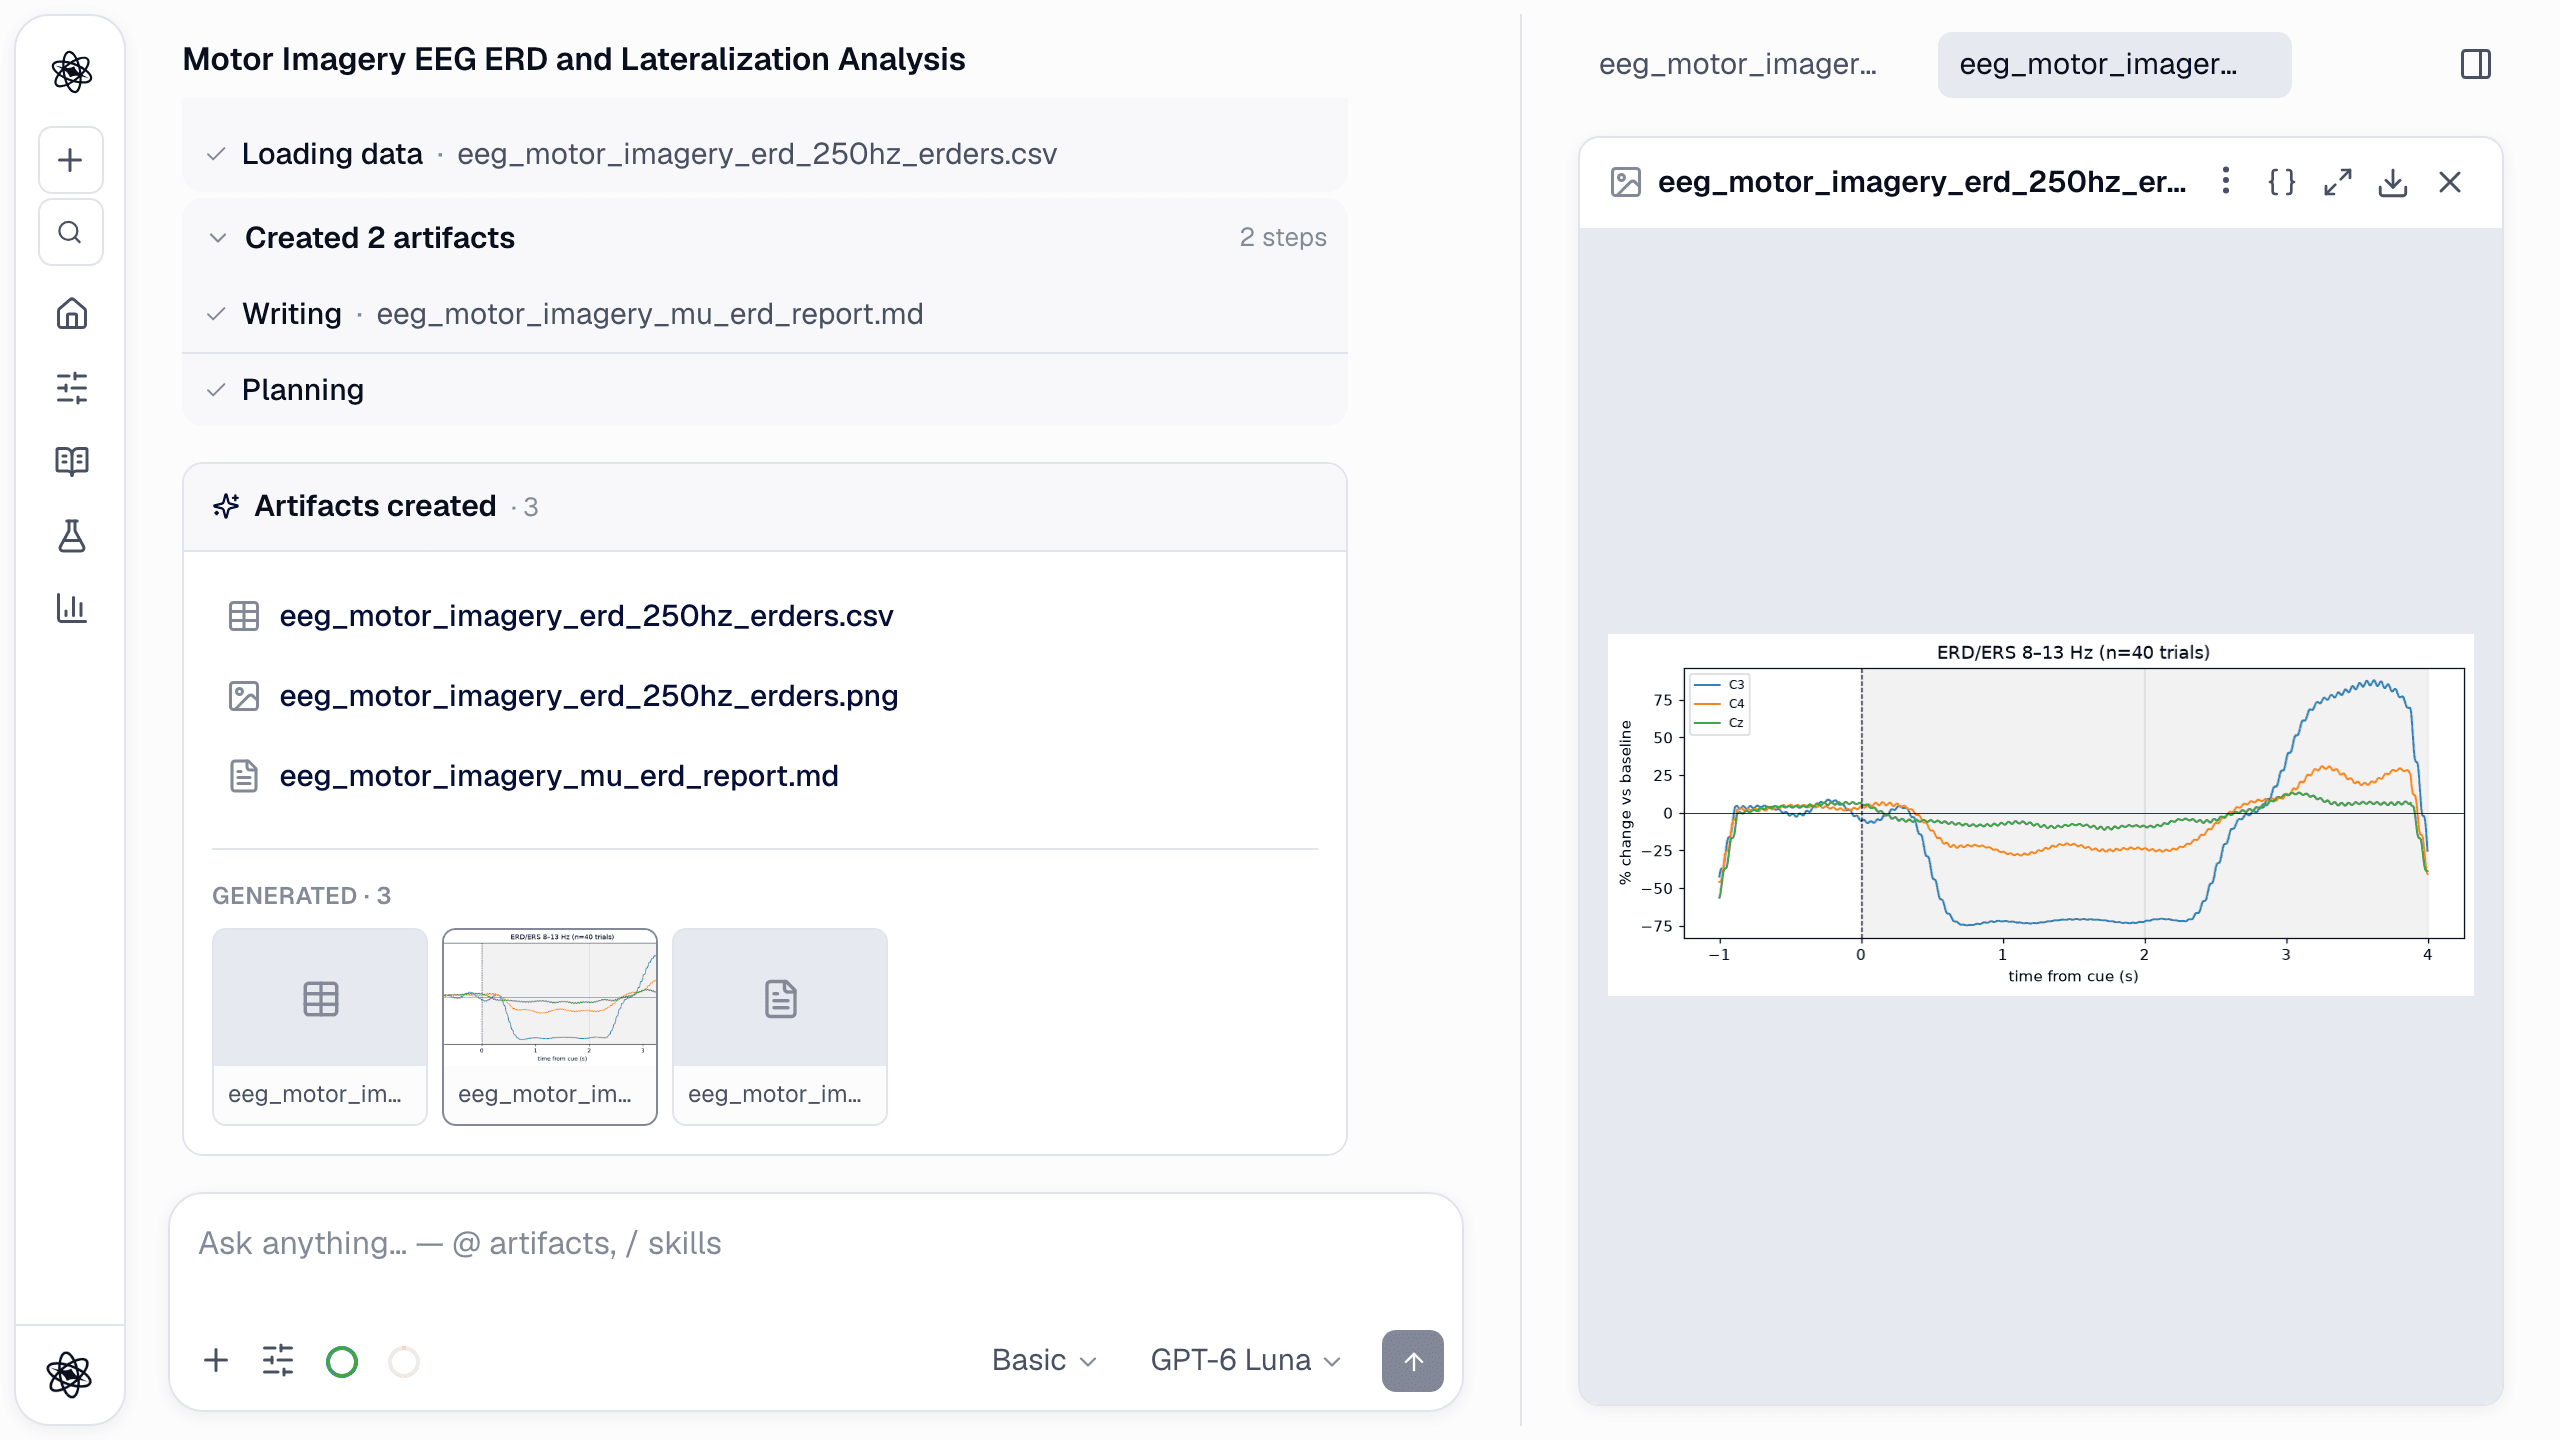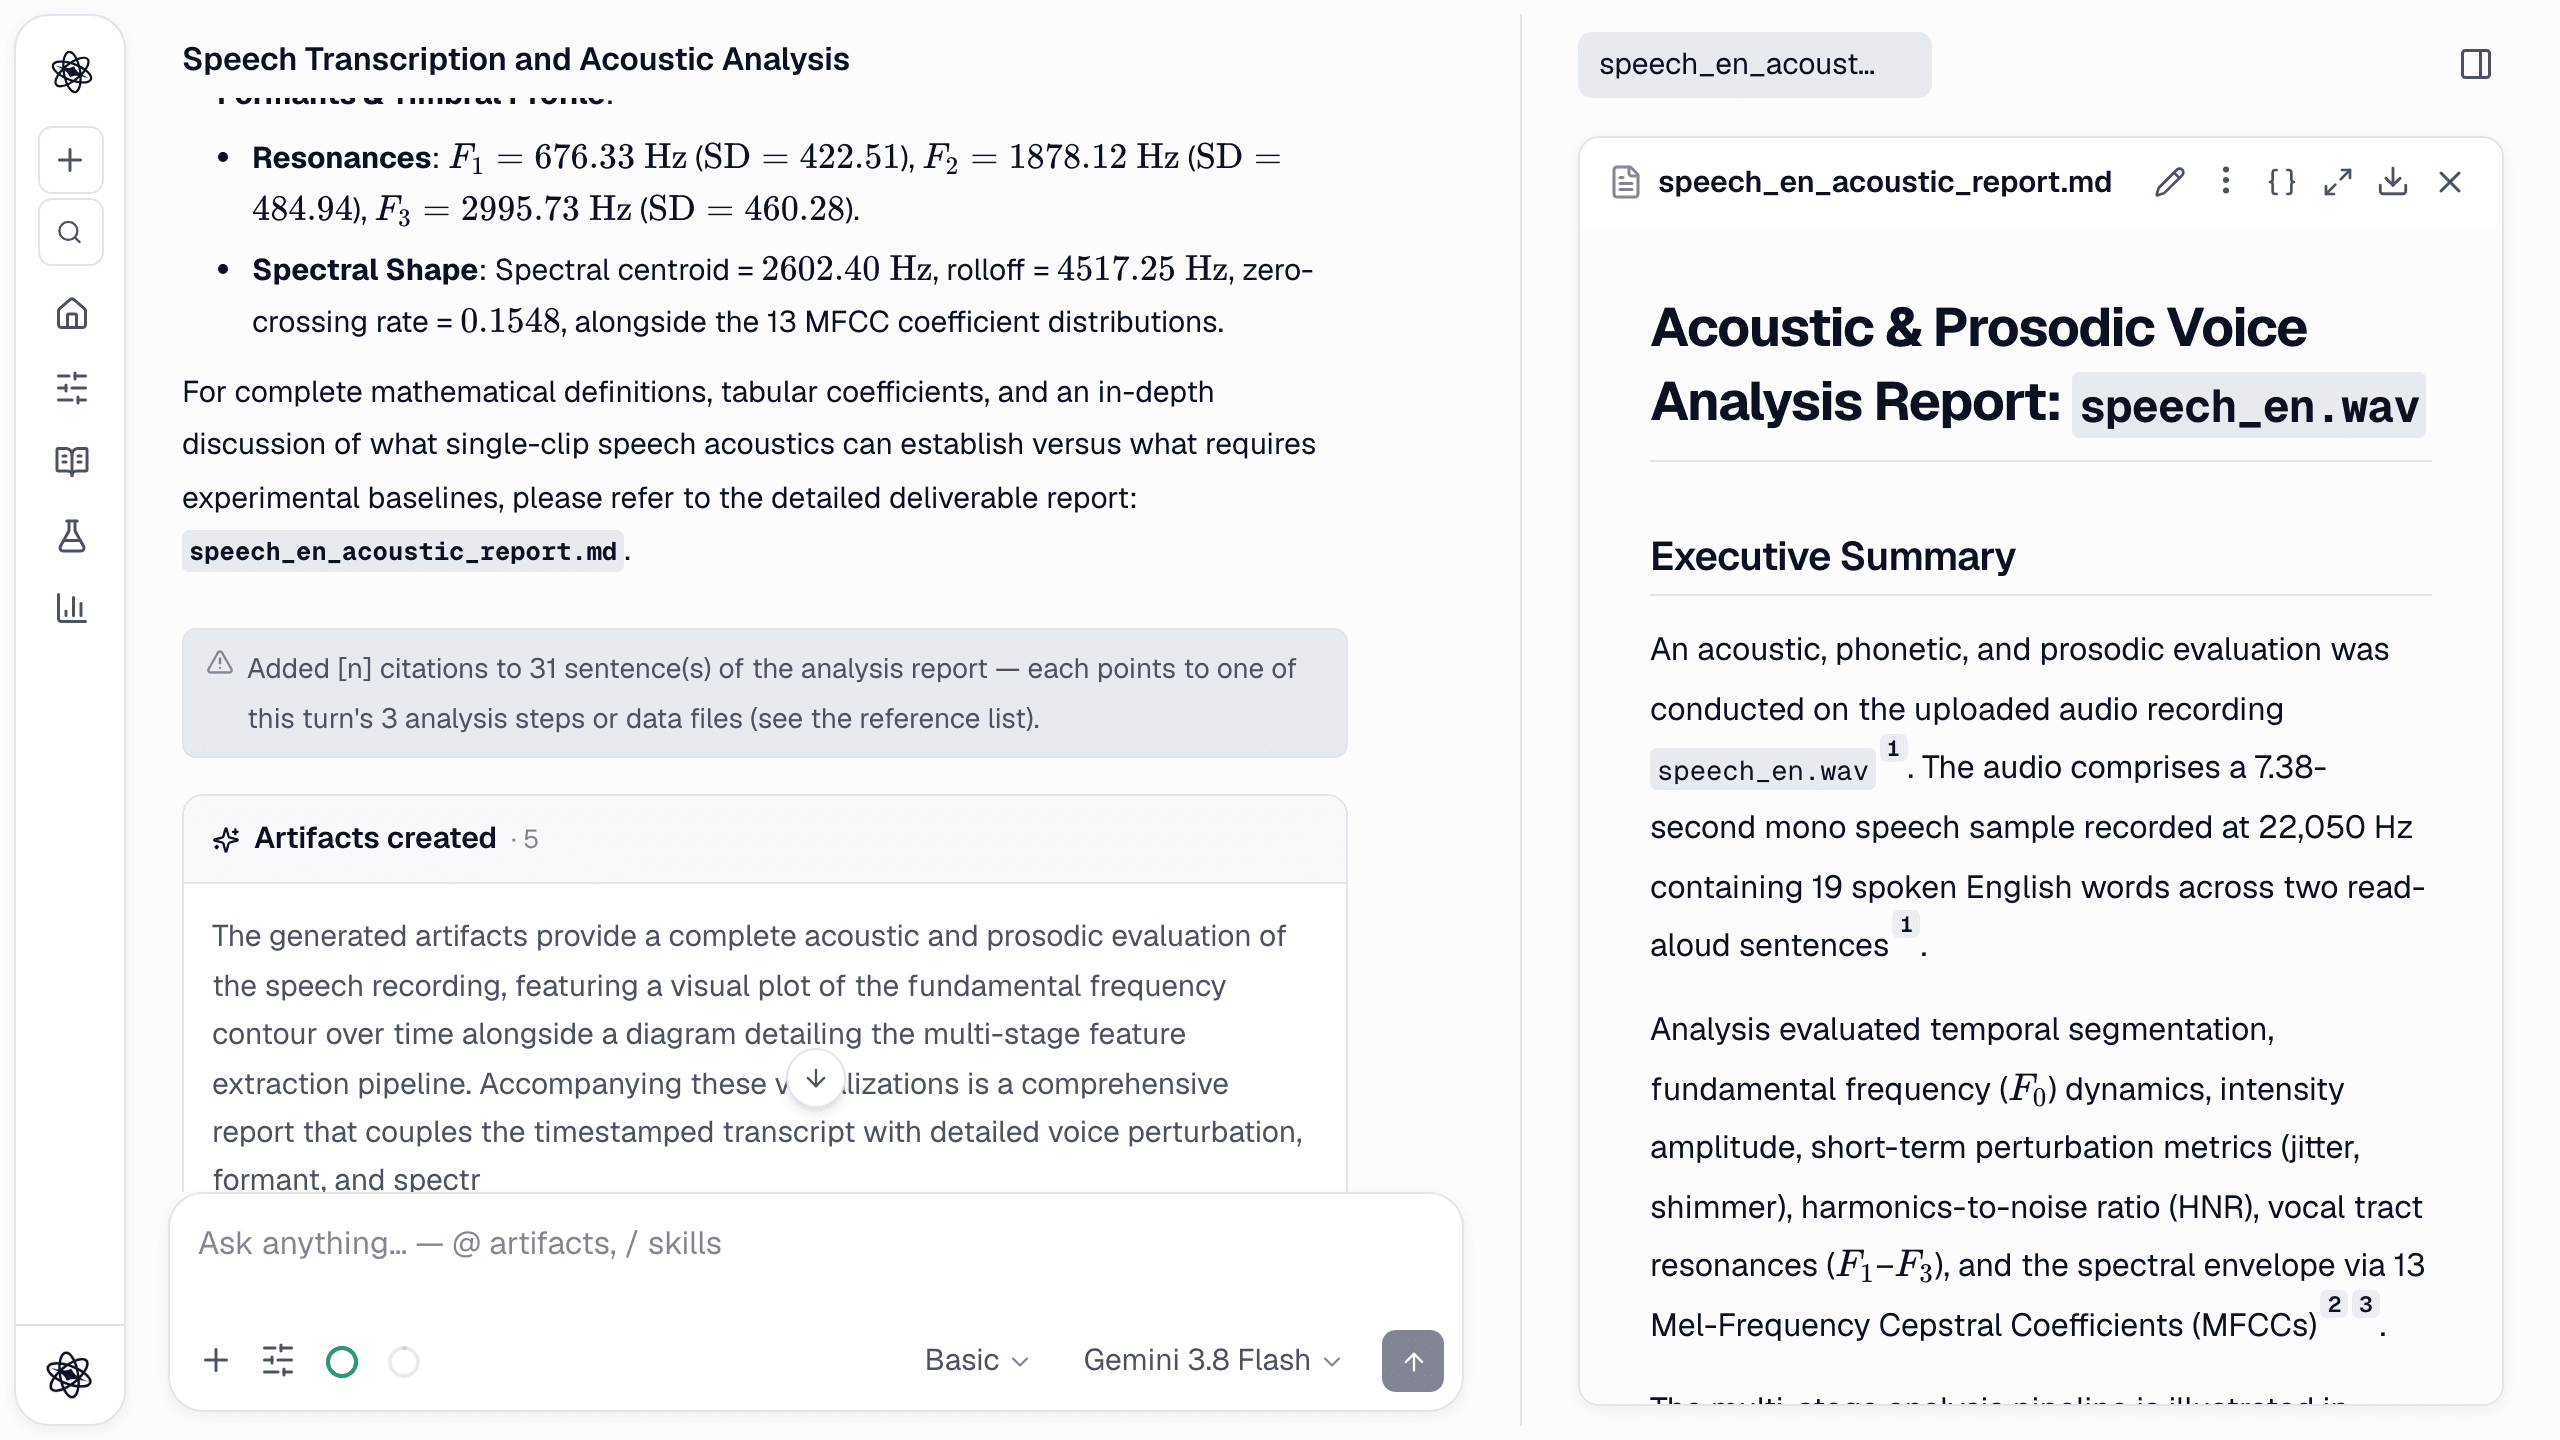
Statistical software will run almost anything you ask, whether or not it's the right thing to ask. Neutropic's job is different: to run the right model for your design and your data, and to prove it was right — twice. Here is the step in the same session, with the trial data already loaded.
Step 1 — Ask the question, not for a test
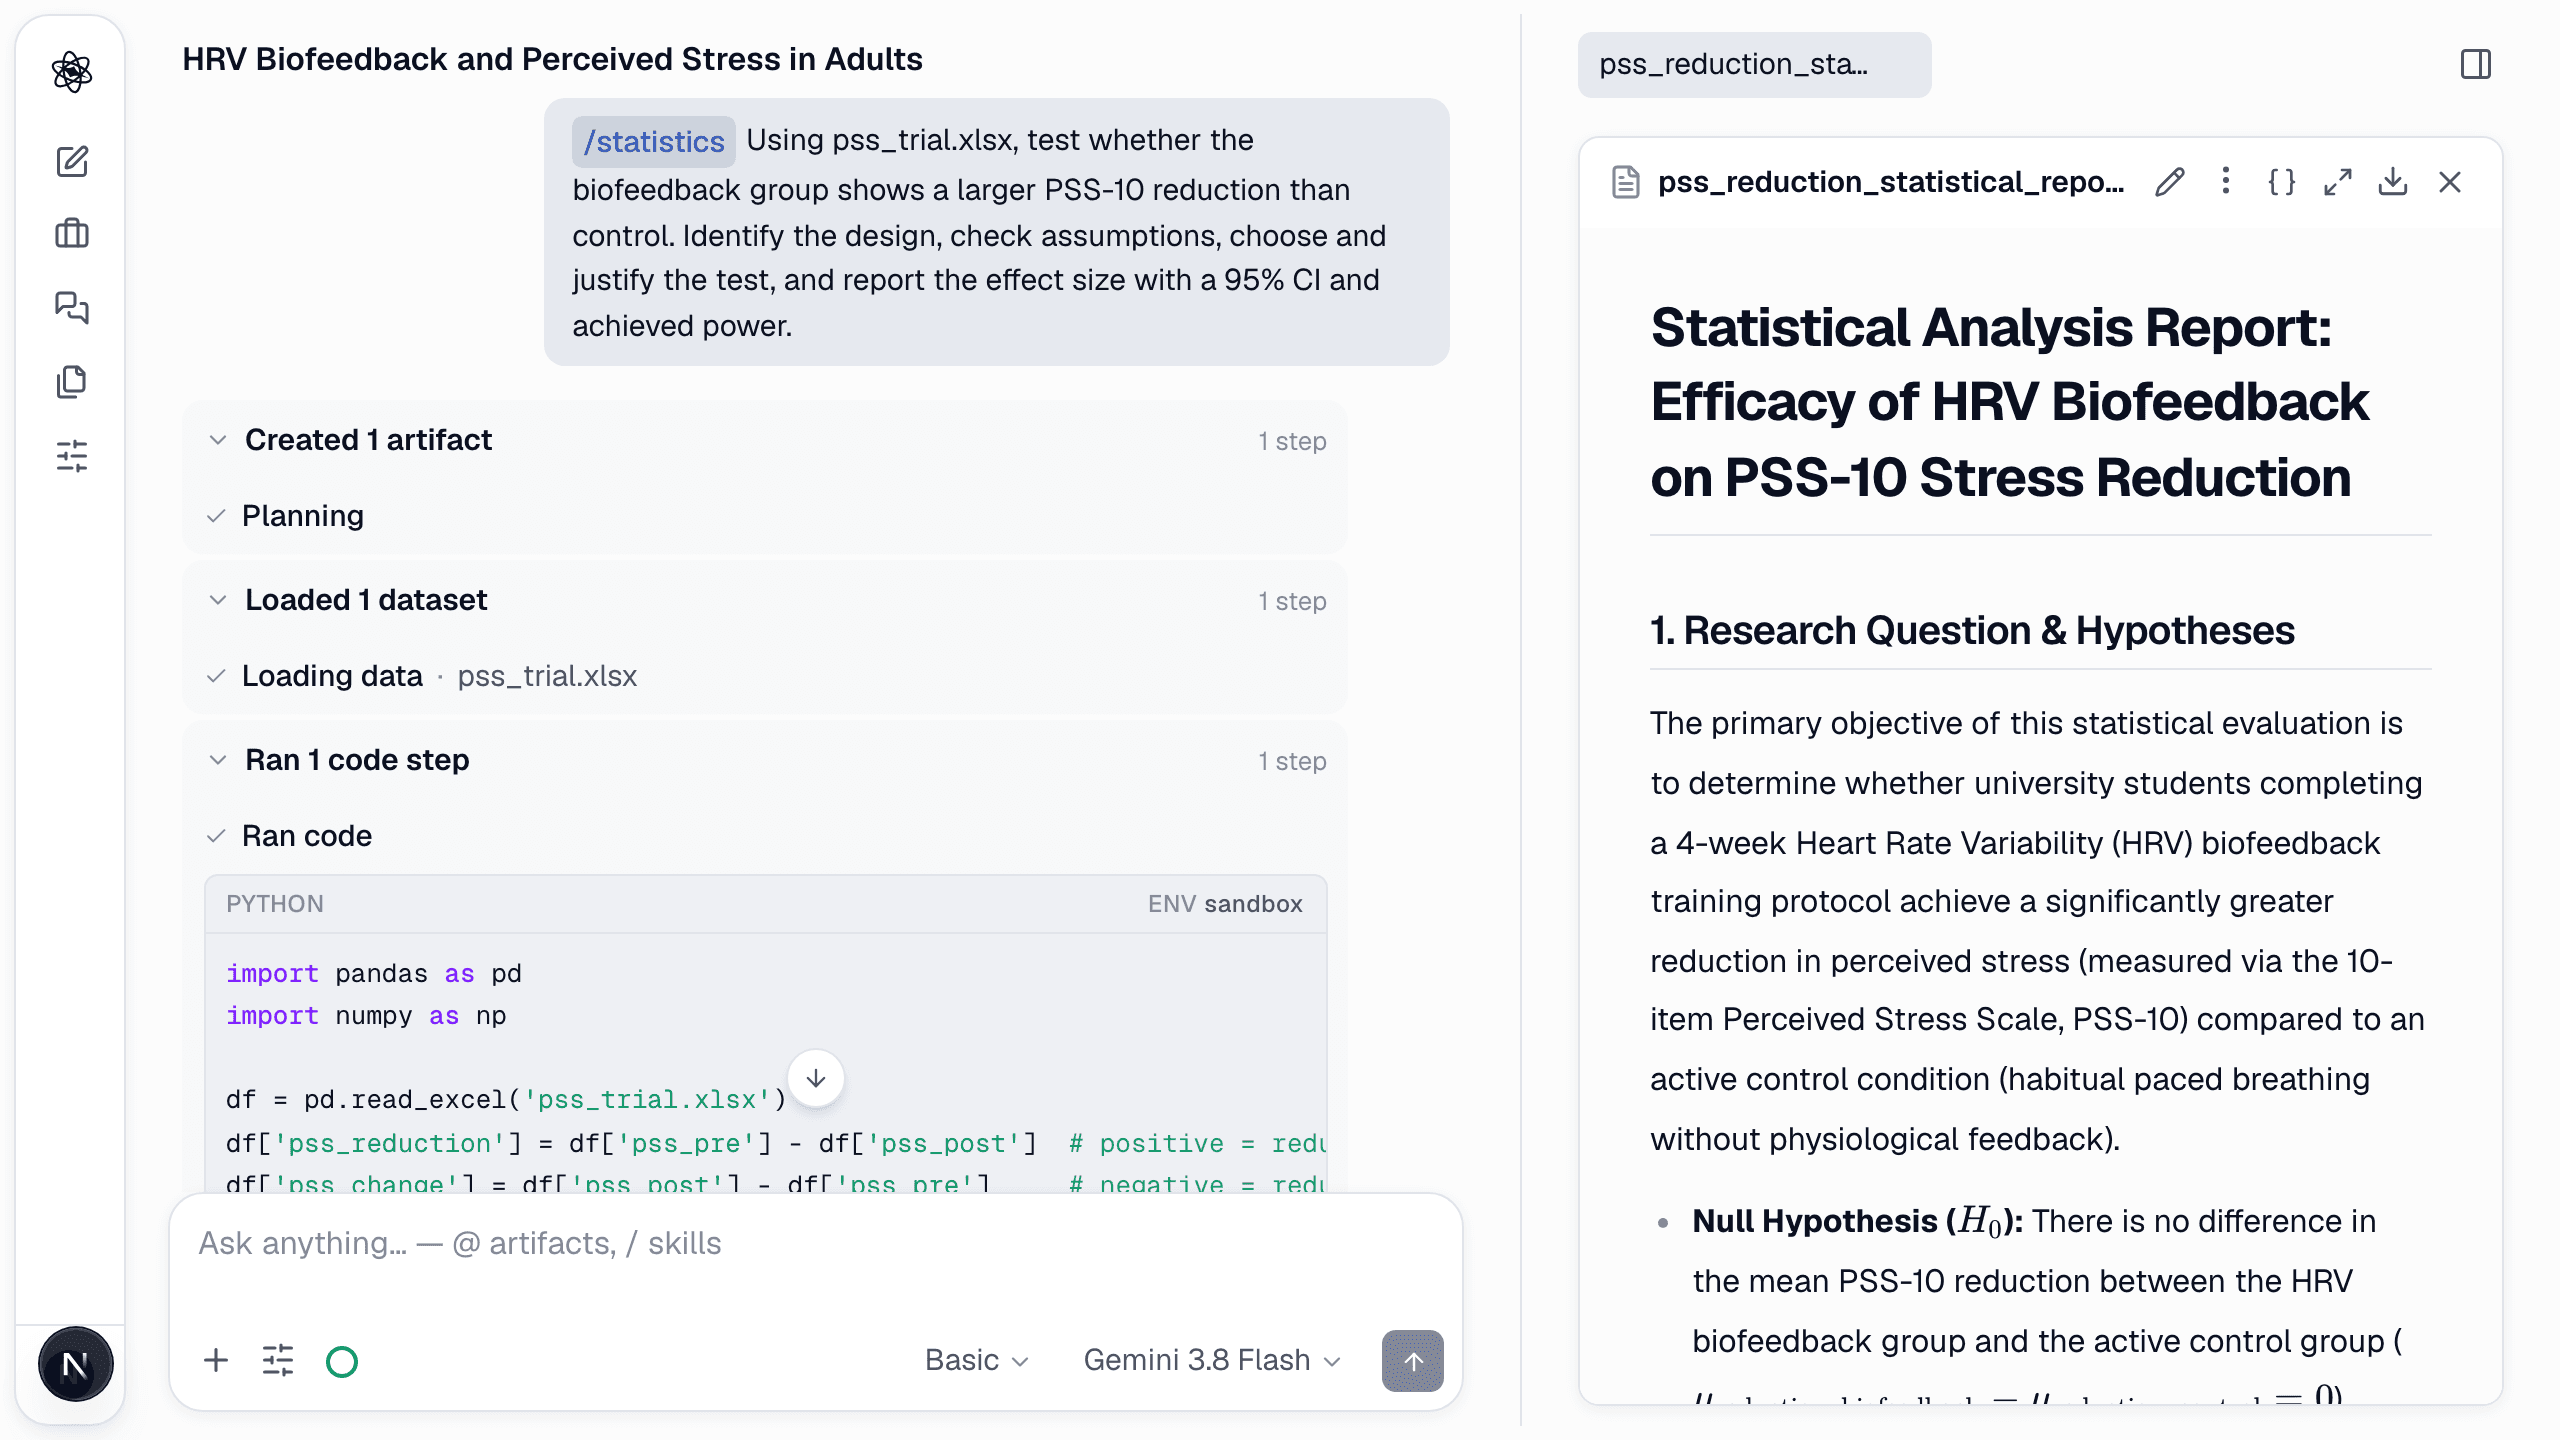
You describe the comparison and what you need reported; the agent chooses the method. No re-upload — the file is already in the session.
/statistics Using pss_trial.xlsx, test whether the biofeedback group shows a larger PSS-10 reduction than control. Check assumptions, choose the appropriate test, and report the effect size with a 95% CI and achieved power.
Step 2 — The model follows the design
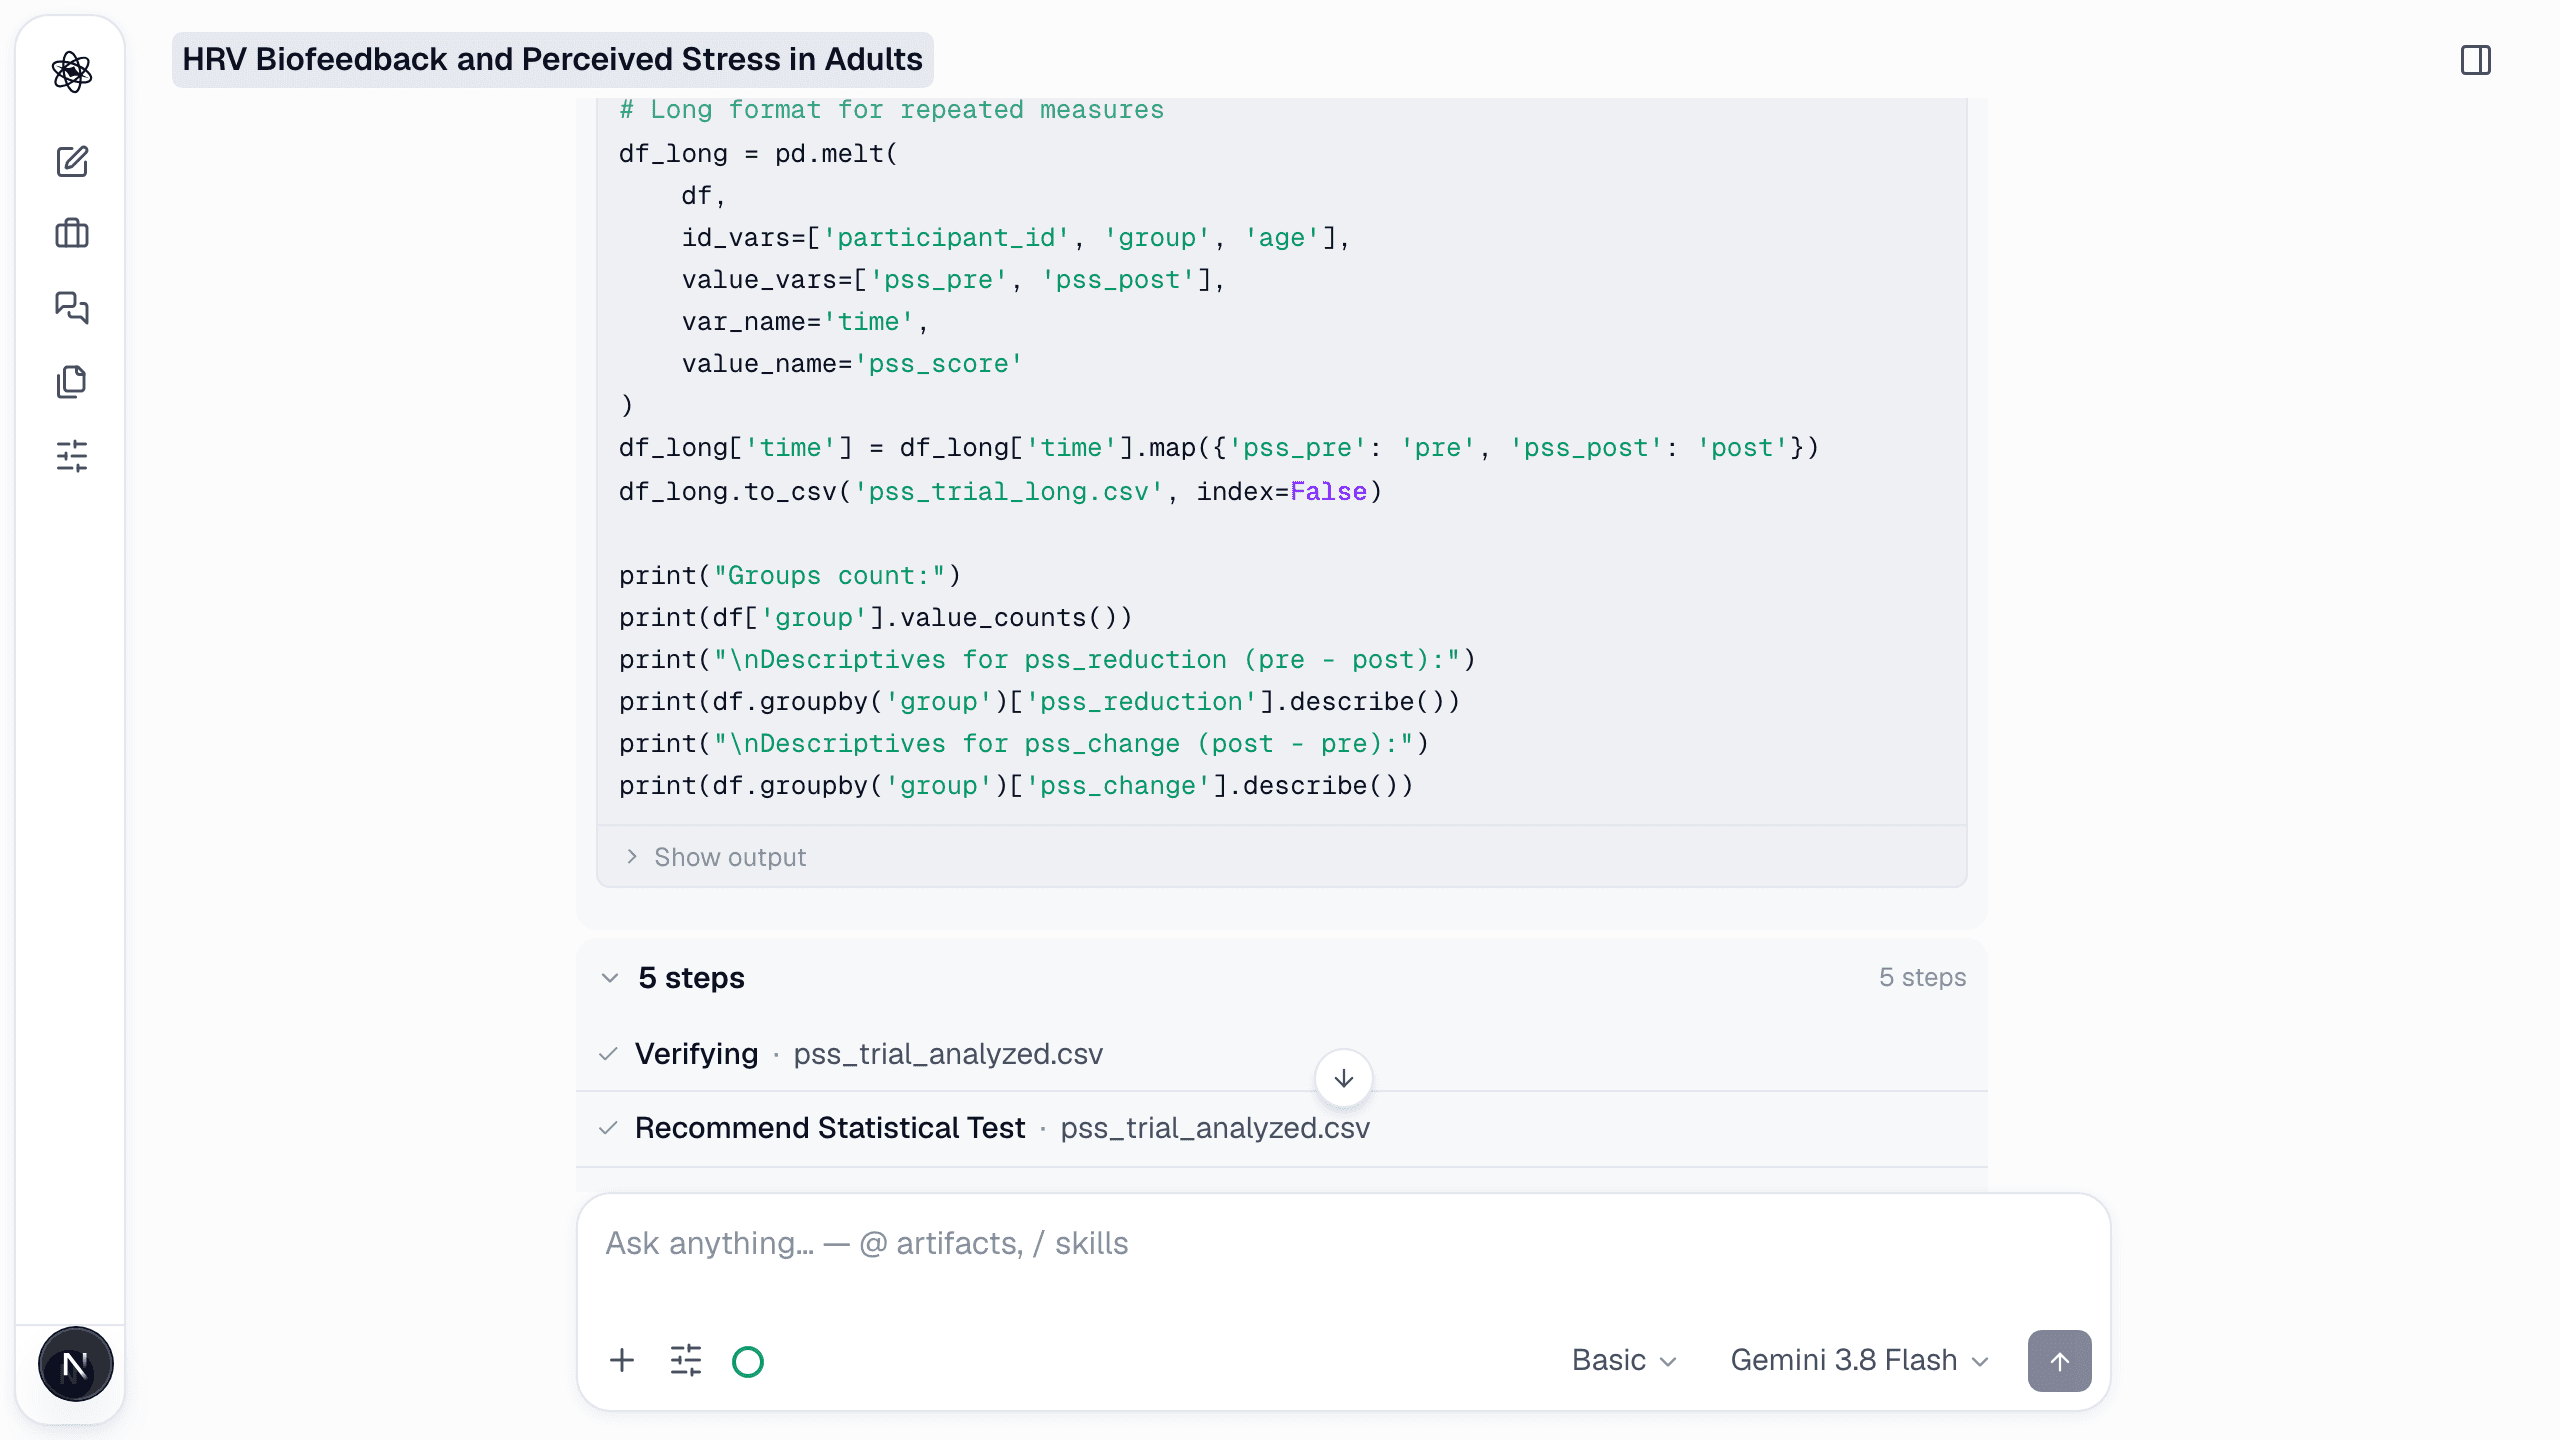
The agent identifies the design (two independent groups, pre/post), audits normality and variance, and only then picks the test: Welch's t alongside Student's t, plus a baseline-adjusted ANCOVA. The code runs in a sandbox and stays attached to the result. Psychometrics and modern modeling are native, not add-ons:
- Factor analysis (EFA and CFA) and SEM with fit indices interpreted, not just printed.
- Reliability as alpha and omega, with the difference explained when it matters.
- Mixed-effects models for nested and longitudinal data, with the random-effects structure justified.
- Bayesian estimation when small samples or prior knowledge call for it.
Step 3 — Effects with uncertainty, not just p-values
Results come with everything a reviewer will ask for: Cohen's d = 1.23 with a 95% CI, Hedges' g, partial η² for the ANCOVA, achieved power, and the smallest effect the design could have detected at 80% and 90% power.
Step 4 — Assumptions checked twice
Every analysis passes through two agents. The generation agent runs the model with its assumption checks; on Deep effort an independent review agent then tries to break it — assumption violations, multiple-comparison risk, sample-size concerns, signs of p-hacking — before the result reaches your report. Disagreements are shown, not hidden.
Step 5 — A report you can cite on its own
The statistical report is a separate document from the data report, so the two can be cited independently in the manuscript — and a structured JSON of the results lets the writing step quote the numbers instead of retyping them.
The question is never "is it significant?" It's "would this survive a careful reviewer?" — and that check is built in.