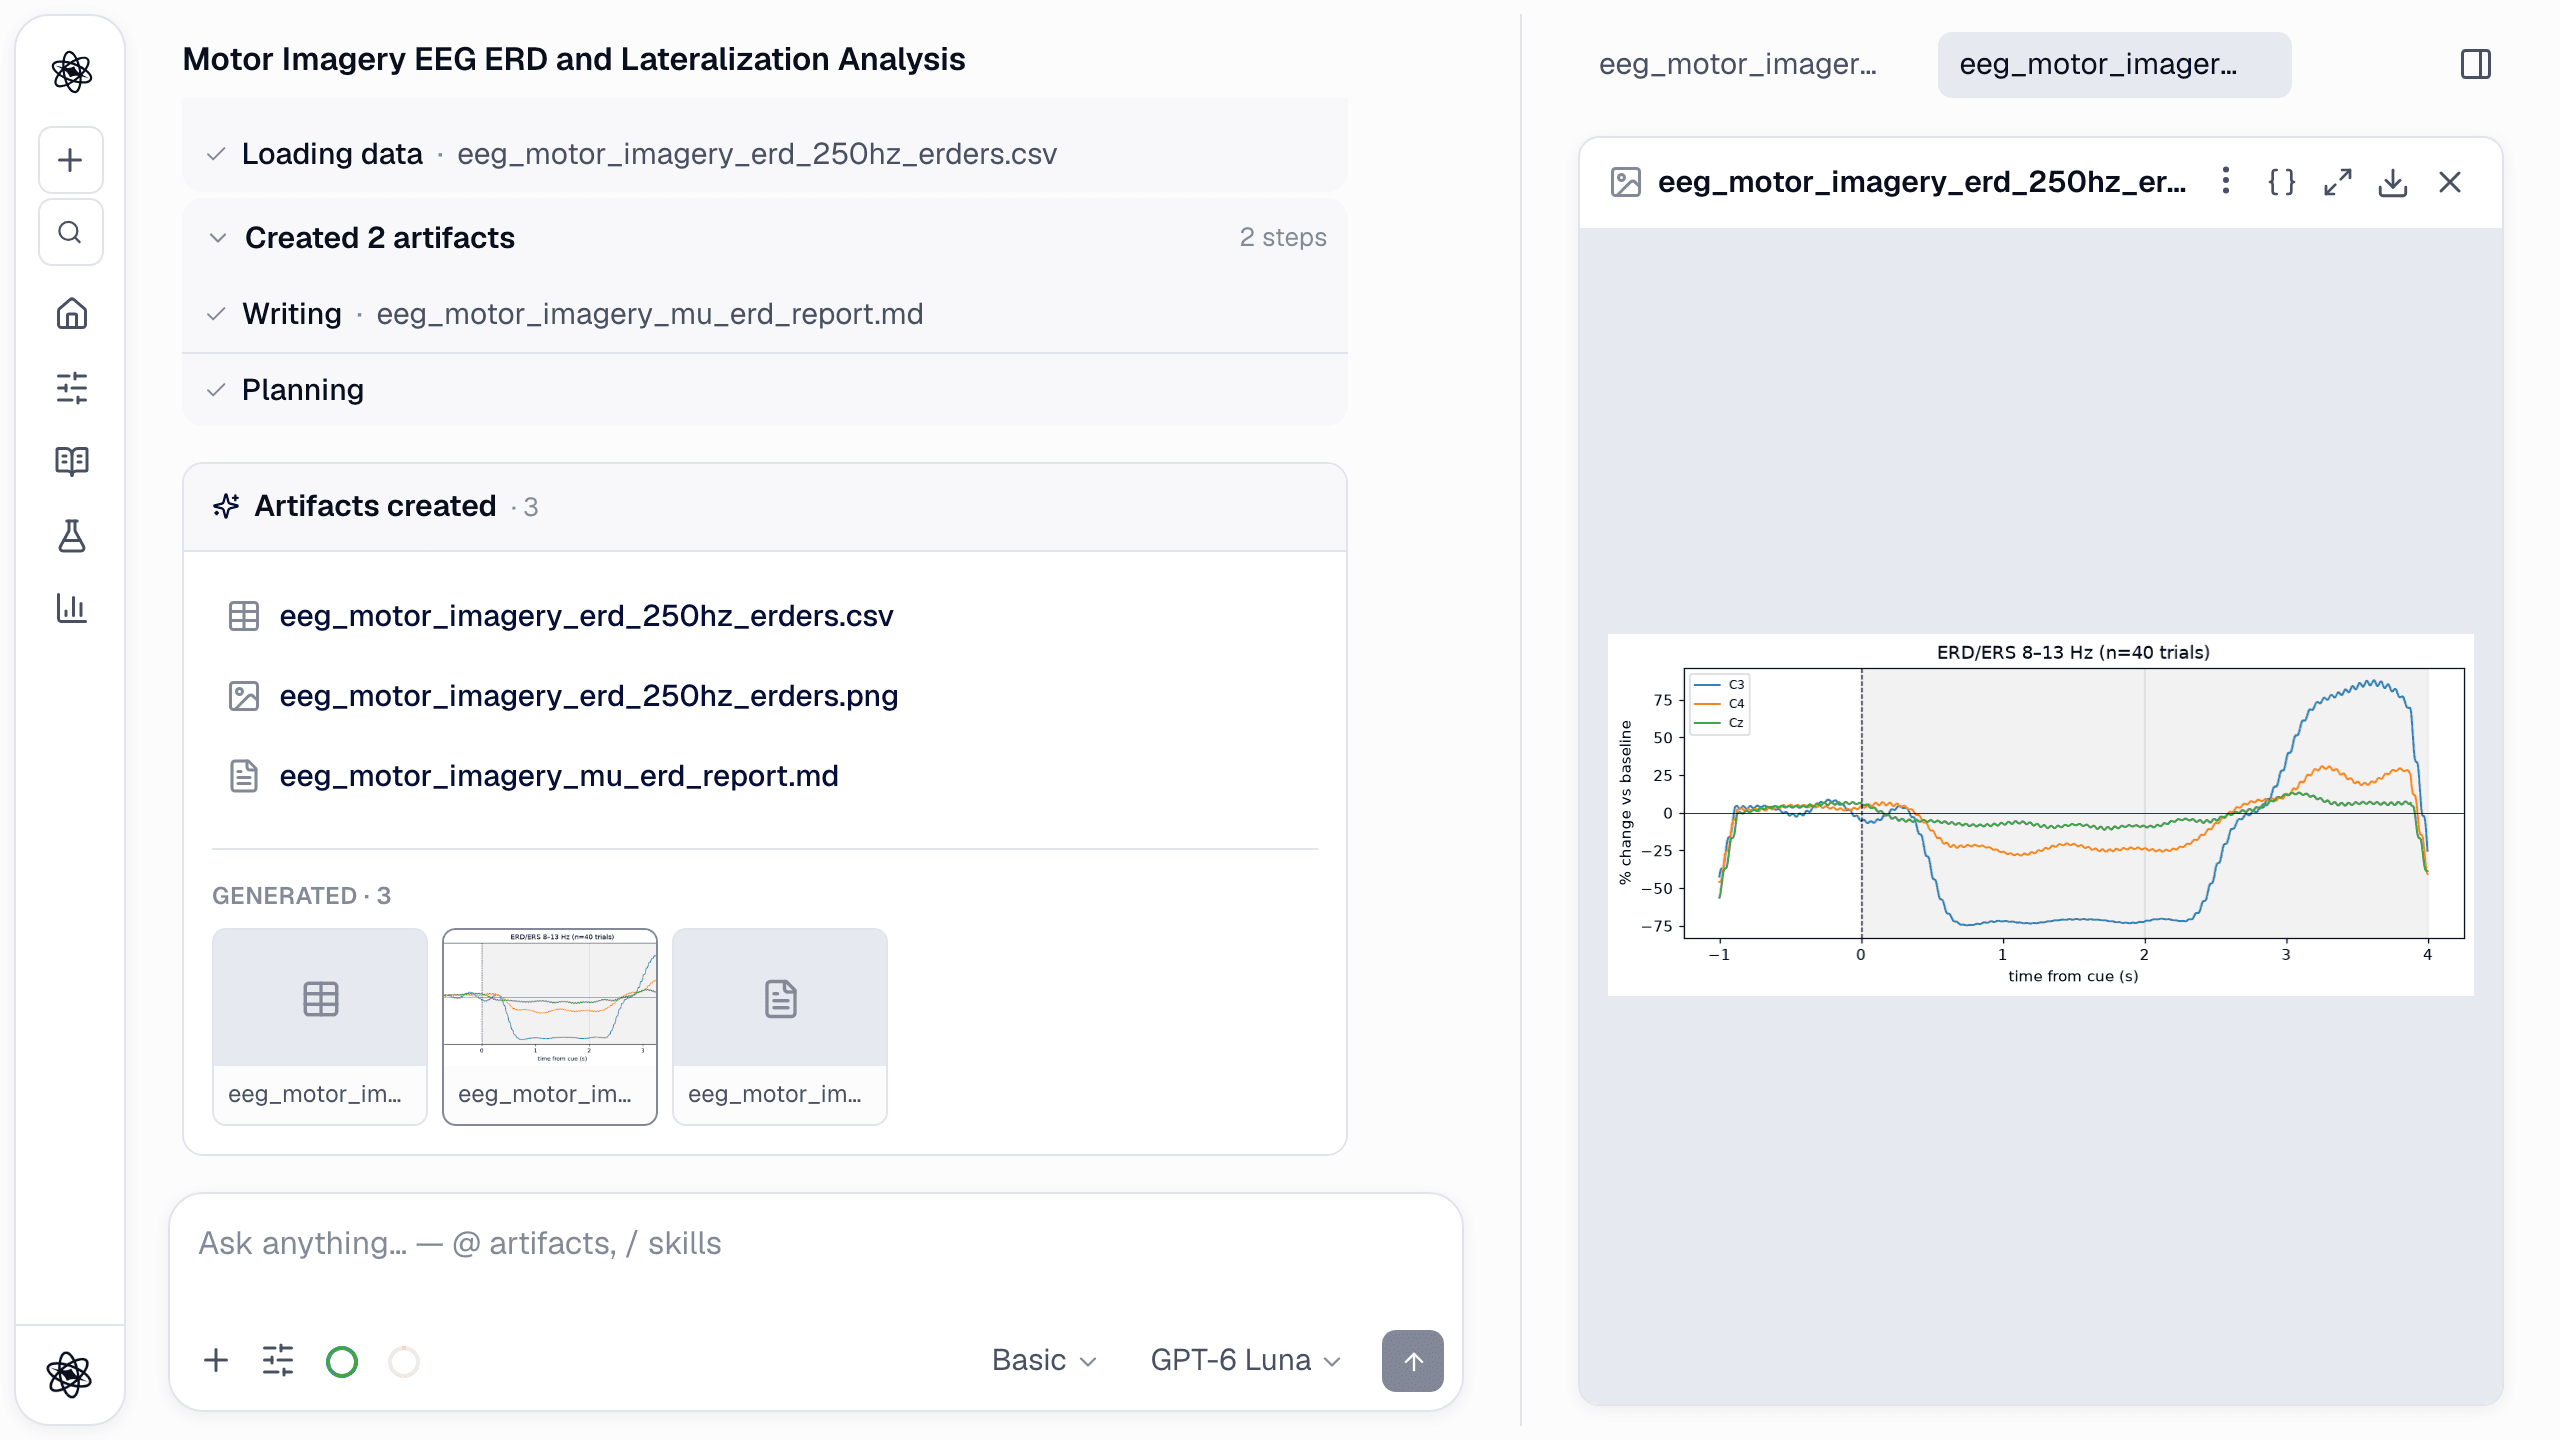
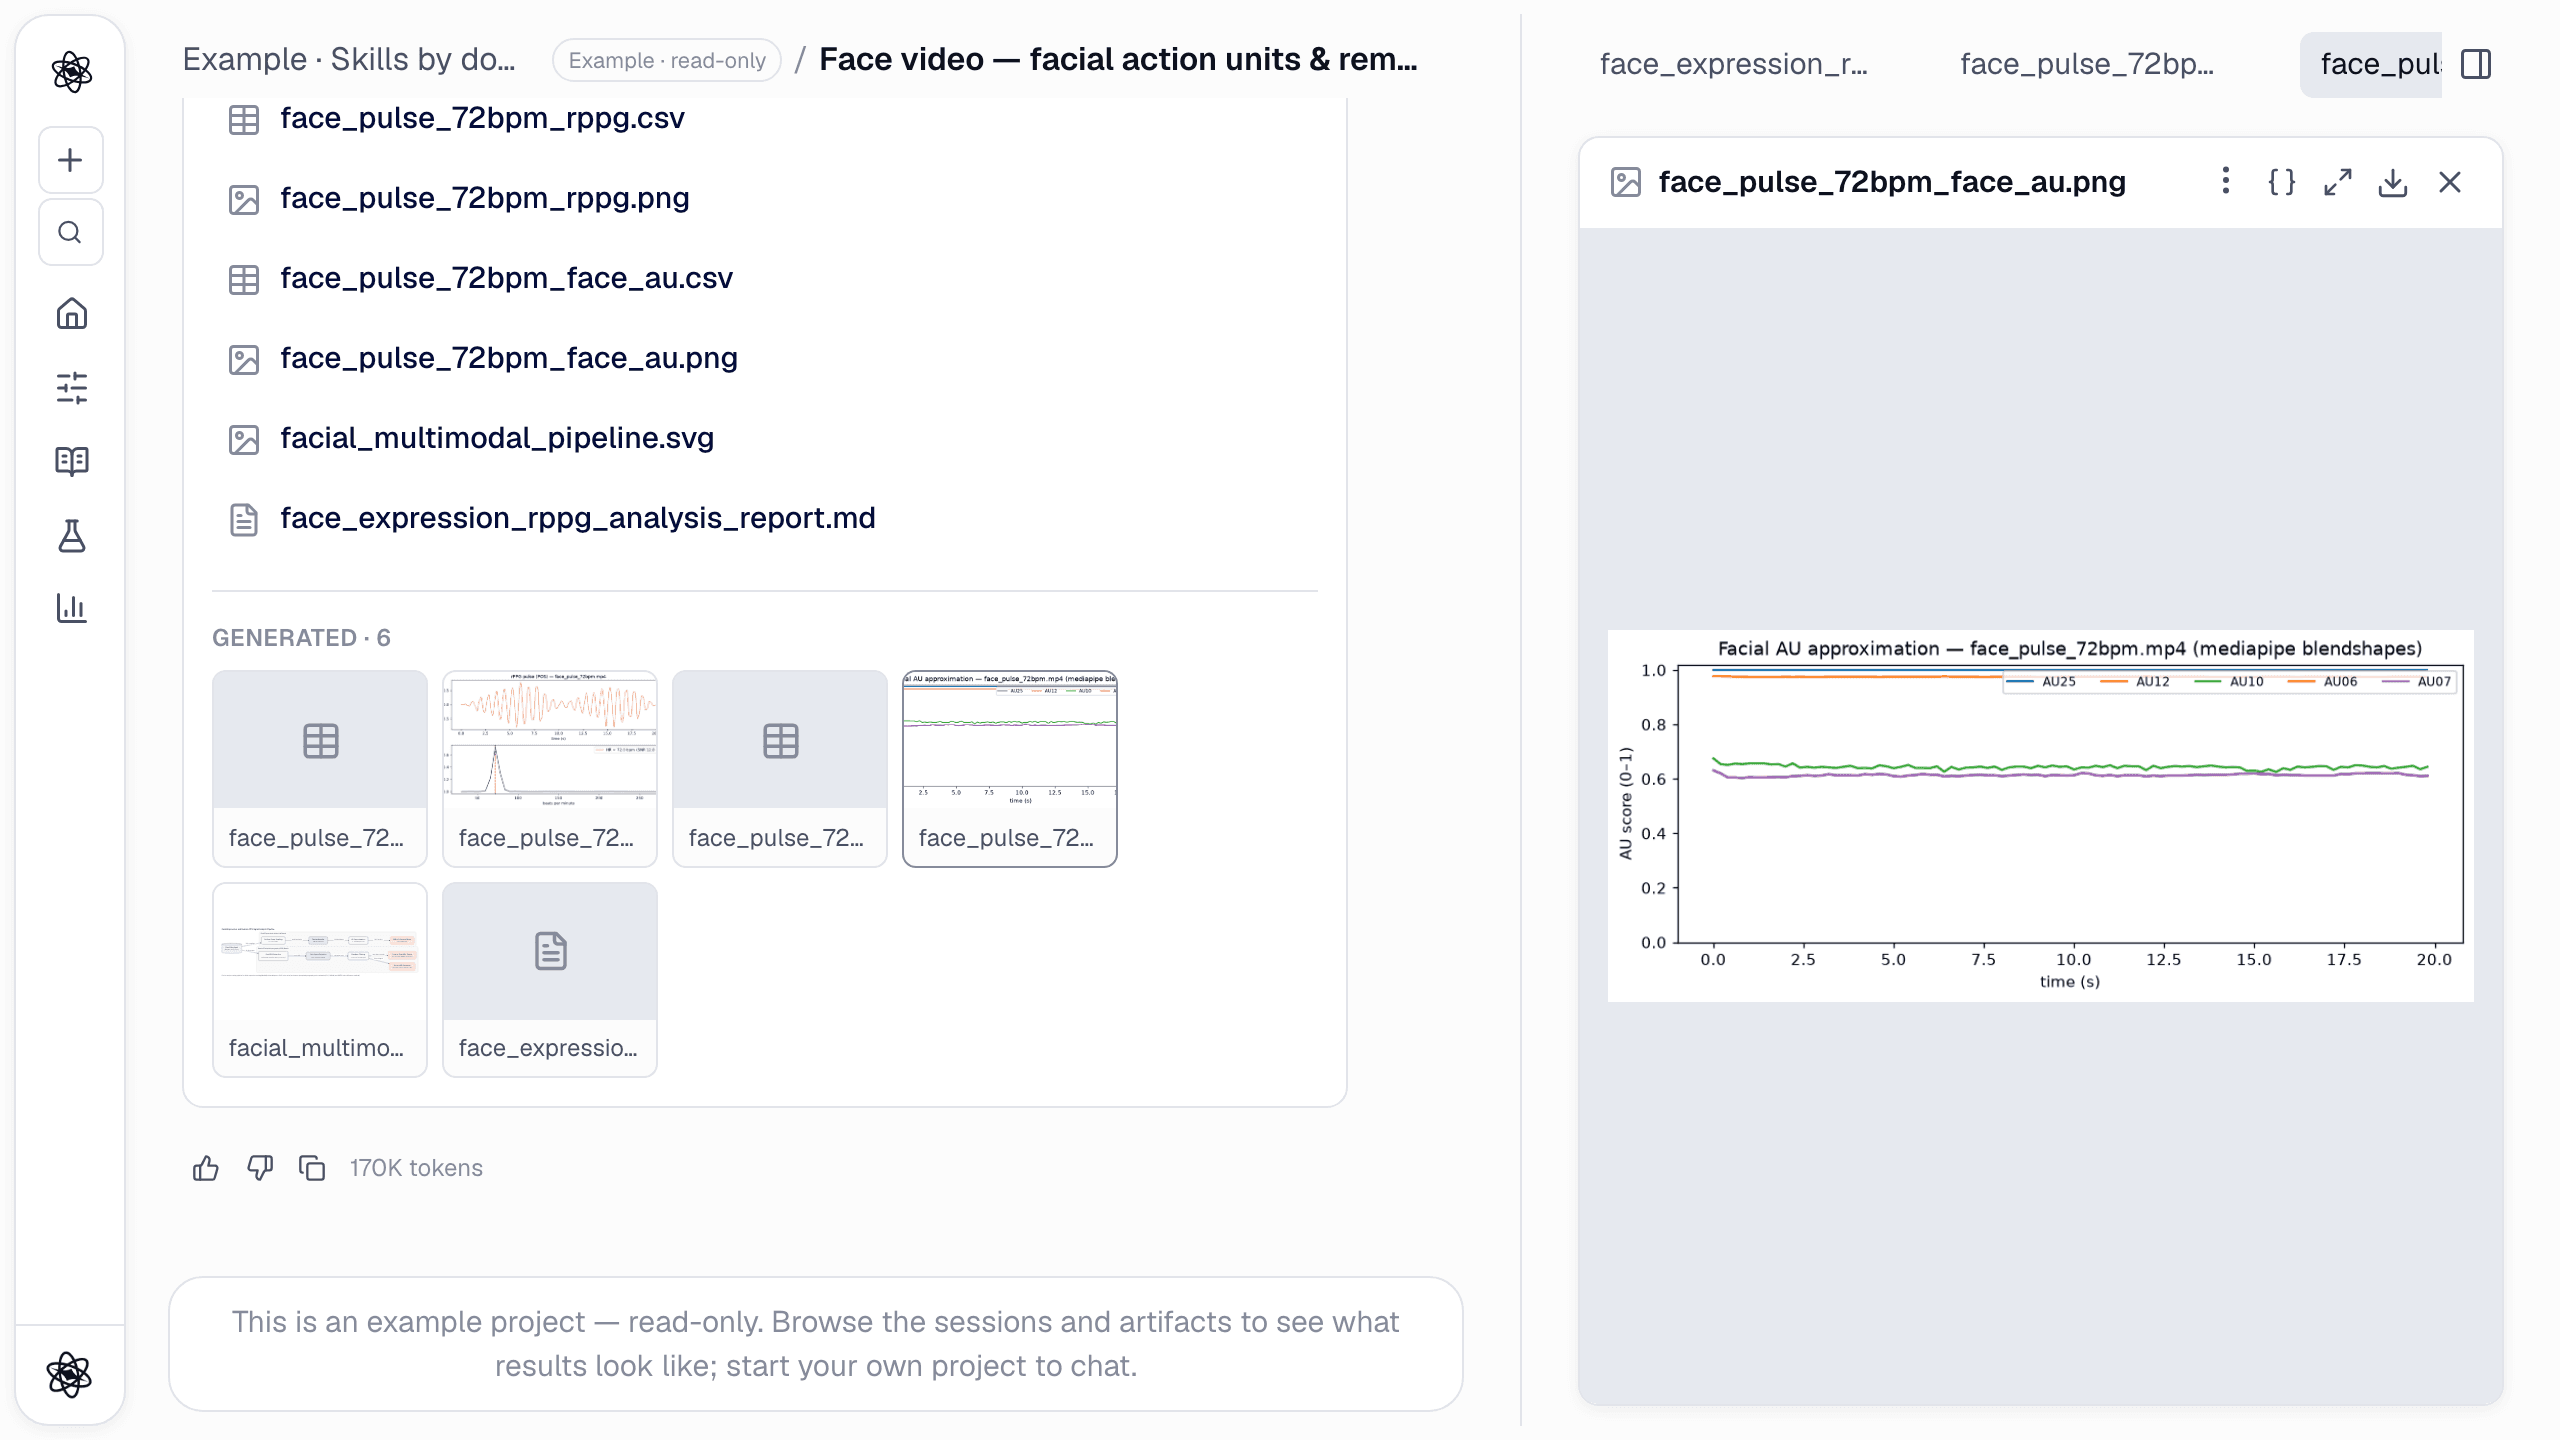
Audio is one of the richest things a study can record and one of the most tedious to analyse. The words go to a transcription service or a research assistant. The voice goes to Praat. Then the numbers get copied into a spreadsheet and on into R or SPSS. By the time you write the results section, nobody remembers which pitch floor was used or which version of the transcript was coded.
In Neutropic the audio stays in one session, from the upload to the report. This post goes deeper on audio only: what you can upload, what each tool measures, how to read the output, and where the limits are. For the overview across EEG, audio and video, see Beyond spreadsheets.
What you can upload
Attach the recording to a chat like any other file. These audio formats are accepted: .wav .mp3 .m4a .flac .ogg .aac .aiff. Transcription can also read the sound track of a video (.mp4 .mov .webm and others). Uploads can be up to 1 GB.
A few practical points:
- WAV is the safest input for voice measures. Transcription reads every format above; the pitch and acoustic tools are documented for WAV, so convert compressed files first when voice quality matters.
- One speaker per file works best. The voice tools summarise the whole clip. If an interview has two voices, the pitch statistics mix both (more on this under limits).
- Say what the recording is. "Read-aloud sample", "semi-structured interview, participant P07" or "think-aloud, task 3" helps the agent choose the right steps and phrase the report correctly.
Speech-to-text, run by Neutropic itself
Transcription uses faster-whisper, an open-source build of OpenAI's Whisper model, running on Neutropic's own servers. The audio is not sent to an outside transcription API.
- Model size. You can ask for
tiny,base,smallormedium. Larger models are slower and more accurate. For anything other than clear English, ask forsmallormedium. - Language. Whisper detects the language and reports the probability. You can also name it ("the audio is Korean") to skip detection. Chinese output is steered to Simplified characters.
- Segments with timestamps. Each segment has a start and end time in seconds. Silence is trimmed by a voice-activity filter, so long pauses show up as gaps between segments.
- Length and speaking rate. For English, Korean and other space-separated languages you get words and words per minute. For Chinese and Japanese, which are written without spaces, the count is in characters and the rate in characters per minute. (Until today these two languages showed "1 words" or "2 words"; that is fixed.)
The result is saved as a <name>_transcript.md artifact: the model, language, duration and length on top, then the full text, then a segment table.
/analyze interview_P07.m4a is a semi-structured interview in English. Transcribe it with timestamps using the small Whisper model, and keep the transcript verbatim.
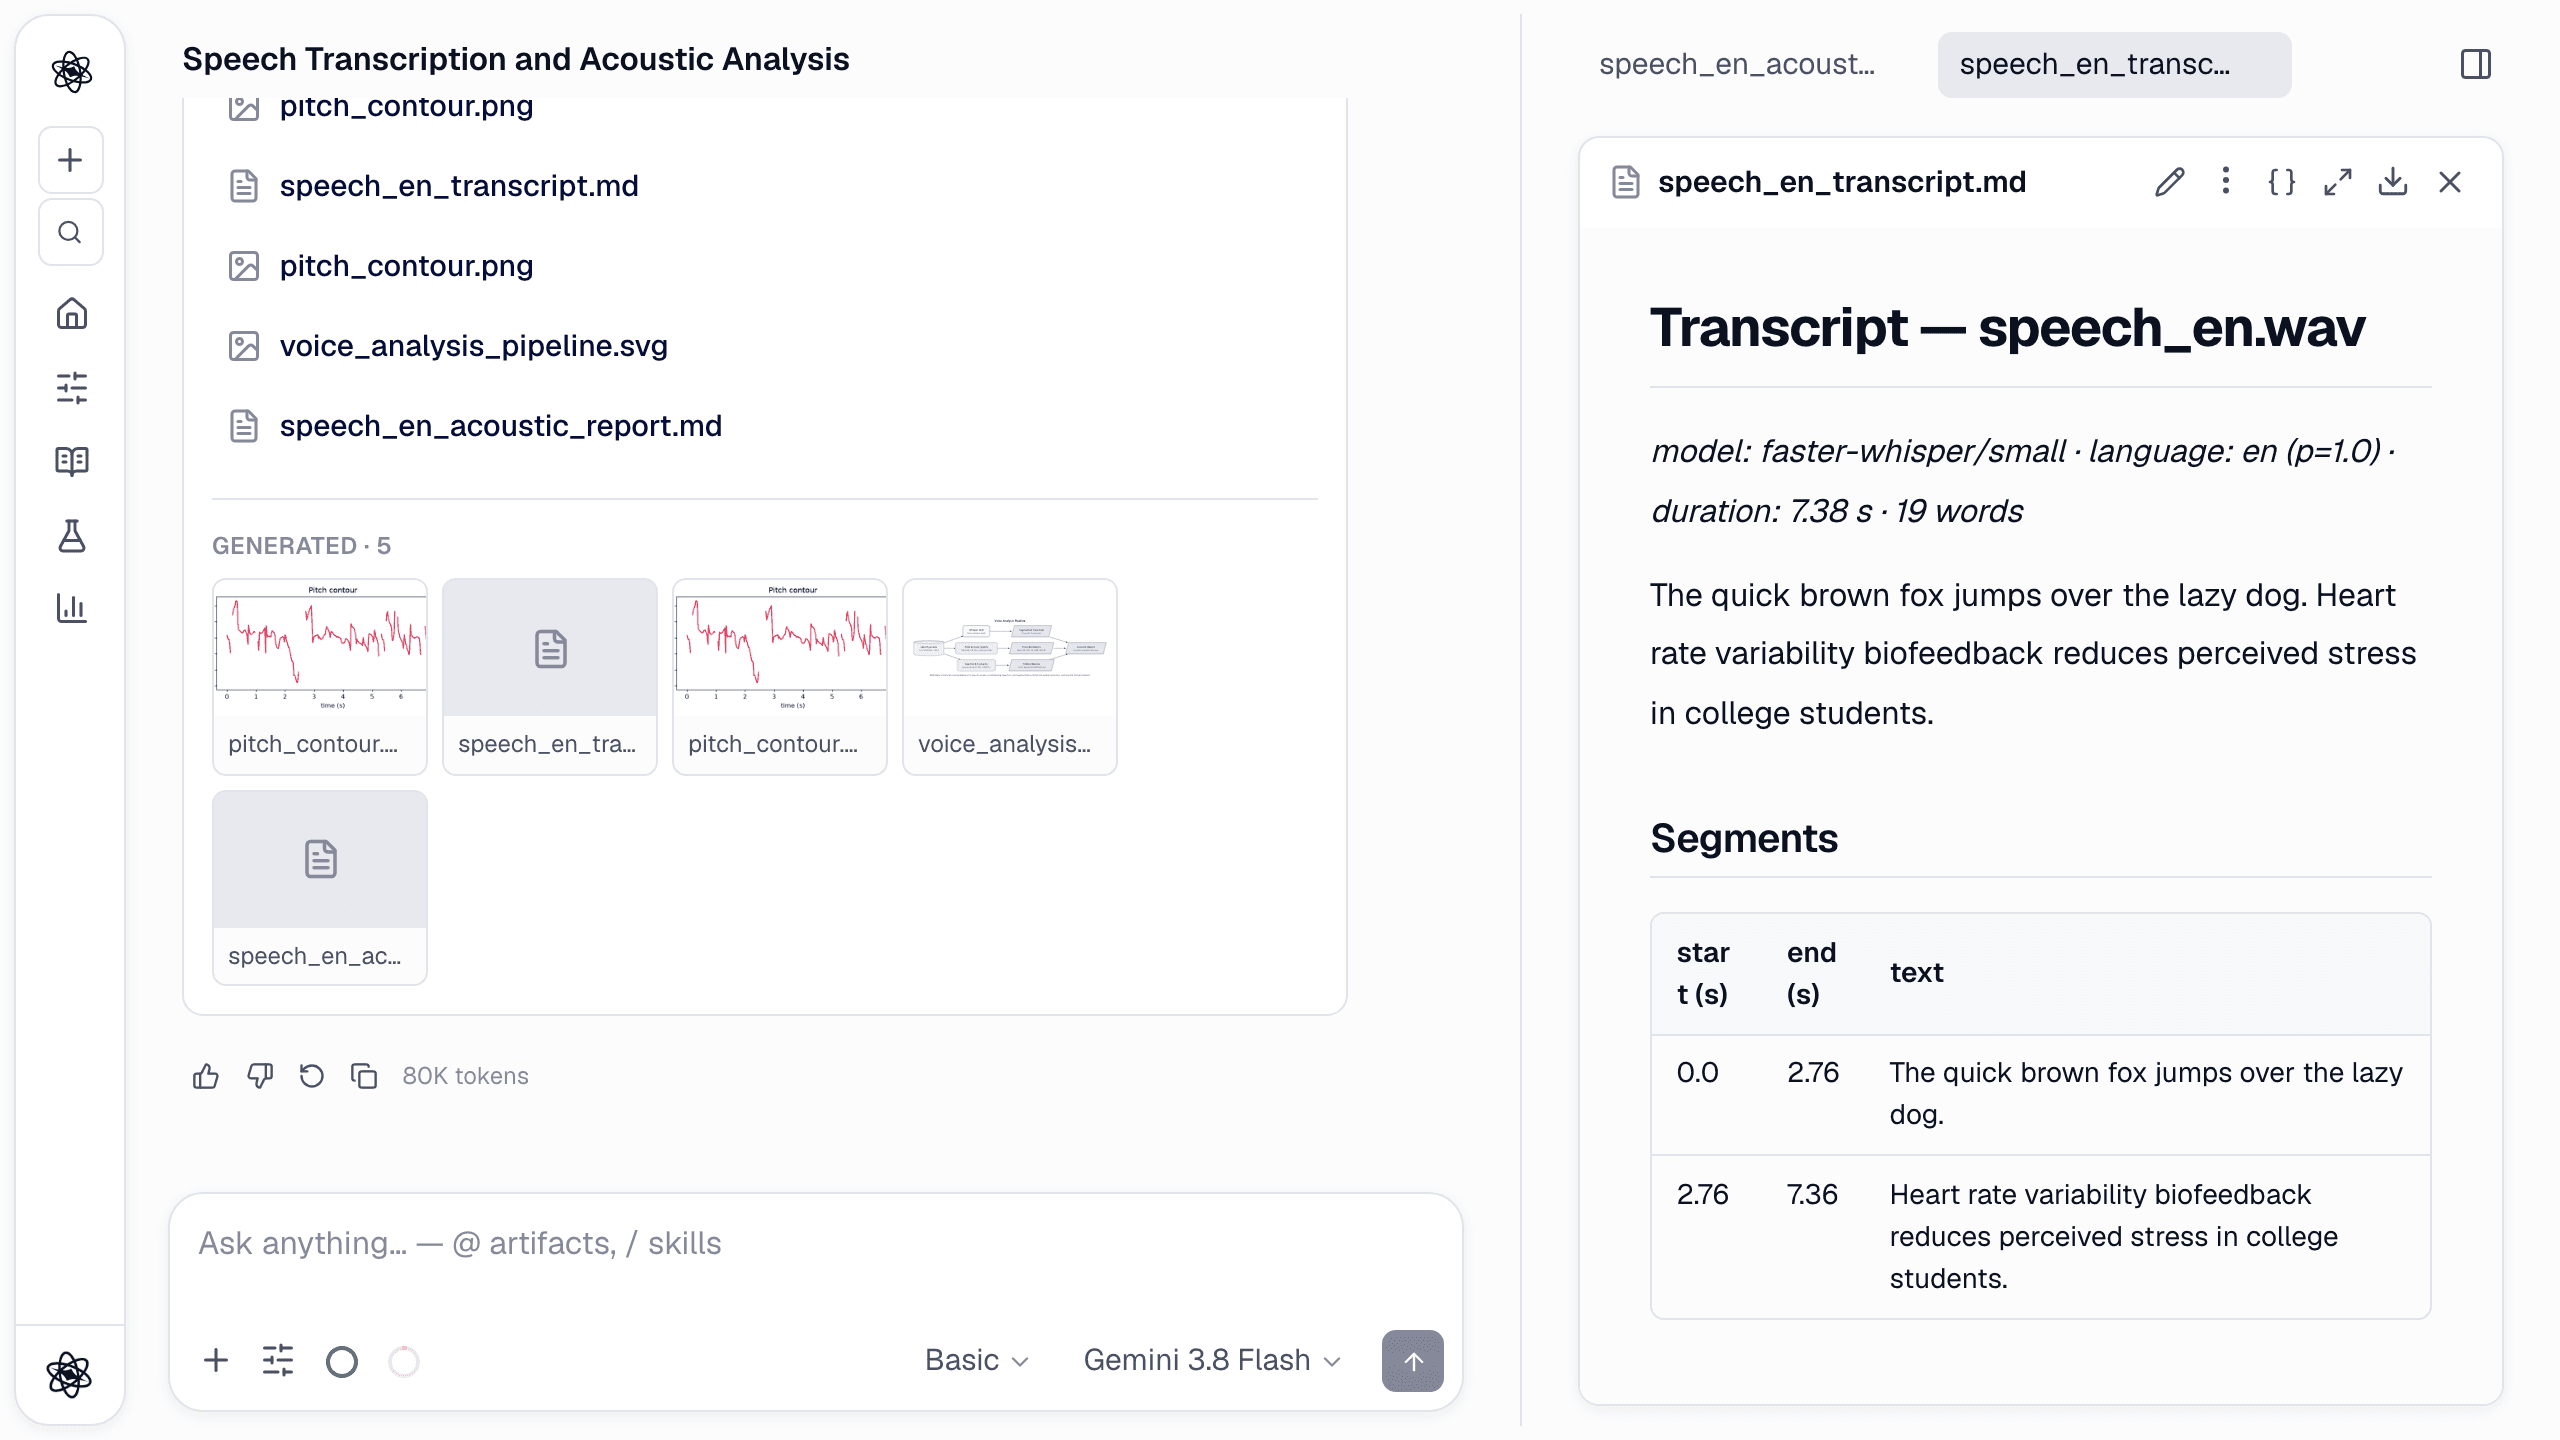
The agent is instructed to quote the transcript verbatim and never paraphrase it as if it were the audio. That matters when you later code the text.
Voice: pitch, intensity and voice quality
The voice tool reads the audio and returns:
- Pitch (F0): mean, SD, minimum, maximum and range in Hz, tracked with pYIN between 65 and 400 Hz, plus the voiced fraction of the clip.
- Intensity: mean and SD of RMS energy. This is relative to the recording, not calibrated dB SPL.
- Spectral centroid in Hz.
- Voice quality from Praat (through parselmouth): local jitter, local shimmer and HNR in dB.
- A pitch contour image,
pitch_contour.png.
The acoustic_features tool adds:
- Formants F1–F3 (Praat, Burg method): mean and SD in Hz.
- 13 MFCCs: mean and SD of each coefficient.
- Zero-crossing rate, spectral bandwidth and spectral rolloff.
Neither tool labels an emotion. The voice output carries its own note: higher F0 mean, F0 variability and intensity typically go with higher arousal, and jitter, shimmer and HNR describe voice quality, but these are features, not a validated emotion classifier. The reports follow that line.
/analyze Measure the voice in speech_en.wav: F0 mean, SD, range and contour, intensity, jitter, shimmer and HNR, plus formants F1–F3 and MFCCs. Say what each measure means and what this single clip can and cannot tell us.
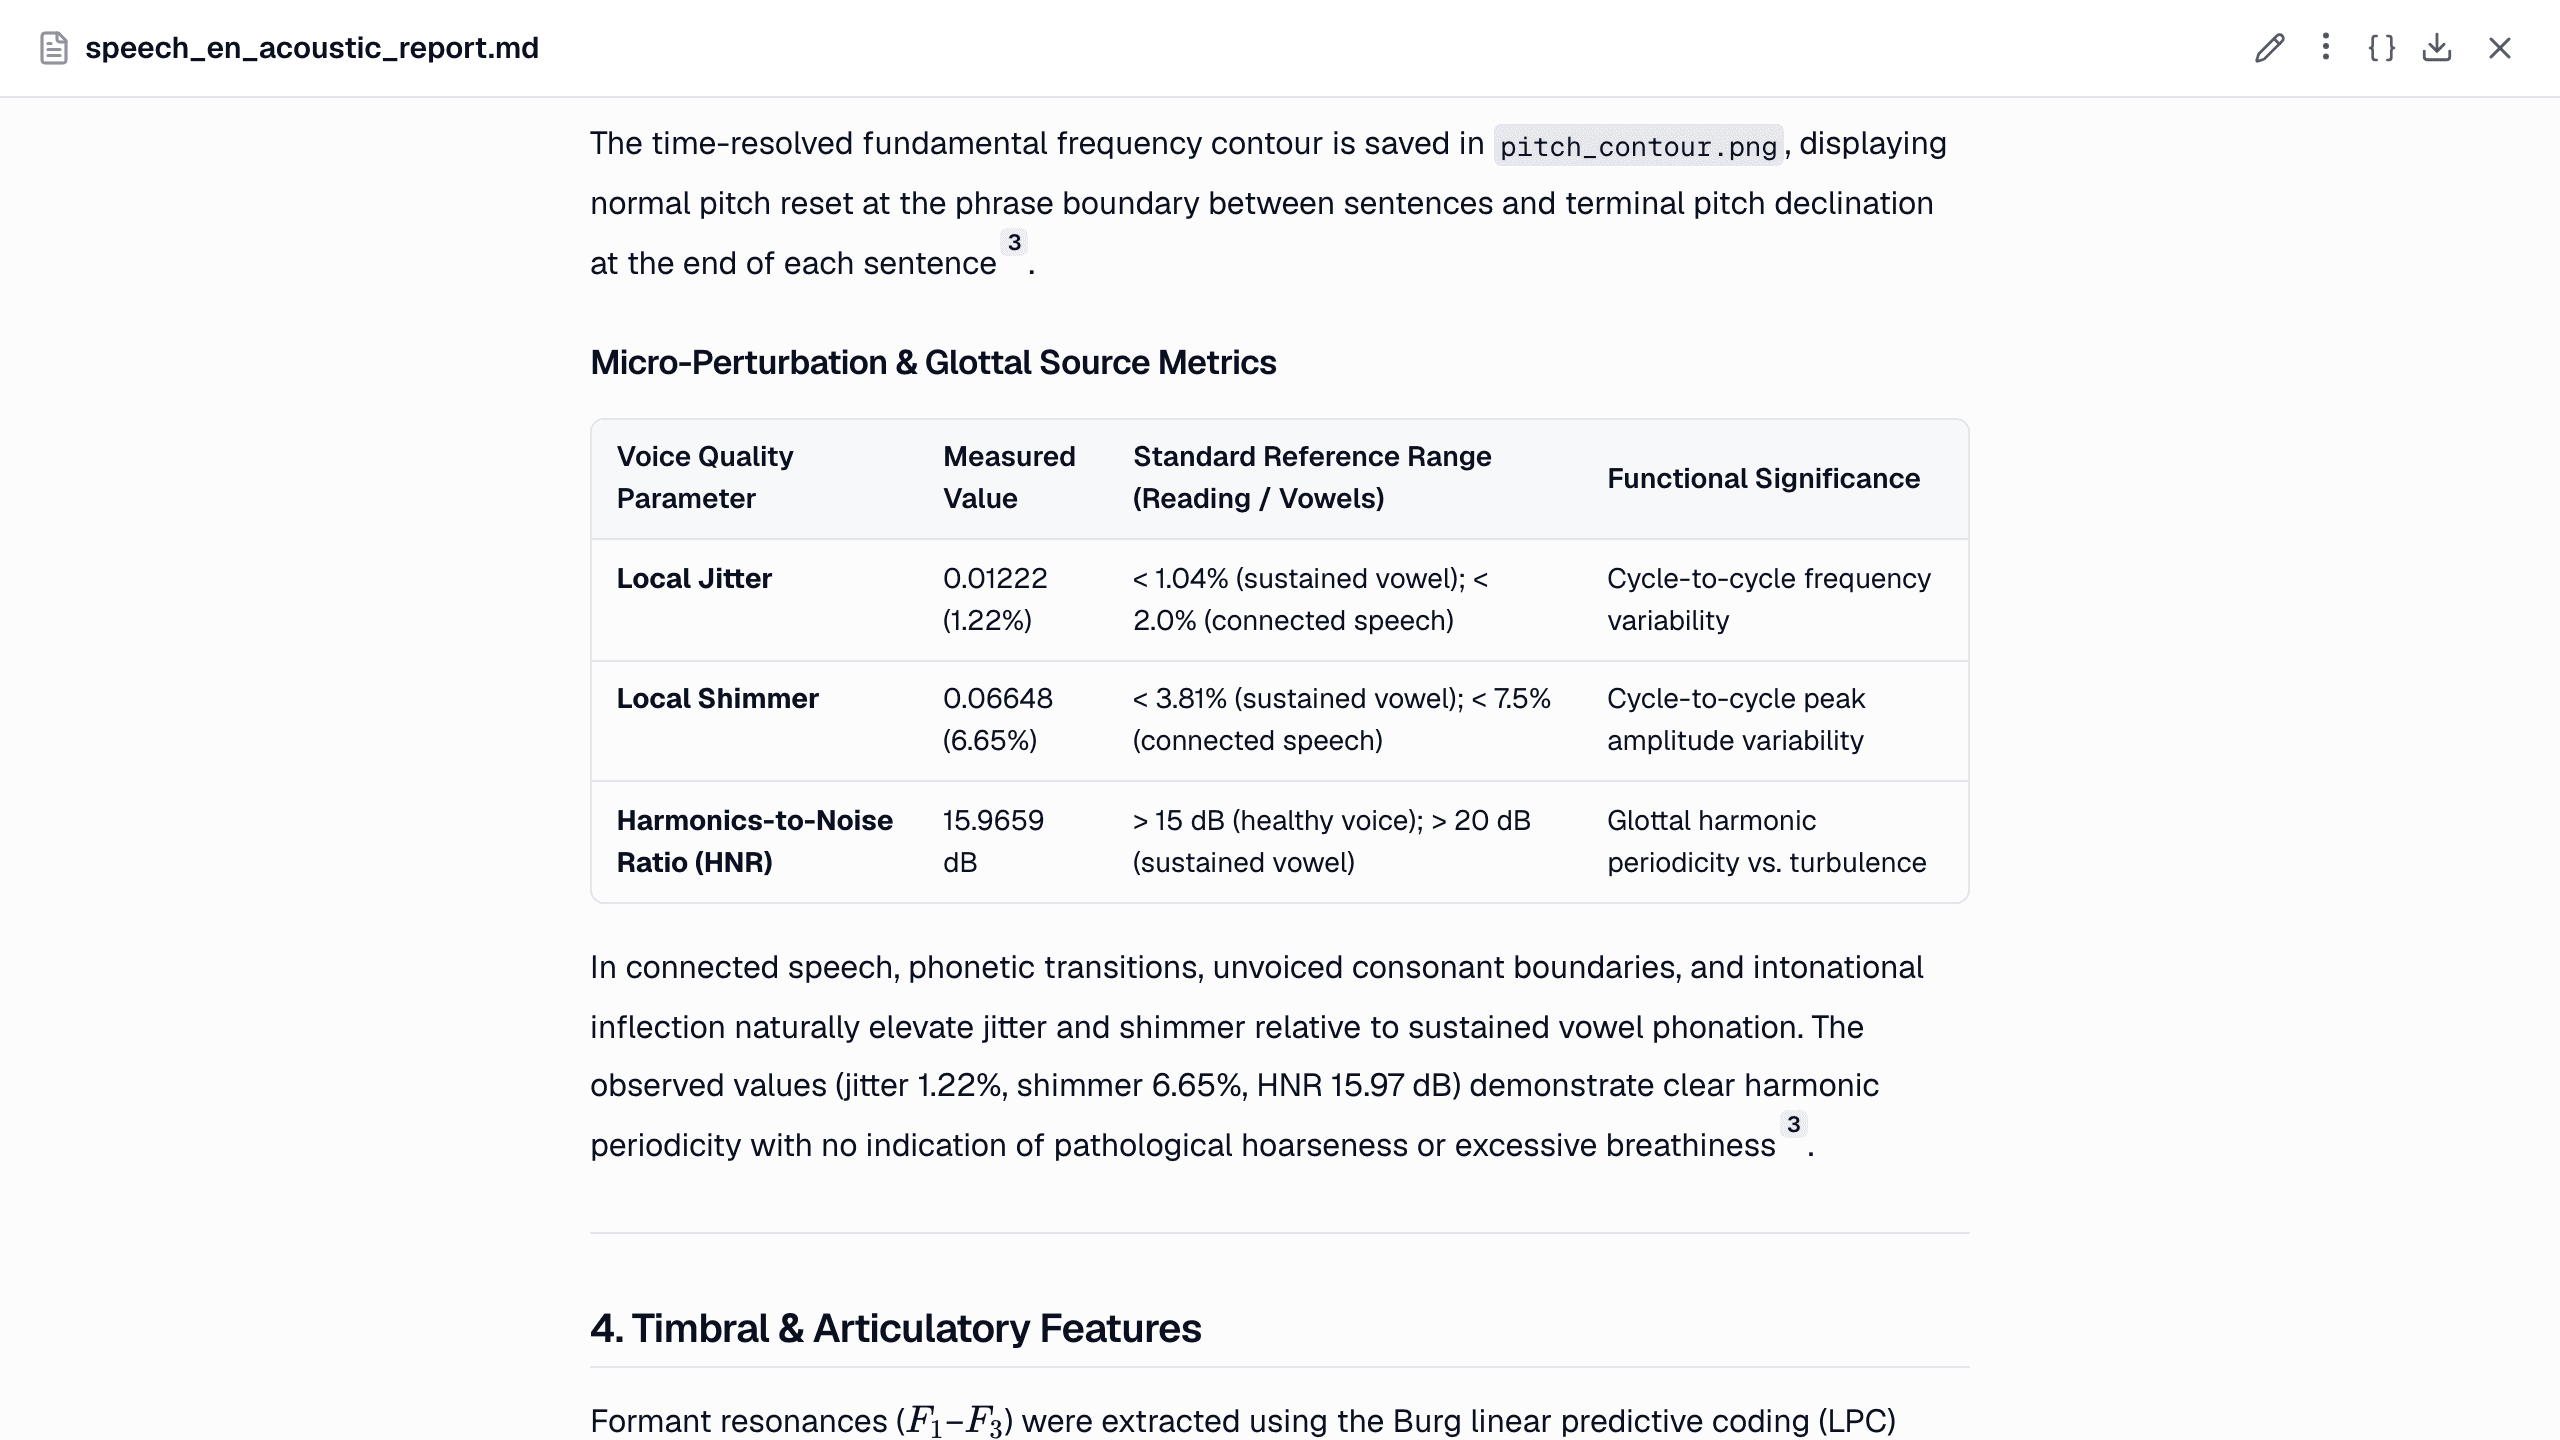
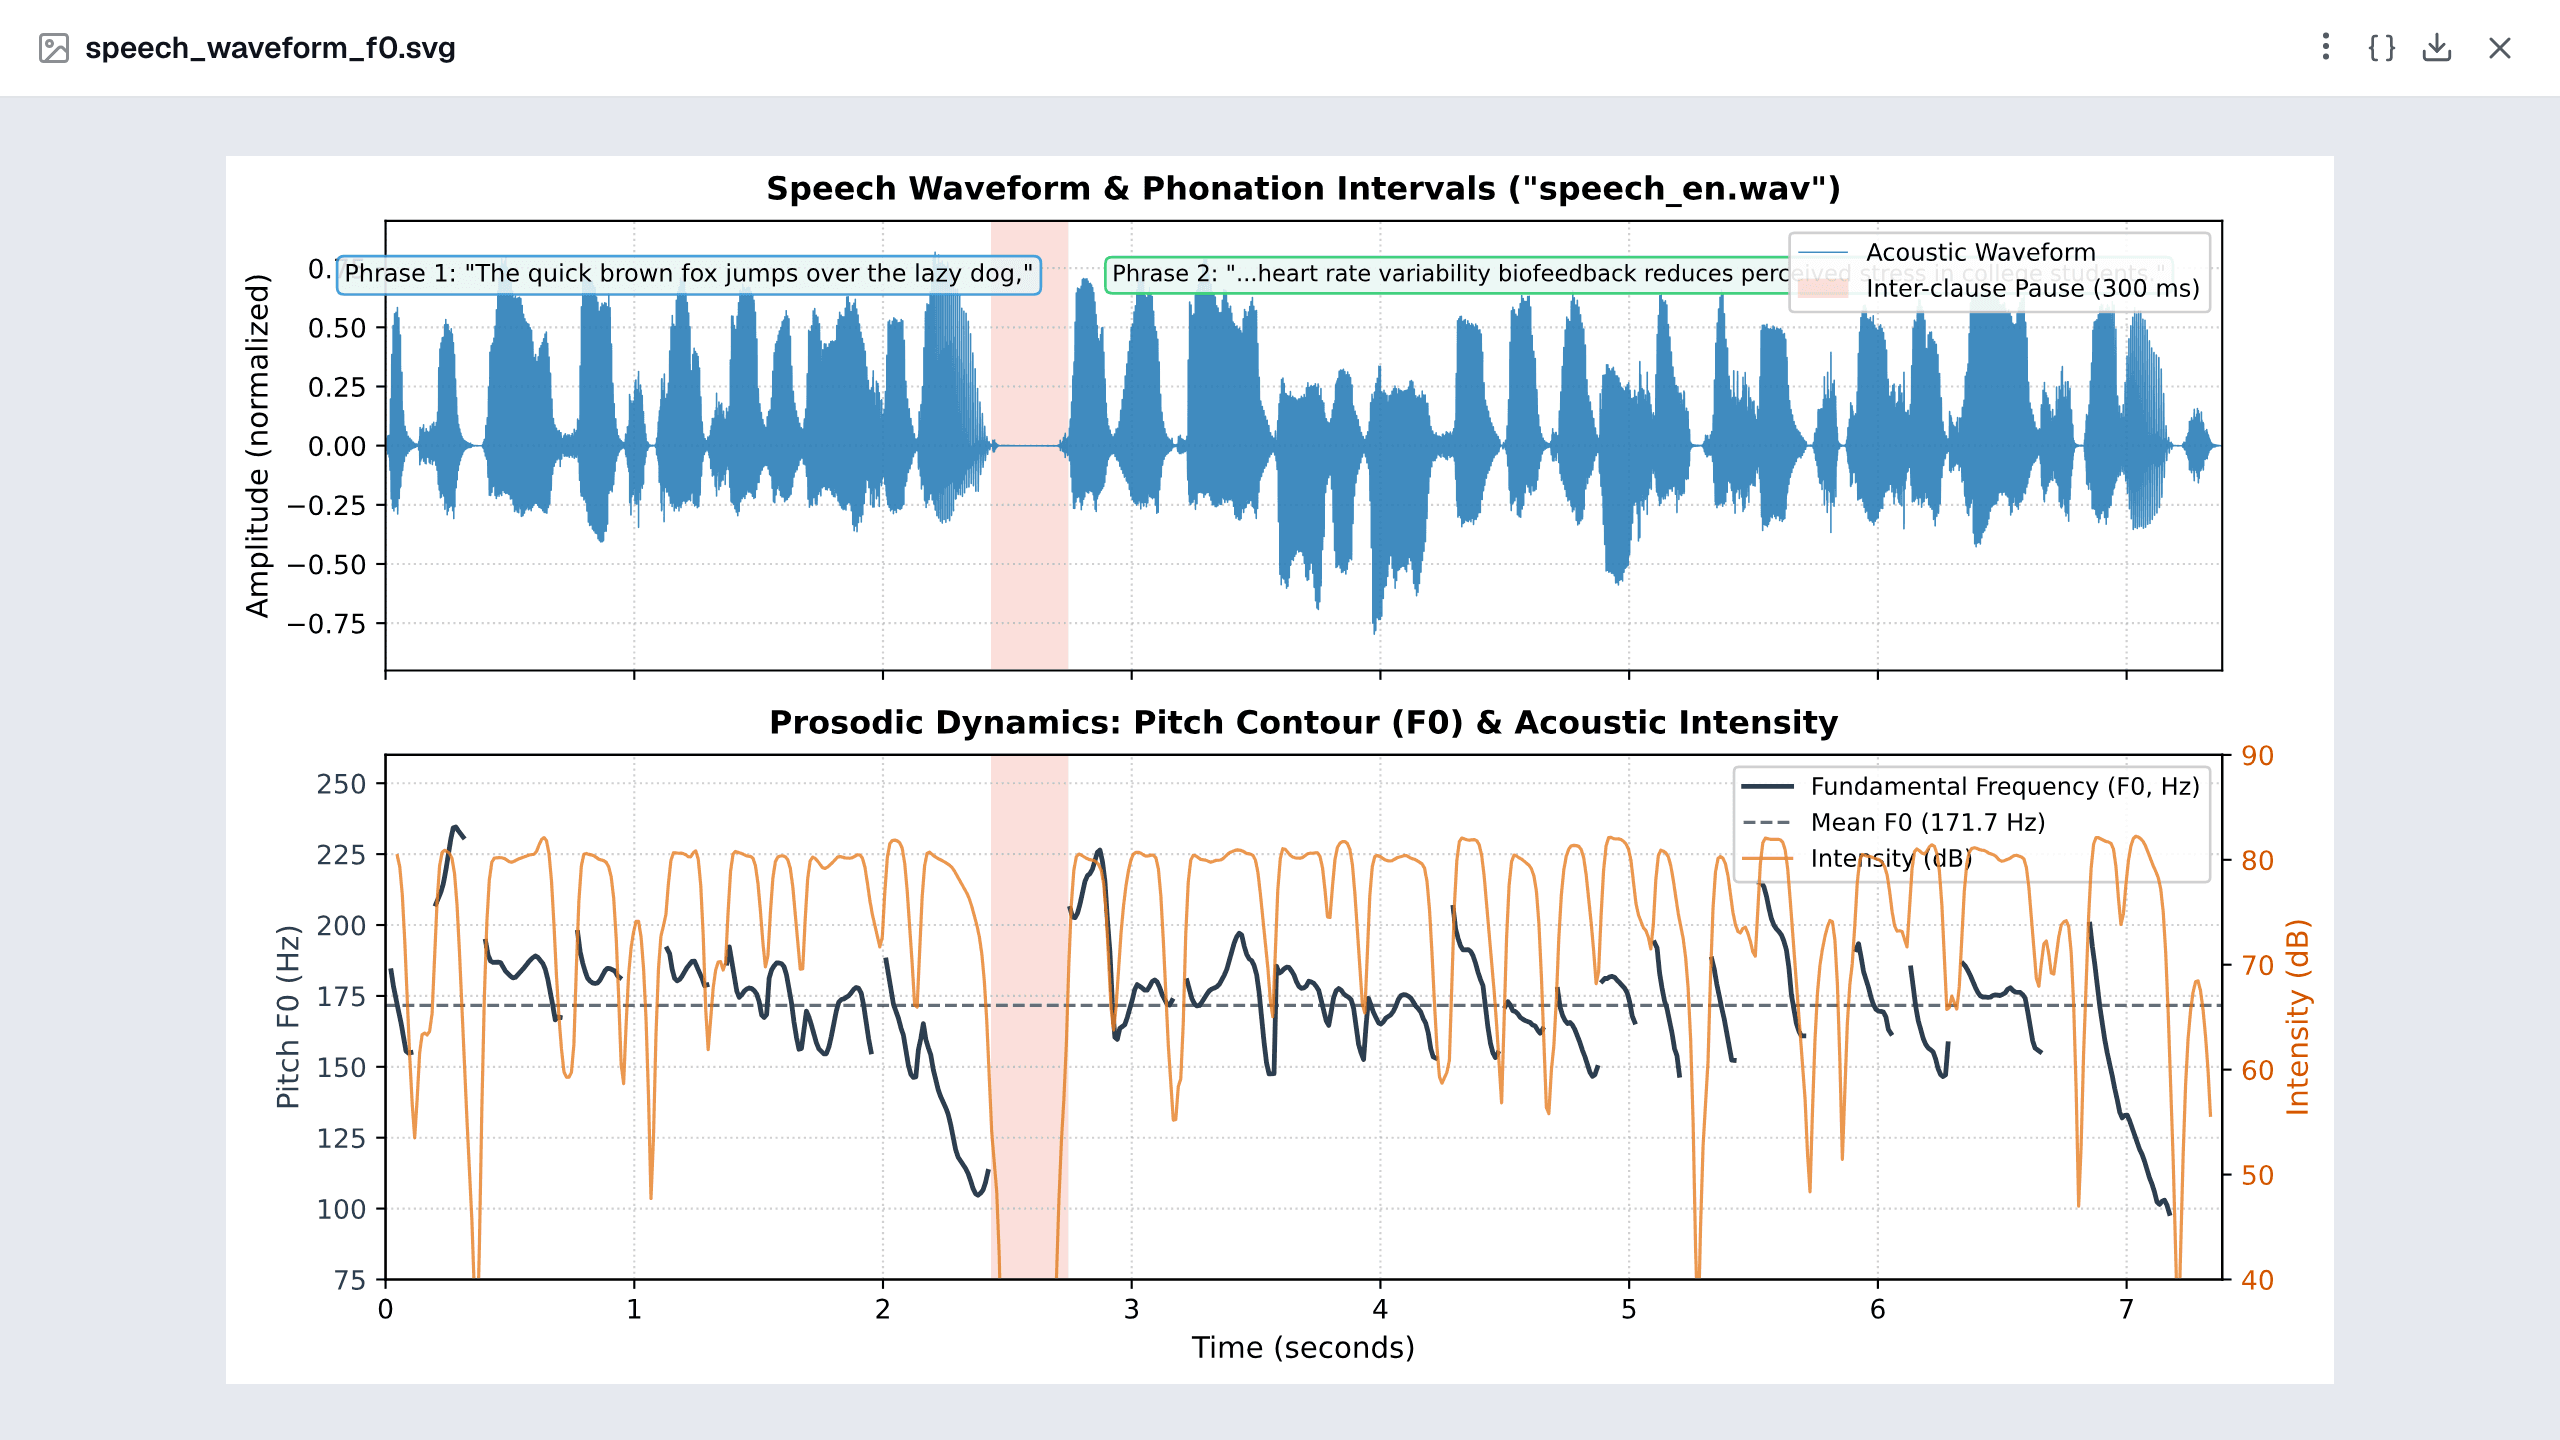
On the English sample clip (a 7.4-second synthetic read-aloud) the tools returned F0 mean 173.7 Hz with a range of 100.8–233.0 Hz, jitter 1.2%, shimmer 6.6%, HNR 16.0 dB and F1–F3 of 676, 1878 and 2996 Hz. Our reference check measured the same clip at 171.7 Hz mean F0 in Praat.
When you ask for a figure, the agent can go further than the default contour. In the example project it drew the waveform with the pause marked, and the F0 contour over the intensity curve:
Typical research uses
Interviews and thematic coding. Transcribe each interview, then have the segments put in a table with a participant column. The text tools work on that table: text_overview (length and top terms), theme_clusters (candidate themes with example quotes, a starting point for open coding), topic_model (LDA or NMF) and sentiment (VADER, English only). Treat the clusters as suggestions. The tool itself says they are candidate themes to check against the raw text.
Think-aloud usability sessions. The segment timestamps let you line up what a participant said with the task timeline. Ask for the segments that fall inside each task window, and combine them with task success or SUS scores from the same study.
Emotional prosody. Compare F0 mean, F0 SD and intensity between conditions (for example neutral versus emotional sentences read by the same speakers). Within-speaker comparisons are much stronger than reading a single clip.
Vocal stress. Jitter, shimmer, HNR and F0 are the usual acoustic correlates studied under stress or cognitive load. Record a baseline for each person and compare the task recording against it. The report will tell you if you ask it to judge a single clip on its own.
From one clip to a study: statistics across participants
A study rarely has one recording. Upload the files for all participants (or one per condition), ask for the same measures on each, and have the per-file results collected into a table with participant and condition columns. From there the statistics tools take over:
compare_groupspicks the test from the design and the data (paired or independent, parametric or not) and explains why in a decision trace.mixedlmhandles repeated measures with participants as random effects, for example several utterances per speaker.
/stats voice_features.csv has one row per recording: participant, condition (baseline / stress), f0_mean, f0_sd, jitter, shimmer, hnr. Compare the conditions within participants, check the assumptions, and report effect sizes.
The statistics walkthrough covers how the test is chosen.
Every sentence traceable
The analysis report is written from the tool outputs, and its sentences carry [n] citations. Each number points to the analysis step (media_info, transcribe_audio, voice, acoustic_features) or data file behind it. In the chat you see a notice such as "Added [n] citations to 31 sentence(s) of the analysis report". At the end of the report, the References list shows each step with its arguments and the start of its raw output.
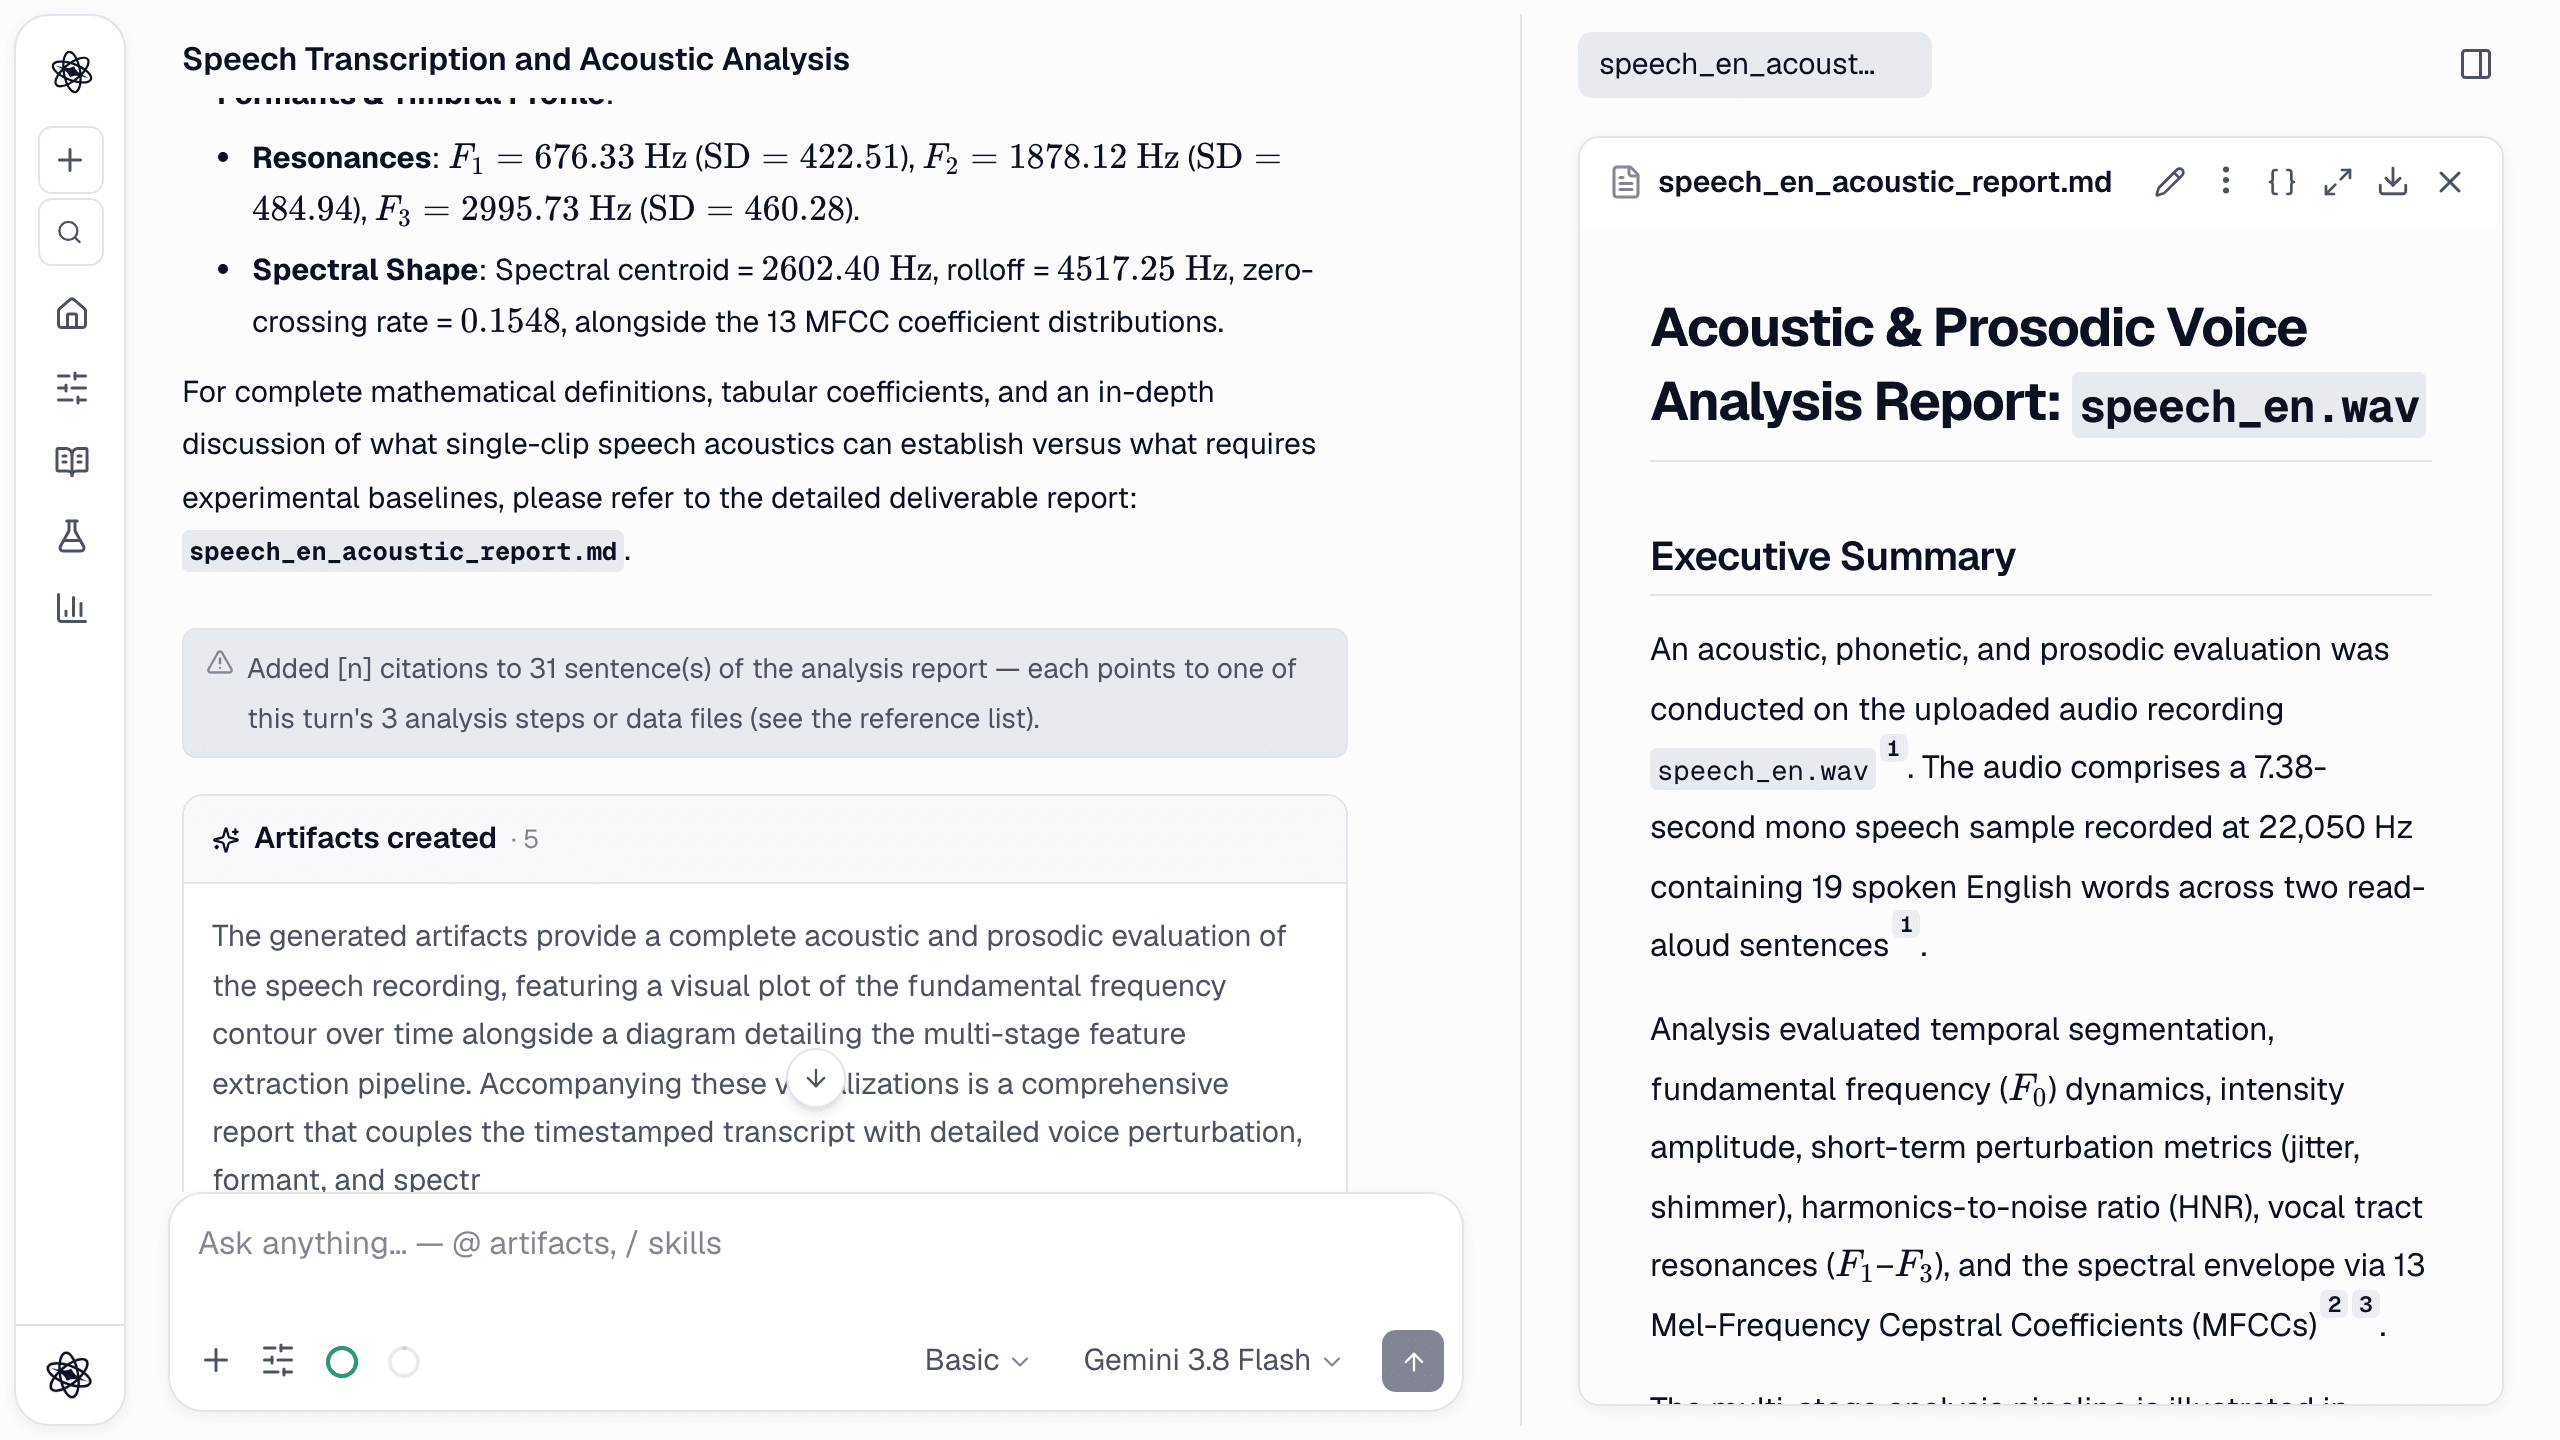
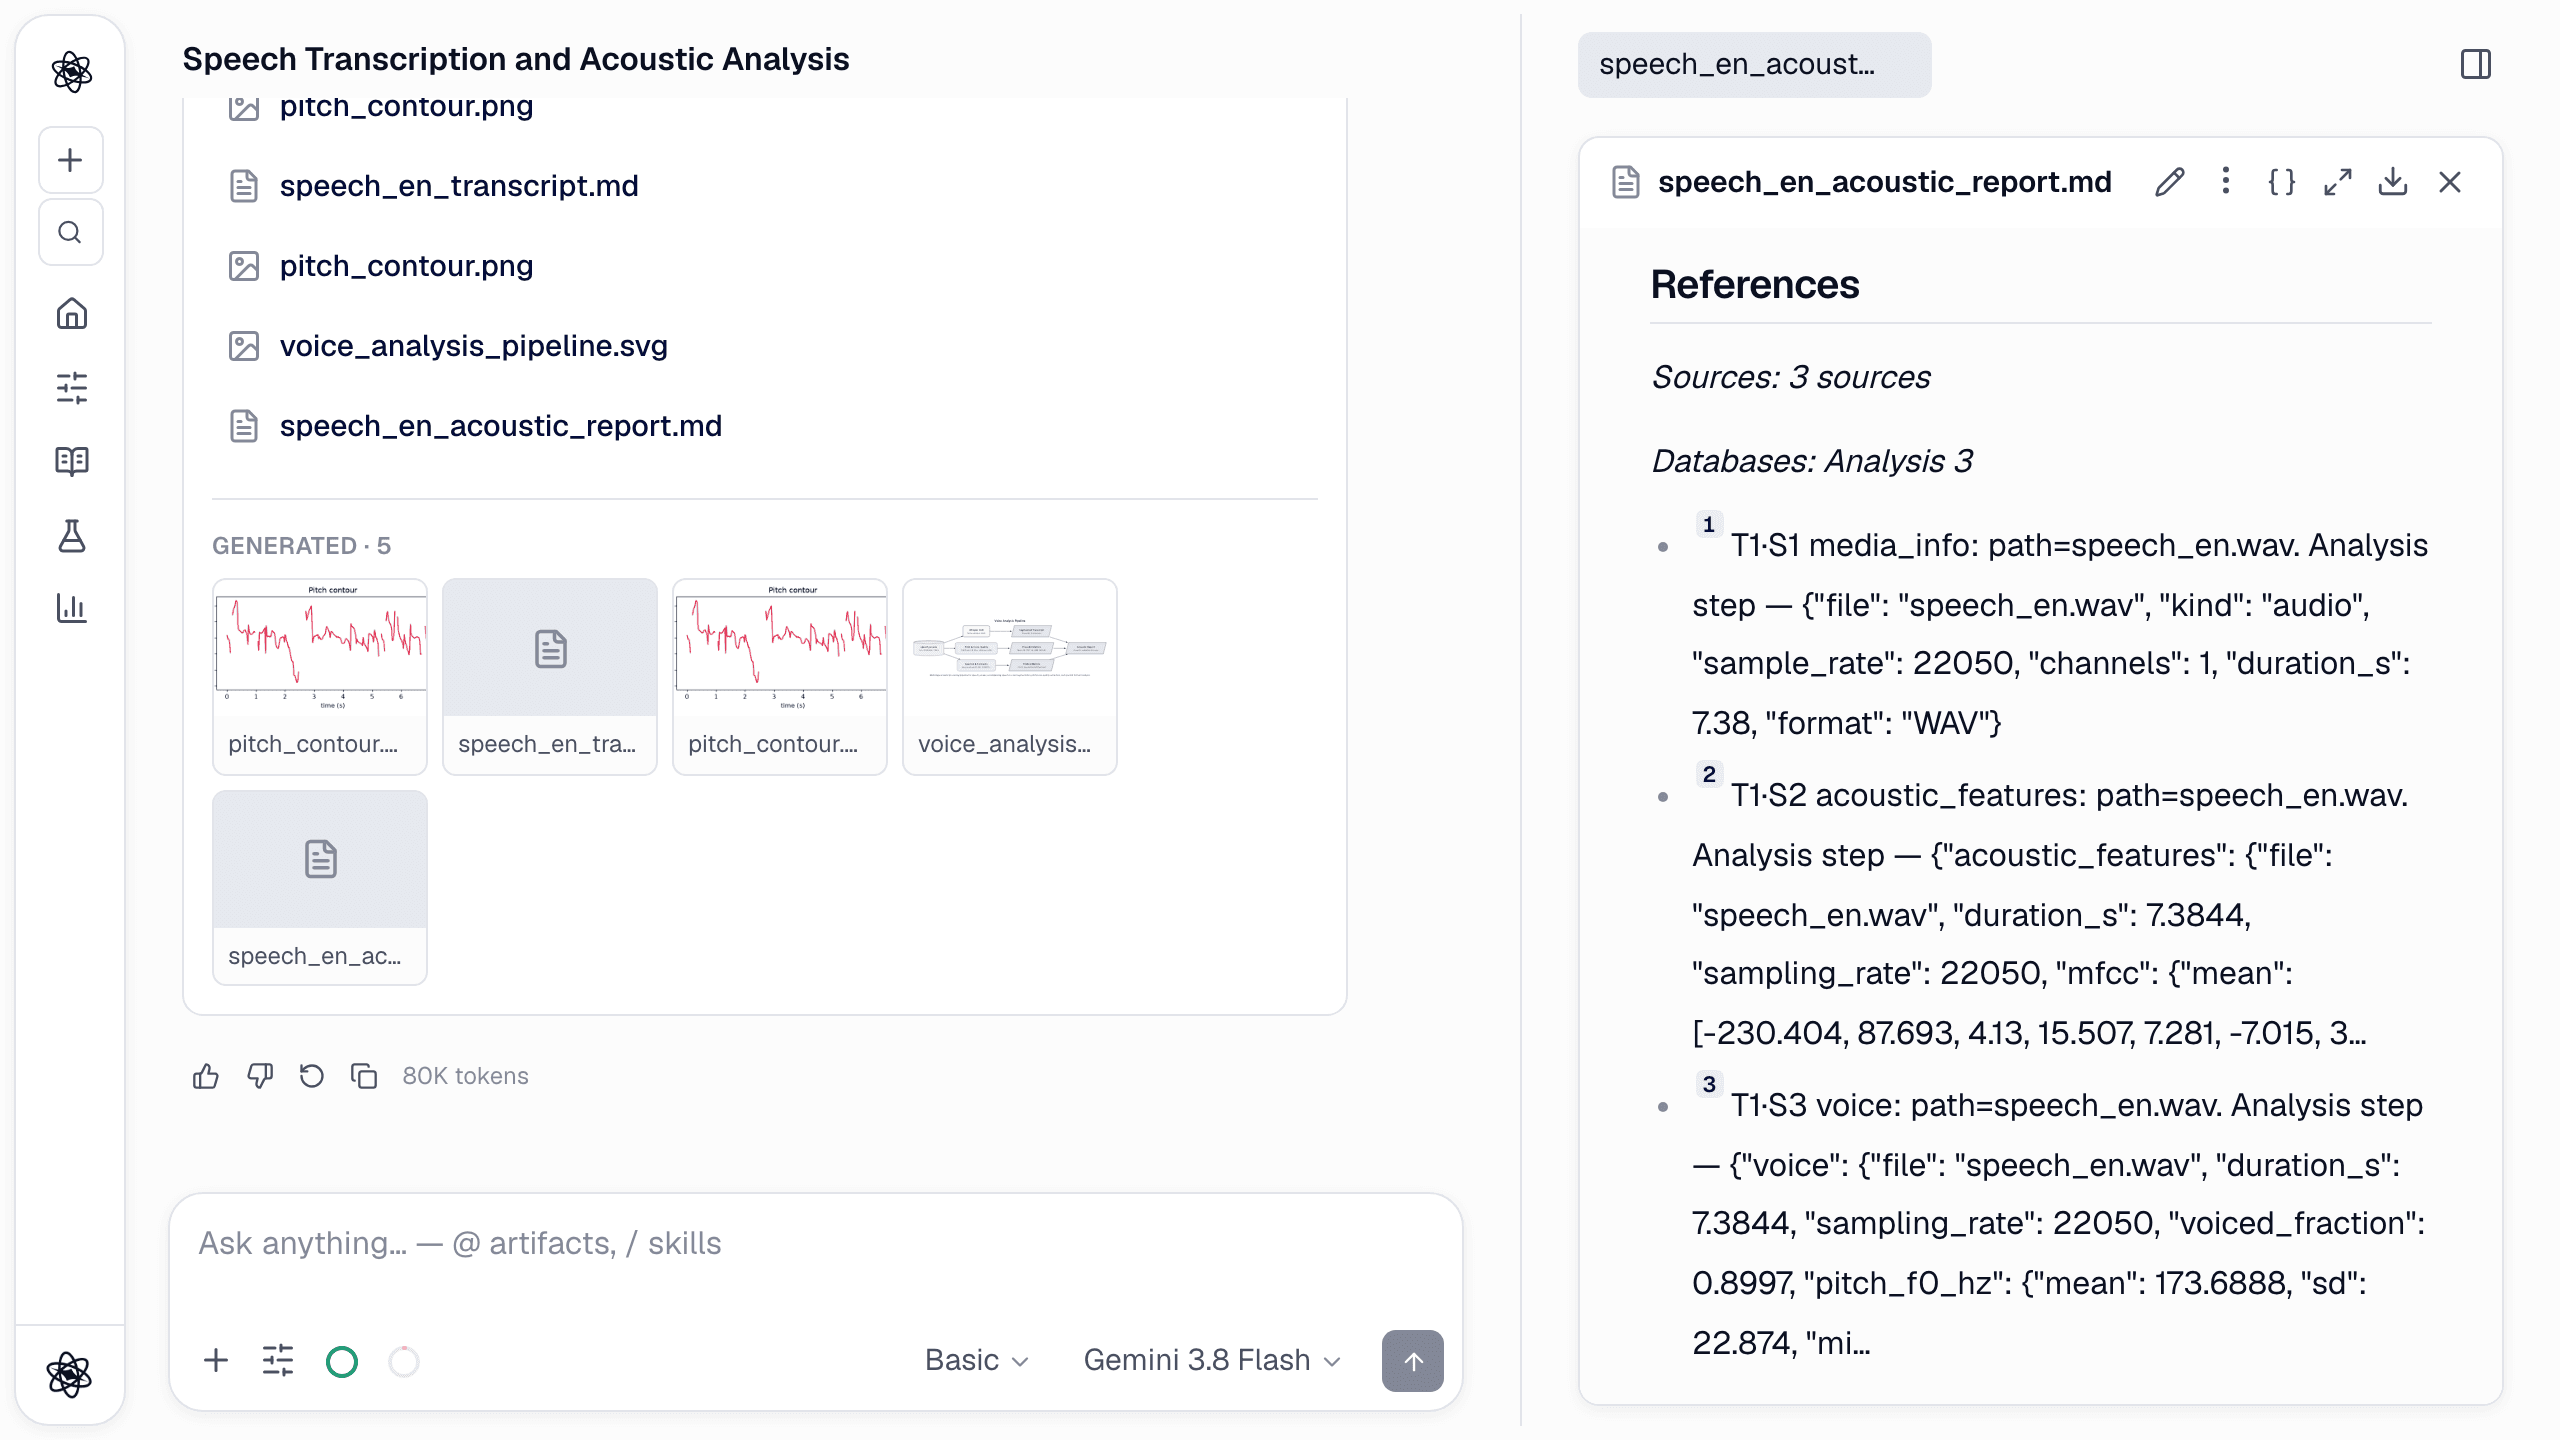
Each tool call also records its name and arguments (for the transcript: file, model size and language), and figures keep the code that produced them (press { } in the artifact panel). If someone asks how the pitch or the transcript was produced, the answer is in the session. More in Every sentence cited and Reproducibility by default.
Privacy
Recordings of people are personal data, and sometimes sensitive data. What the privacy policy says:
- In the web app, uploads and the artifacts made from them are stored in your private account workspace and processed on Neutropic's servers to run the analysis.
- Transcription runs on those servers with faster-whisper. The audio file is not sent to a third-party speech service.
- The AI model you selected sees what it needs to answer, such as your prompt, tool results and relevant excerpts. That includes the transcript text. Providers process it under agreements that prohibit training on it.
- Your content is never used to train models, and you can delete it at any time.
- You are responsible for having consent and ethics approval for the recordings you upload. Removing names and other identifiers from recordings and transcripts before upload is good practice.
Honest limits
- Transcripts contain errors. Whisper is good but not perfect, and small models on non-English speech make more mistakes. Our Korean, Chinese and Japanese sample clips, even with the
smallmodel, came back with mis-hearings: 게으른 heard as 개울은, 敏捷的 as 民间的, 心拍変動 as 新博変動. Proofread every transcript against the audio before you code or quote it. Timestamps can also drift at the end of a clip. - No speaker diarisation. Neutropic does not separate speakers. An interview comes back as one stream of segments without "Interviewer" or "Participant" labels, and the voice measures cover everyone on the recording. Record speakers on separate channels or cut the file per speaker if you need per-person voice measures.
- Features, not emotions. No tool labels a recording as happy, stressed or depressed. Interpreting prosody needs a baseline and a design.
- Not a clinical assessment. Jitter, shimmer and HNR from connected speech are not a voice-disorder evaluation, which uses sustained vowels under calibrated conditions.
- Uncalibrated intensity. Loudness depends on microphone distance and gain, so compare intensity within a recording setup, not across setups.
- Reference ranges come from the model. When a report compares your values with typical ranges (as in the table above), those ranges are the model's general knowledge, not a tool output. Check them against the literature you will cite.
- Whole-clip summaries. The voice tools summarise the full file. For per-segment measures, cut the audio into segments or ask for code that does it, and check the output.
Start with the example project (Example · Skills by domain, the speech session) or attach your own recording and describe it. The data analysis docs and the upload formats list the options.