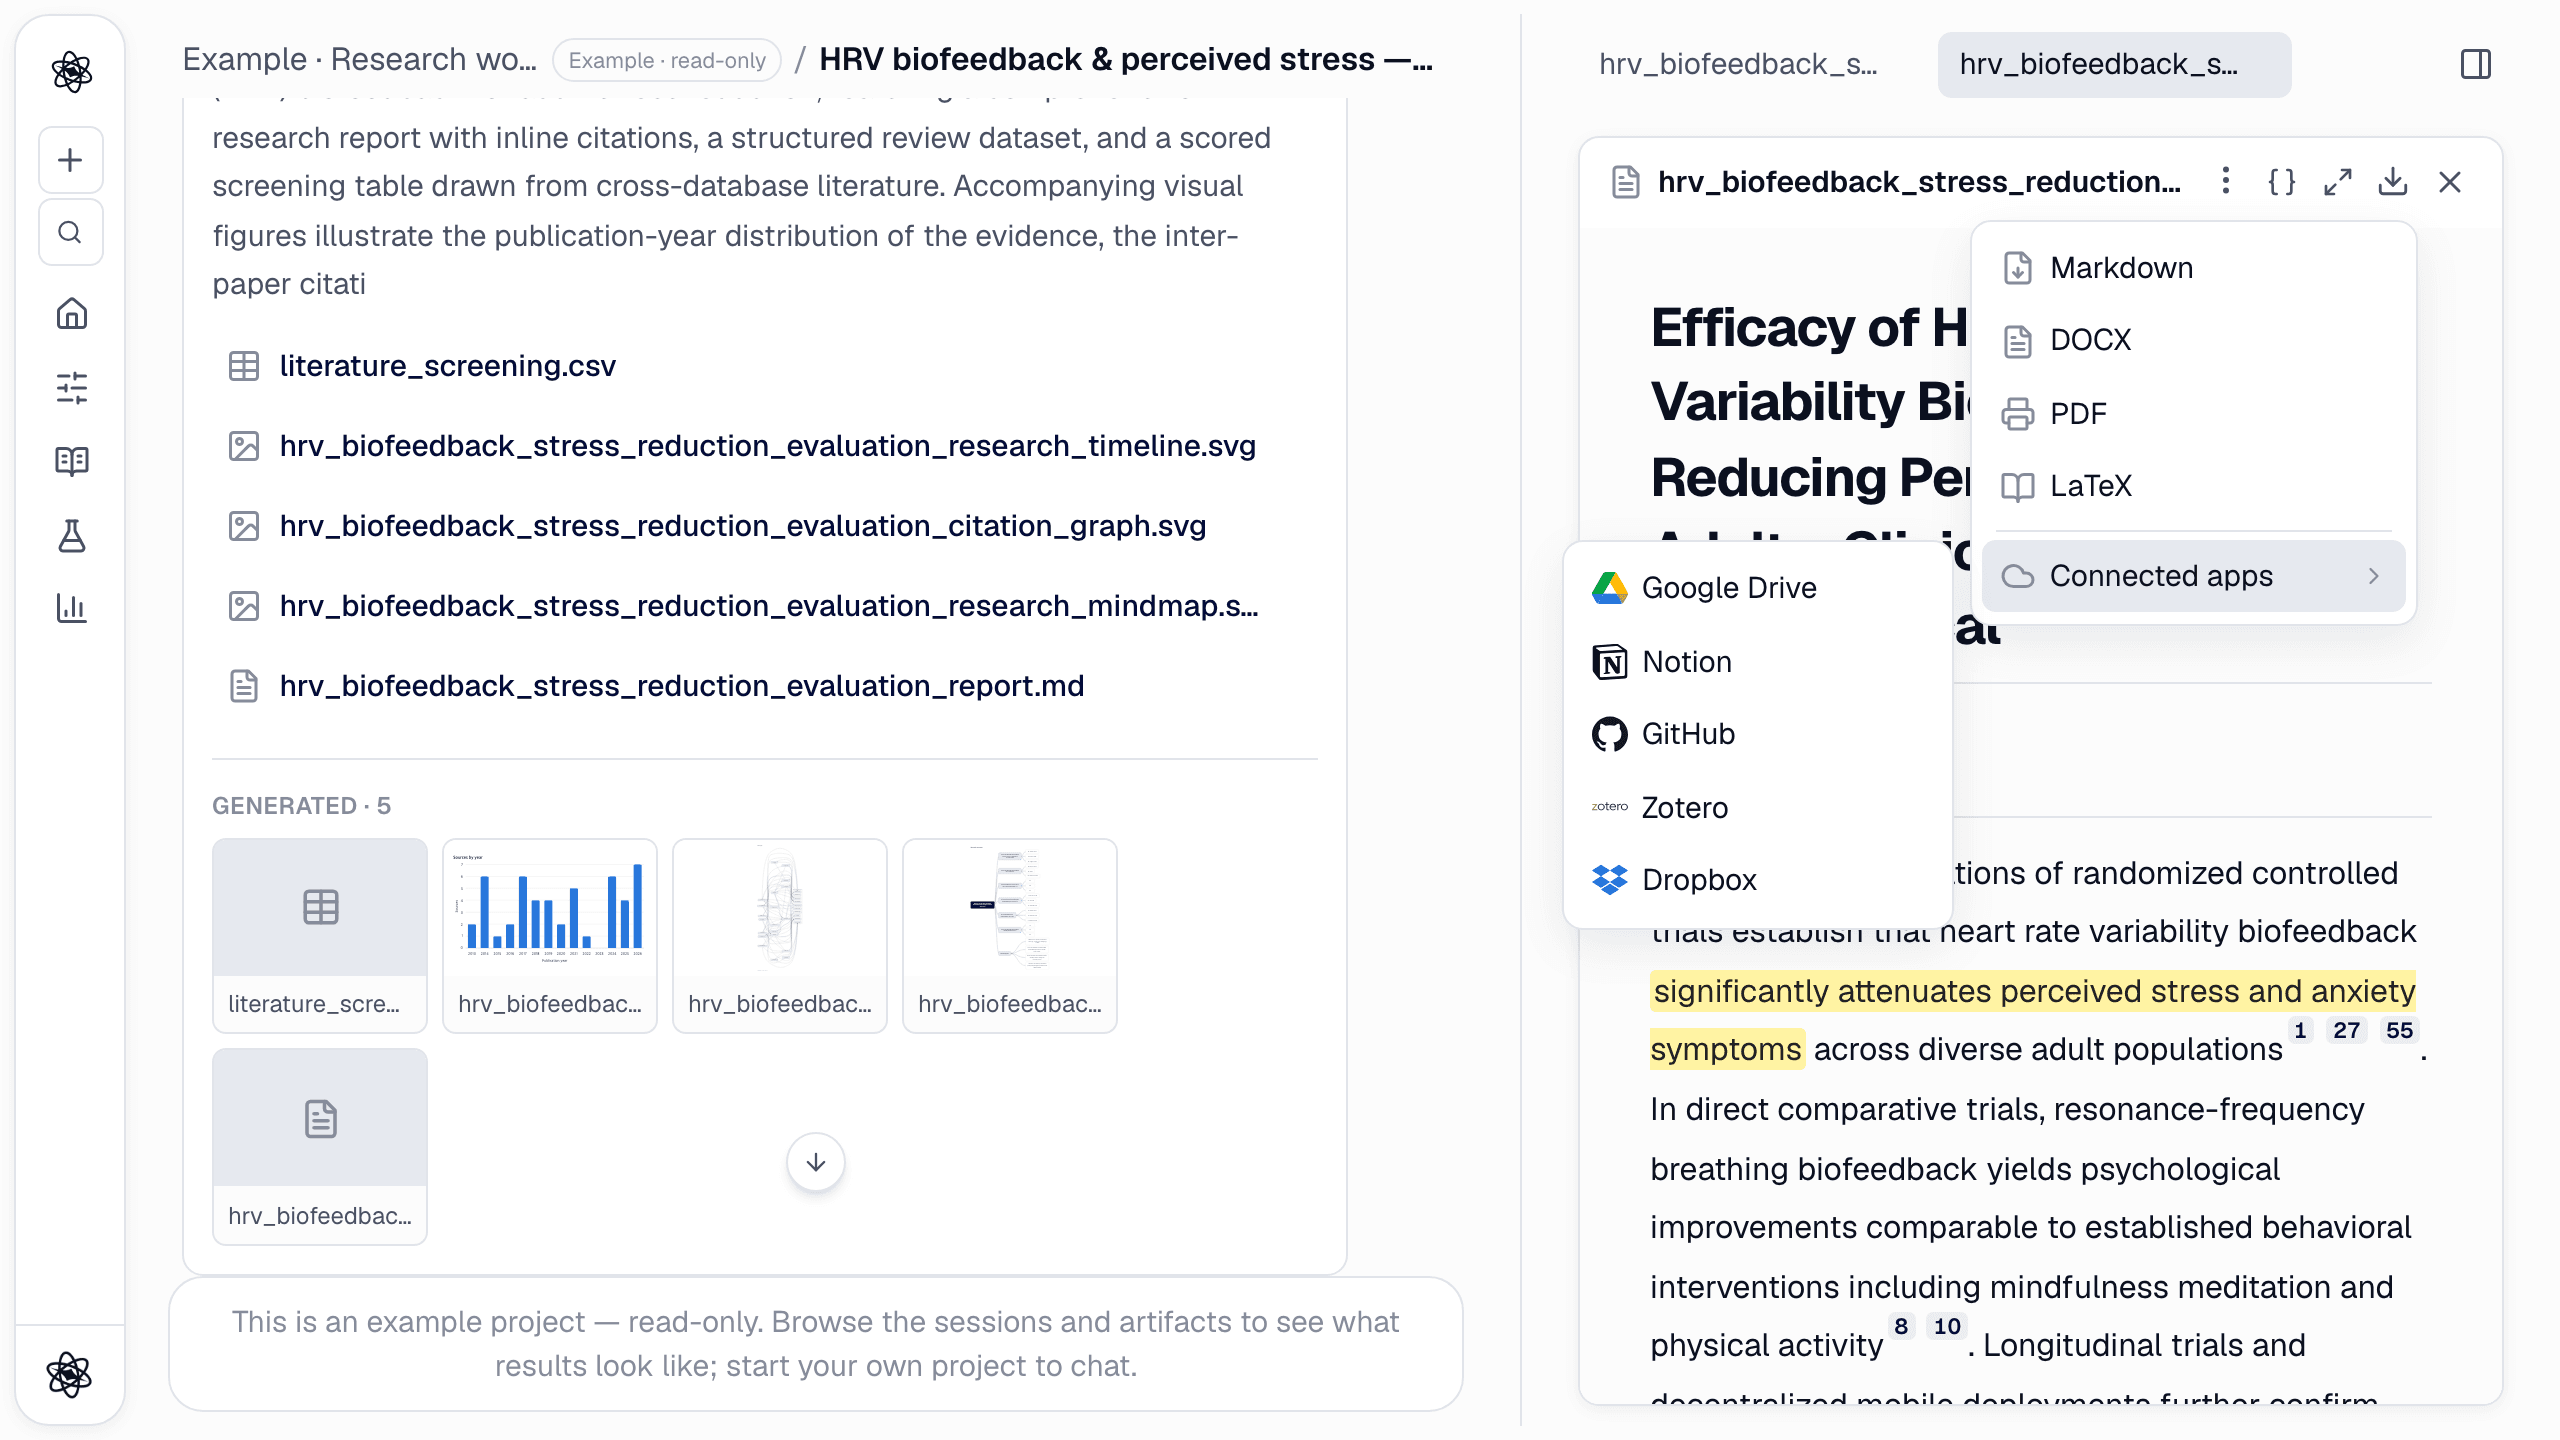
Most human-subjects data never starts life as a tidy spreadsheet. It starts as an EEG recording, a folder of interview audio, a webcam video of a participant, or a CSV of heartbeats. The usual route from there to a result runs through four tools and a lot of glue code: MNE for the EEG, Praat for the voice, a face-tracking library for the video, then R or SPSS for the statistics. Every hand-off is a chance to lose track of a filter setting or a file version.
Neutropic analyses these signals directly, in the same workspace where you plan the study and write it up. Under the hood the measurements come from deterministic tools, not from the language model guessing numbers. The screenshots below come from the example project every account can open (Example · Skills by domain), run on sample recordings with known ground truth.
EEG: seven tools, from raw channels to components
Upload the recording as a table (CSV or XLSX). The convention is simple:
- Every numeric column is a channel, in µV. Name channels by the 10–20 system (Fp1, Fz, Cz, Pz, O1 …) and you also get topographic maps and asymmetry indices.
- A
time_scolumn lets the sampling rate be inferred. If you don't have one, state the rate in your message. - An optional
markercolumn carries events: 0 for none, a positive integer for the condition code.
The data-analysis skill then chains the EEG tools. It picks the ones your question needs and shows each step in the chat:
- eeg_info reports channels, sampling rate, events and line noise.
- eeg_preprocess runs an automatic 50/60 Hz notch and a 1–40 Hz band-pass, with optional average re-reference. FastICA removes blinks, bad segments are flagged, and a cleaned CSV is written for the next steps.
- eeg_bandpower gives Welch band power per channel, individual alpha peak, theta/beta ratio and hemispheric asymmetry.
- eeg_topomap draws the scalp distribution of each band.
- eeg_erp handles epochs, baseline, rejection and condition averages, plus N1/P2/N2/P3 latency and amplitude, difference waves and SNR.
- eeg_erders computes task-related power change in %, the ERD minimum and ERS maximum, and C3/C4 lateralisation.
- eeg_ssvep detects the stimulation frequency with CCA ρ and PSD SNR for every candidate frequency, not only the winner.
/analyze eeg_oddball_erp_250hz.csv is an auditory oddball recording (250 Hz; Fz, Cz, Pz, Oz; marker 1 = standard, 2 = target). Epoch around the markers, average per condition, and report N1 and P3 latency and amplitude per channel with the target-minus-standard difference wave and figures.
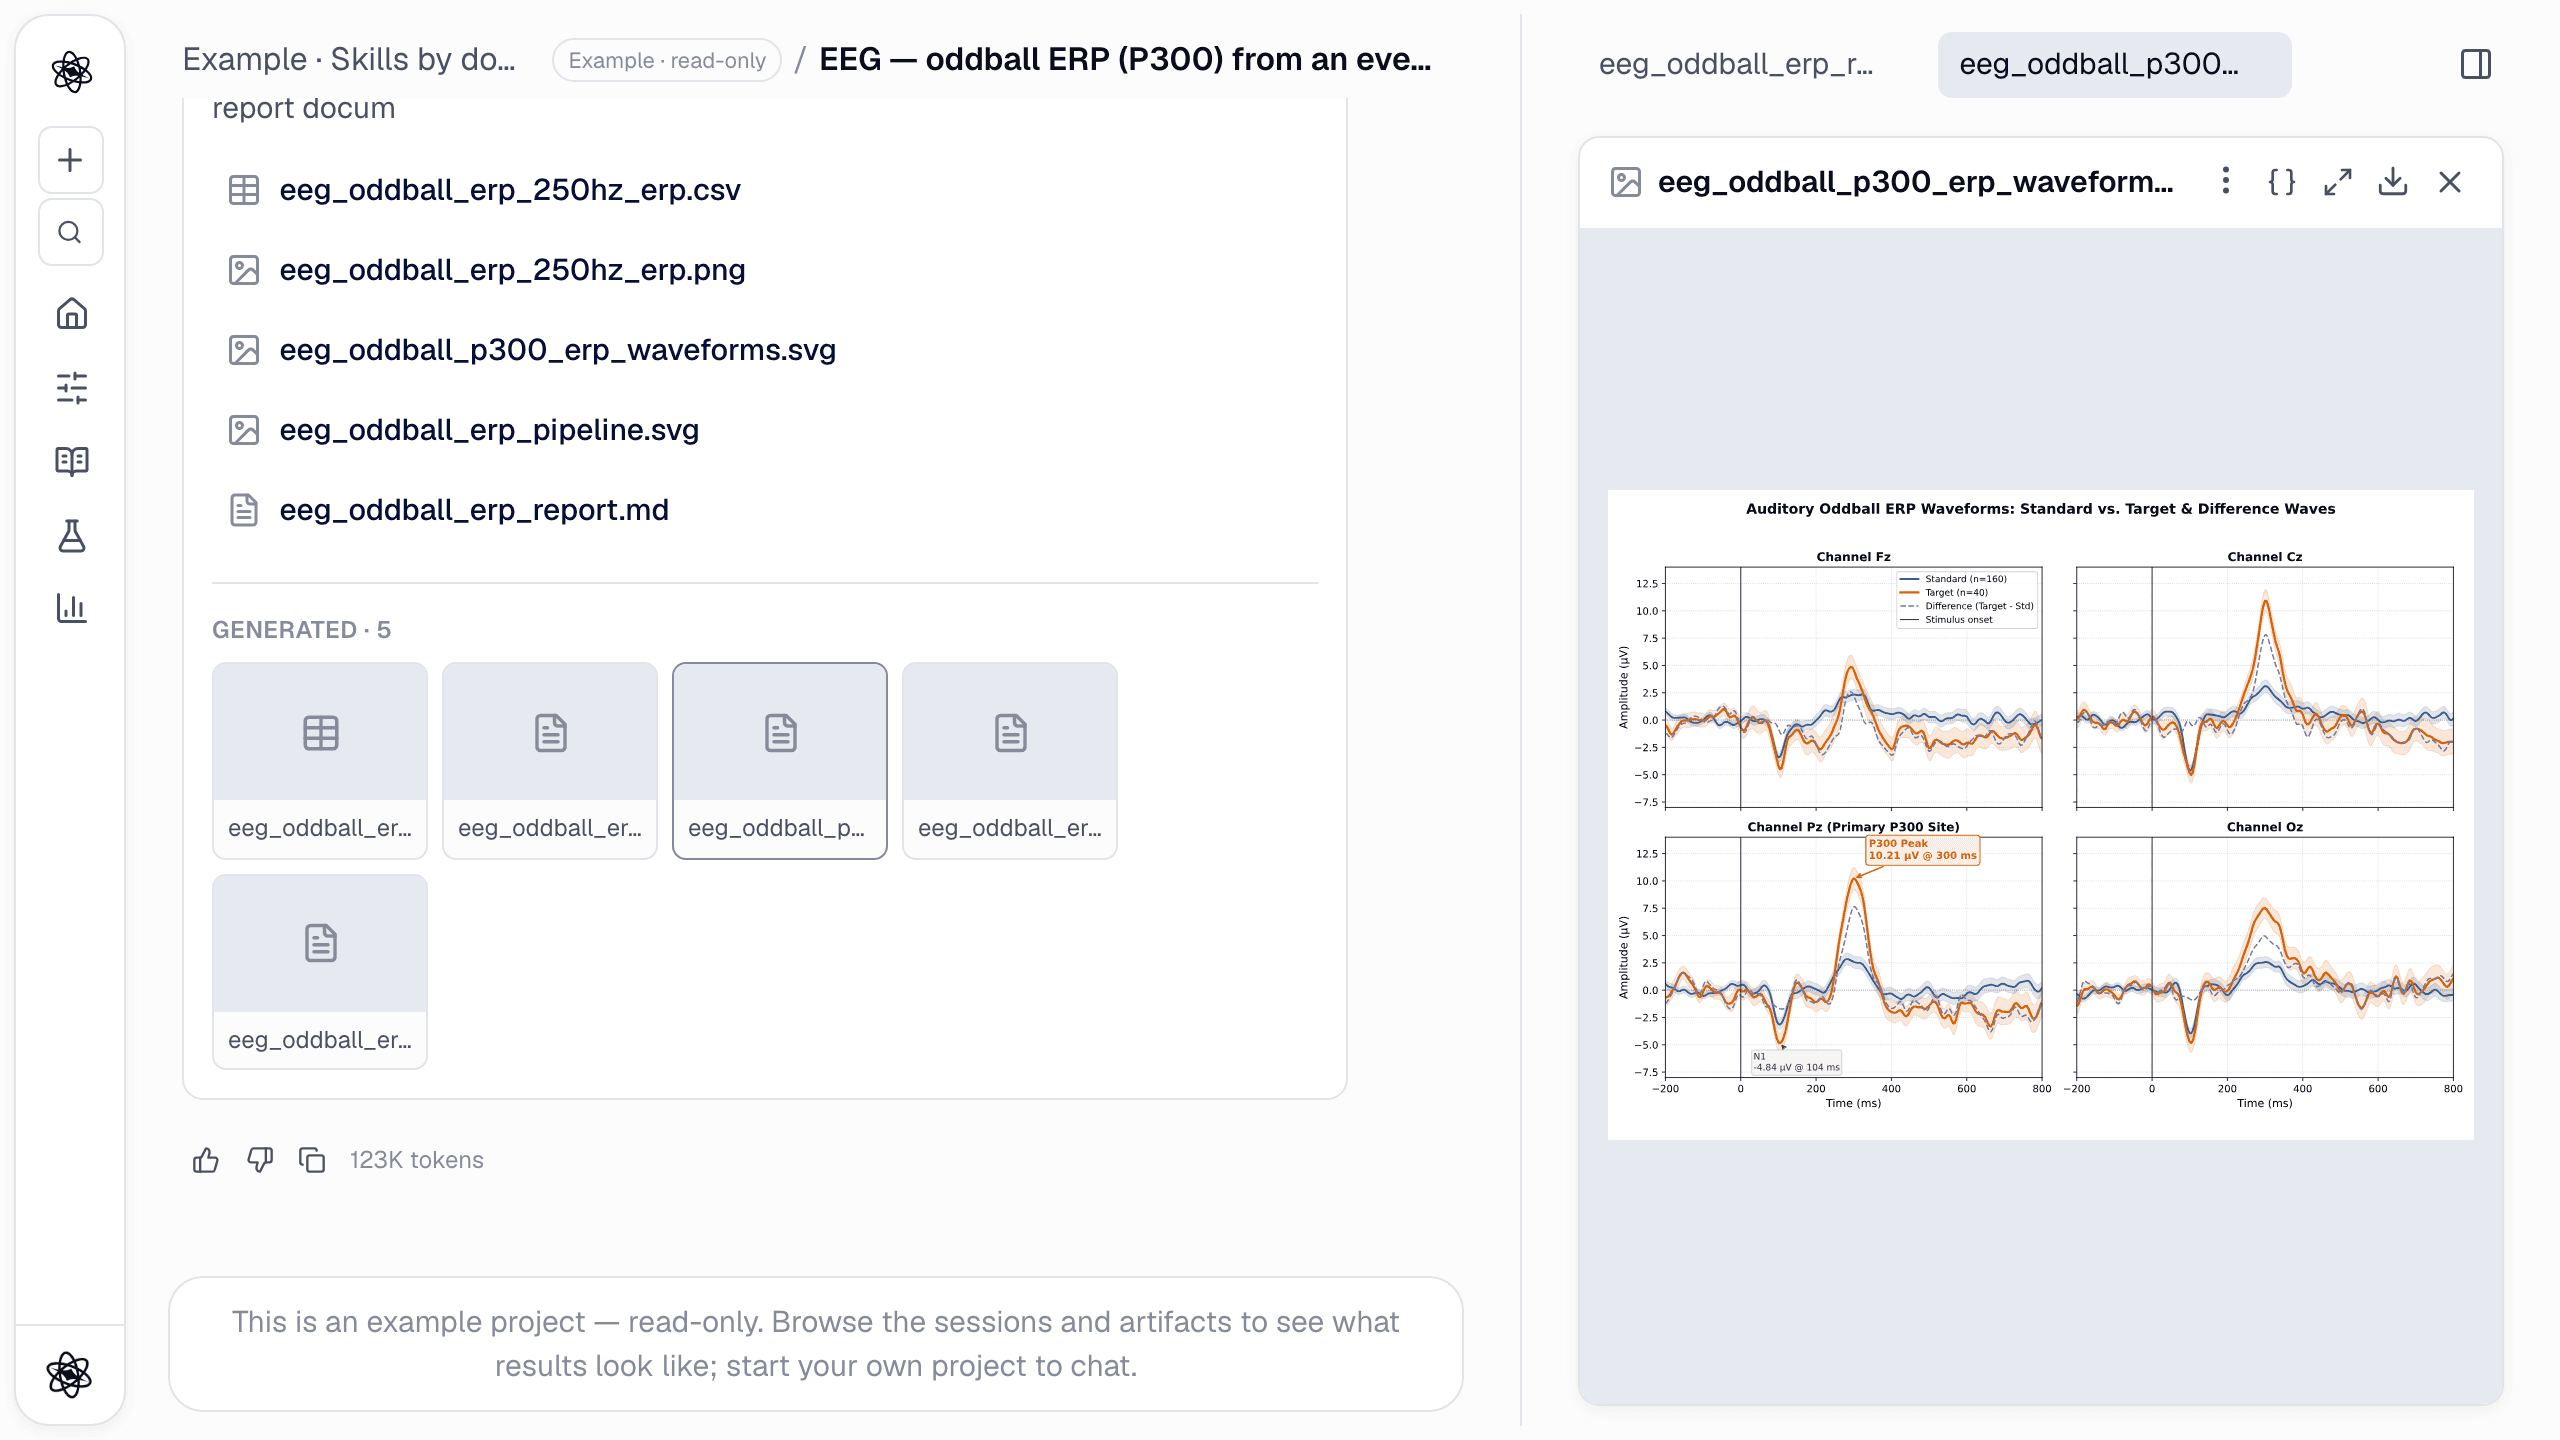
For a resting recording the same request pattern leads to preprocessing, band power and topography. Preprocessing reports what it removed, so the cleaning is something you can check:
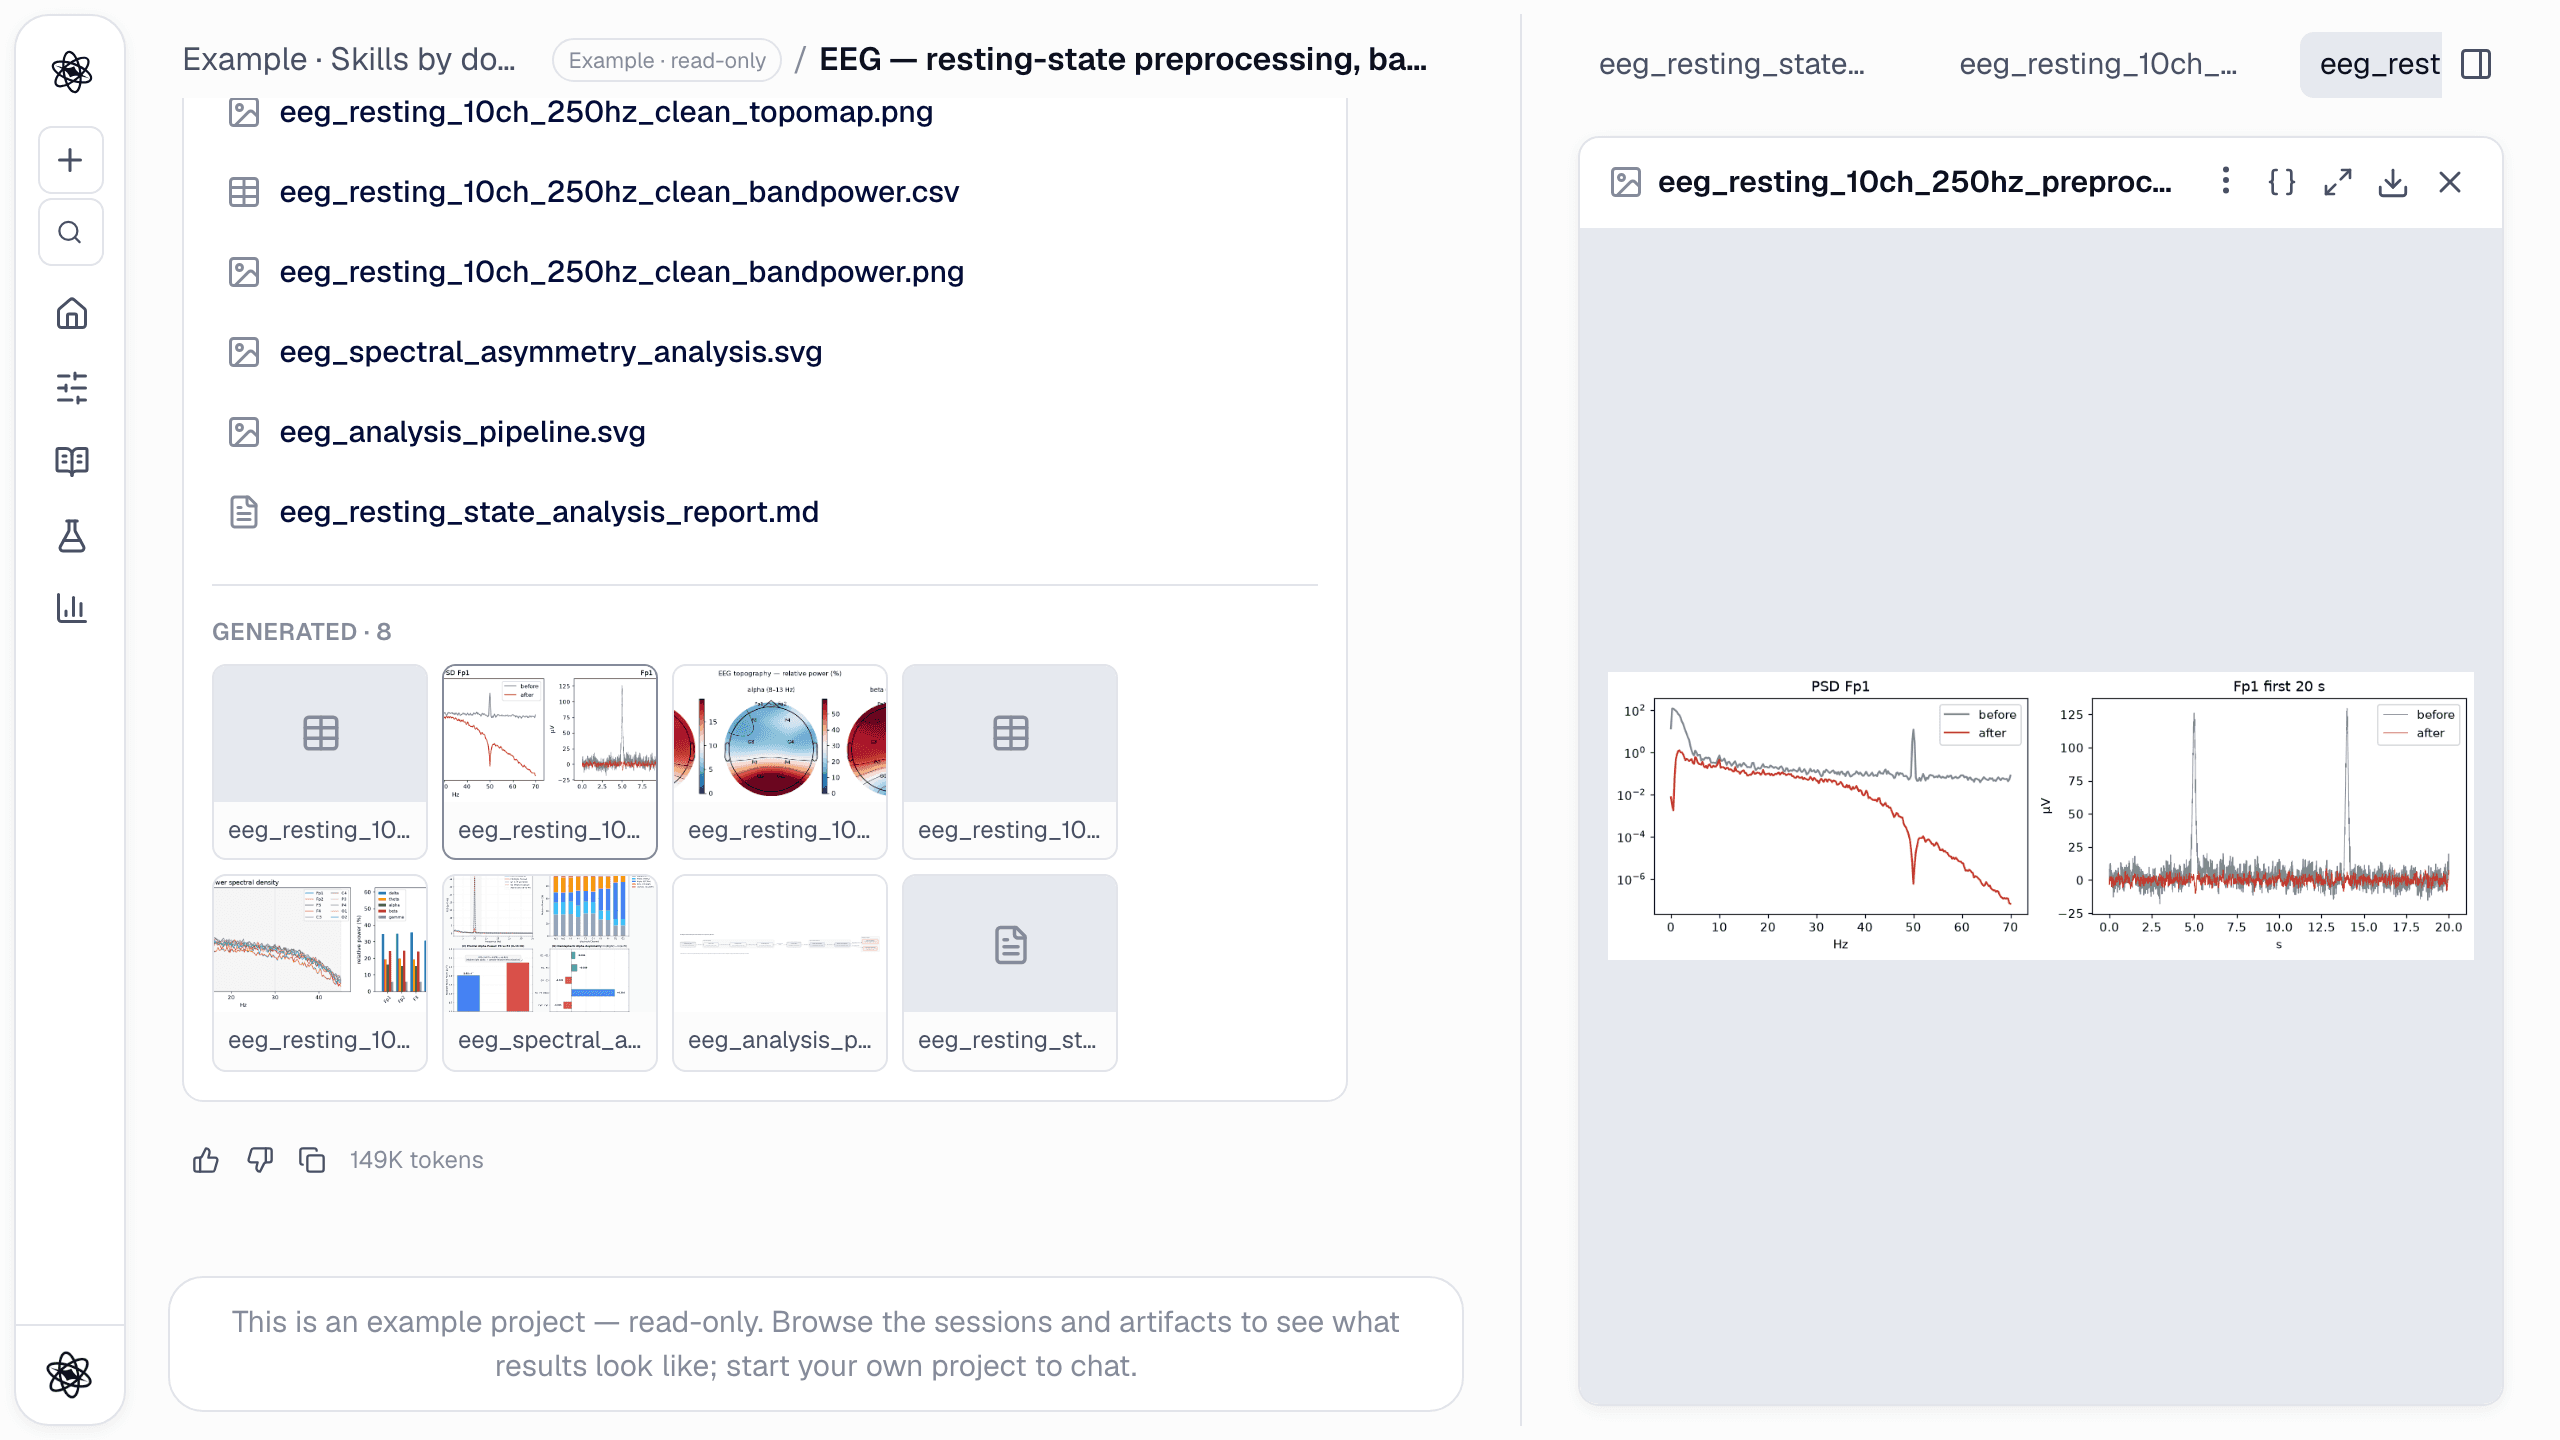
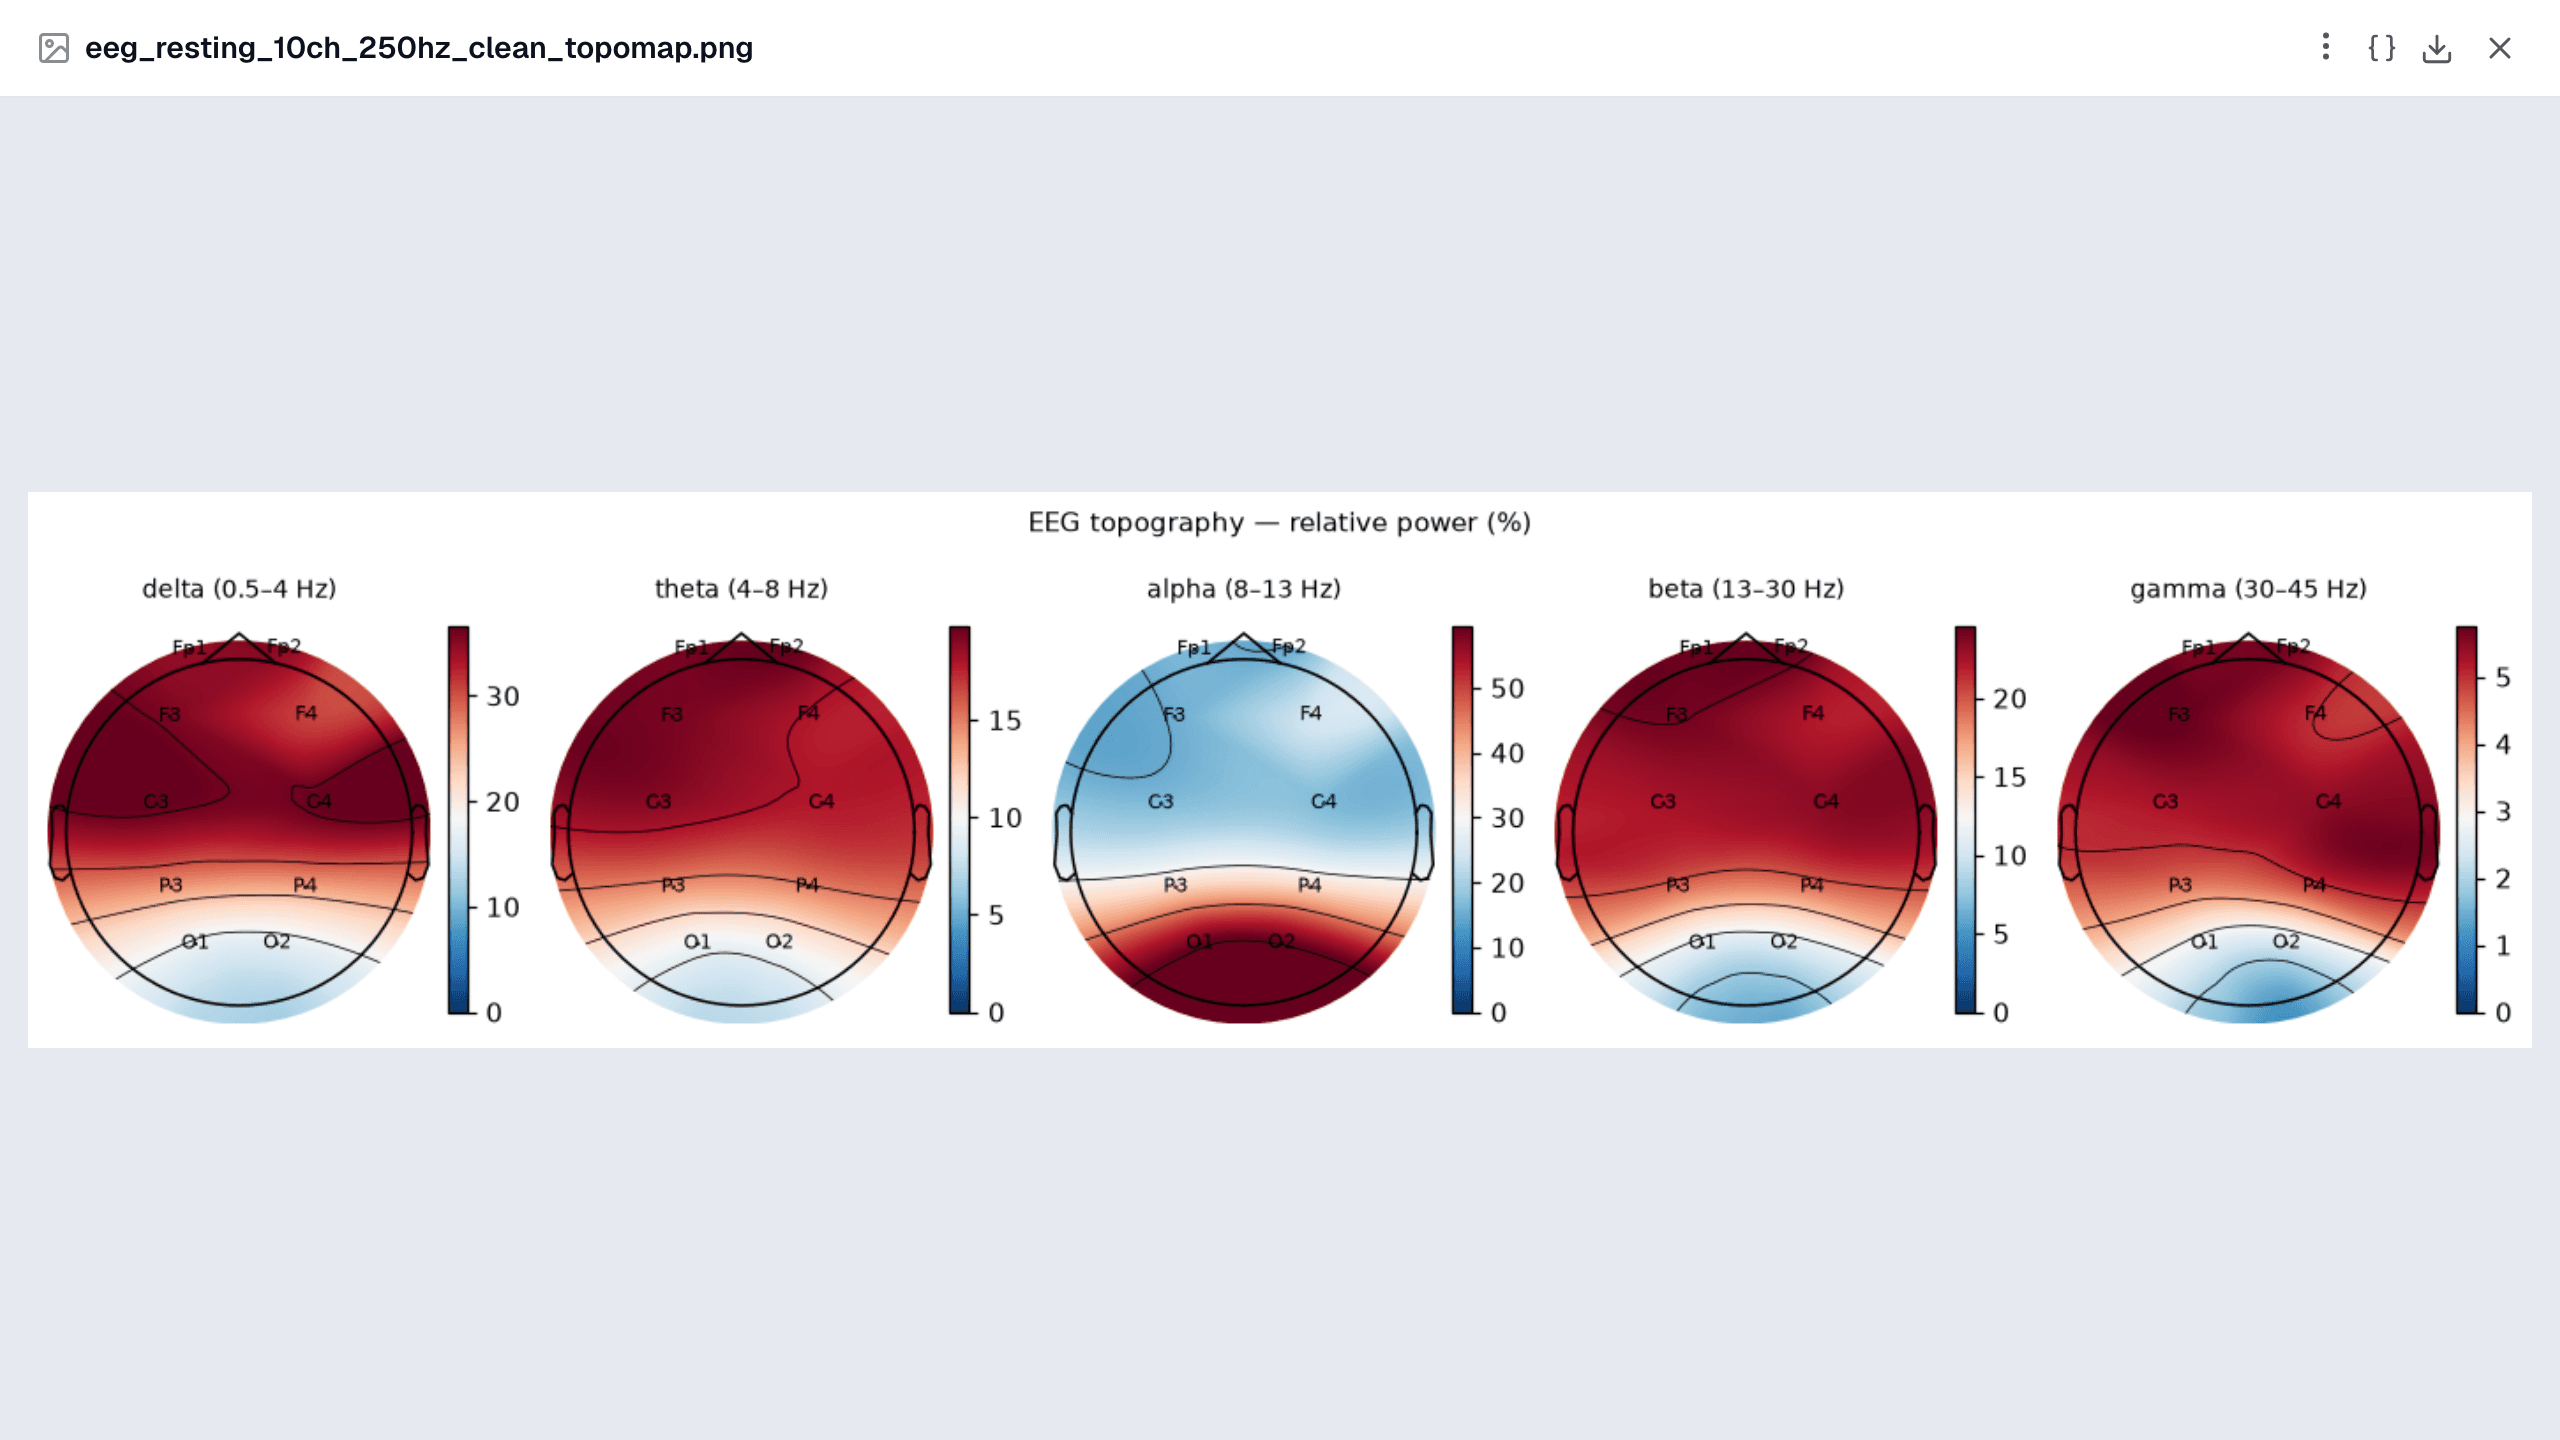
A note on frontal alpha asymmetry: the value depends on the reference. The agent names the reference next to every asymmetry value, and it will not read a personality trait out of a single resting recording.
Audio: transcripts and voice features, locally
Upload WAV, MP3, M4A, FLAC, OGG or AAC (or a video with a speech track).
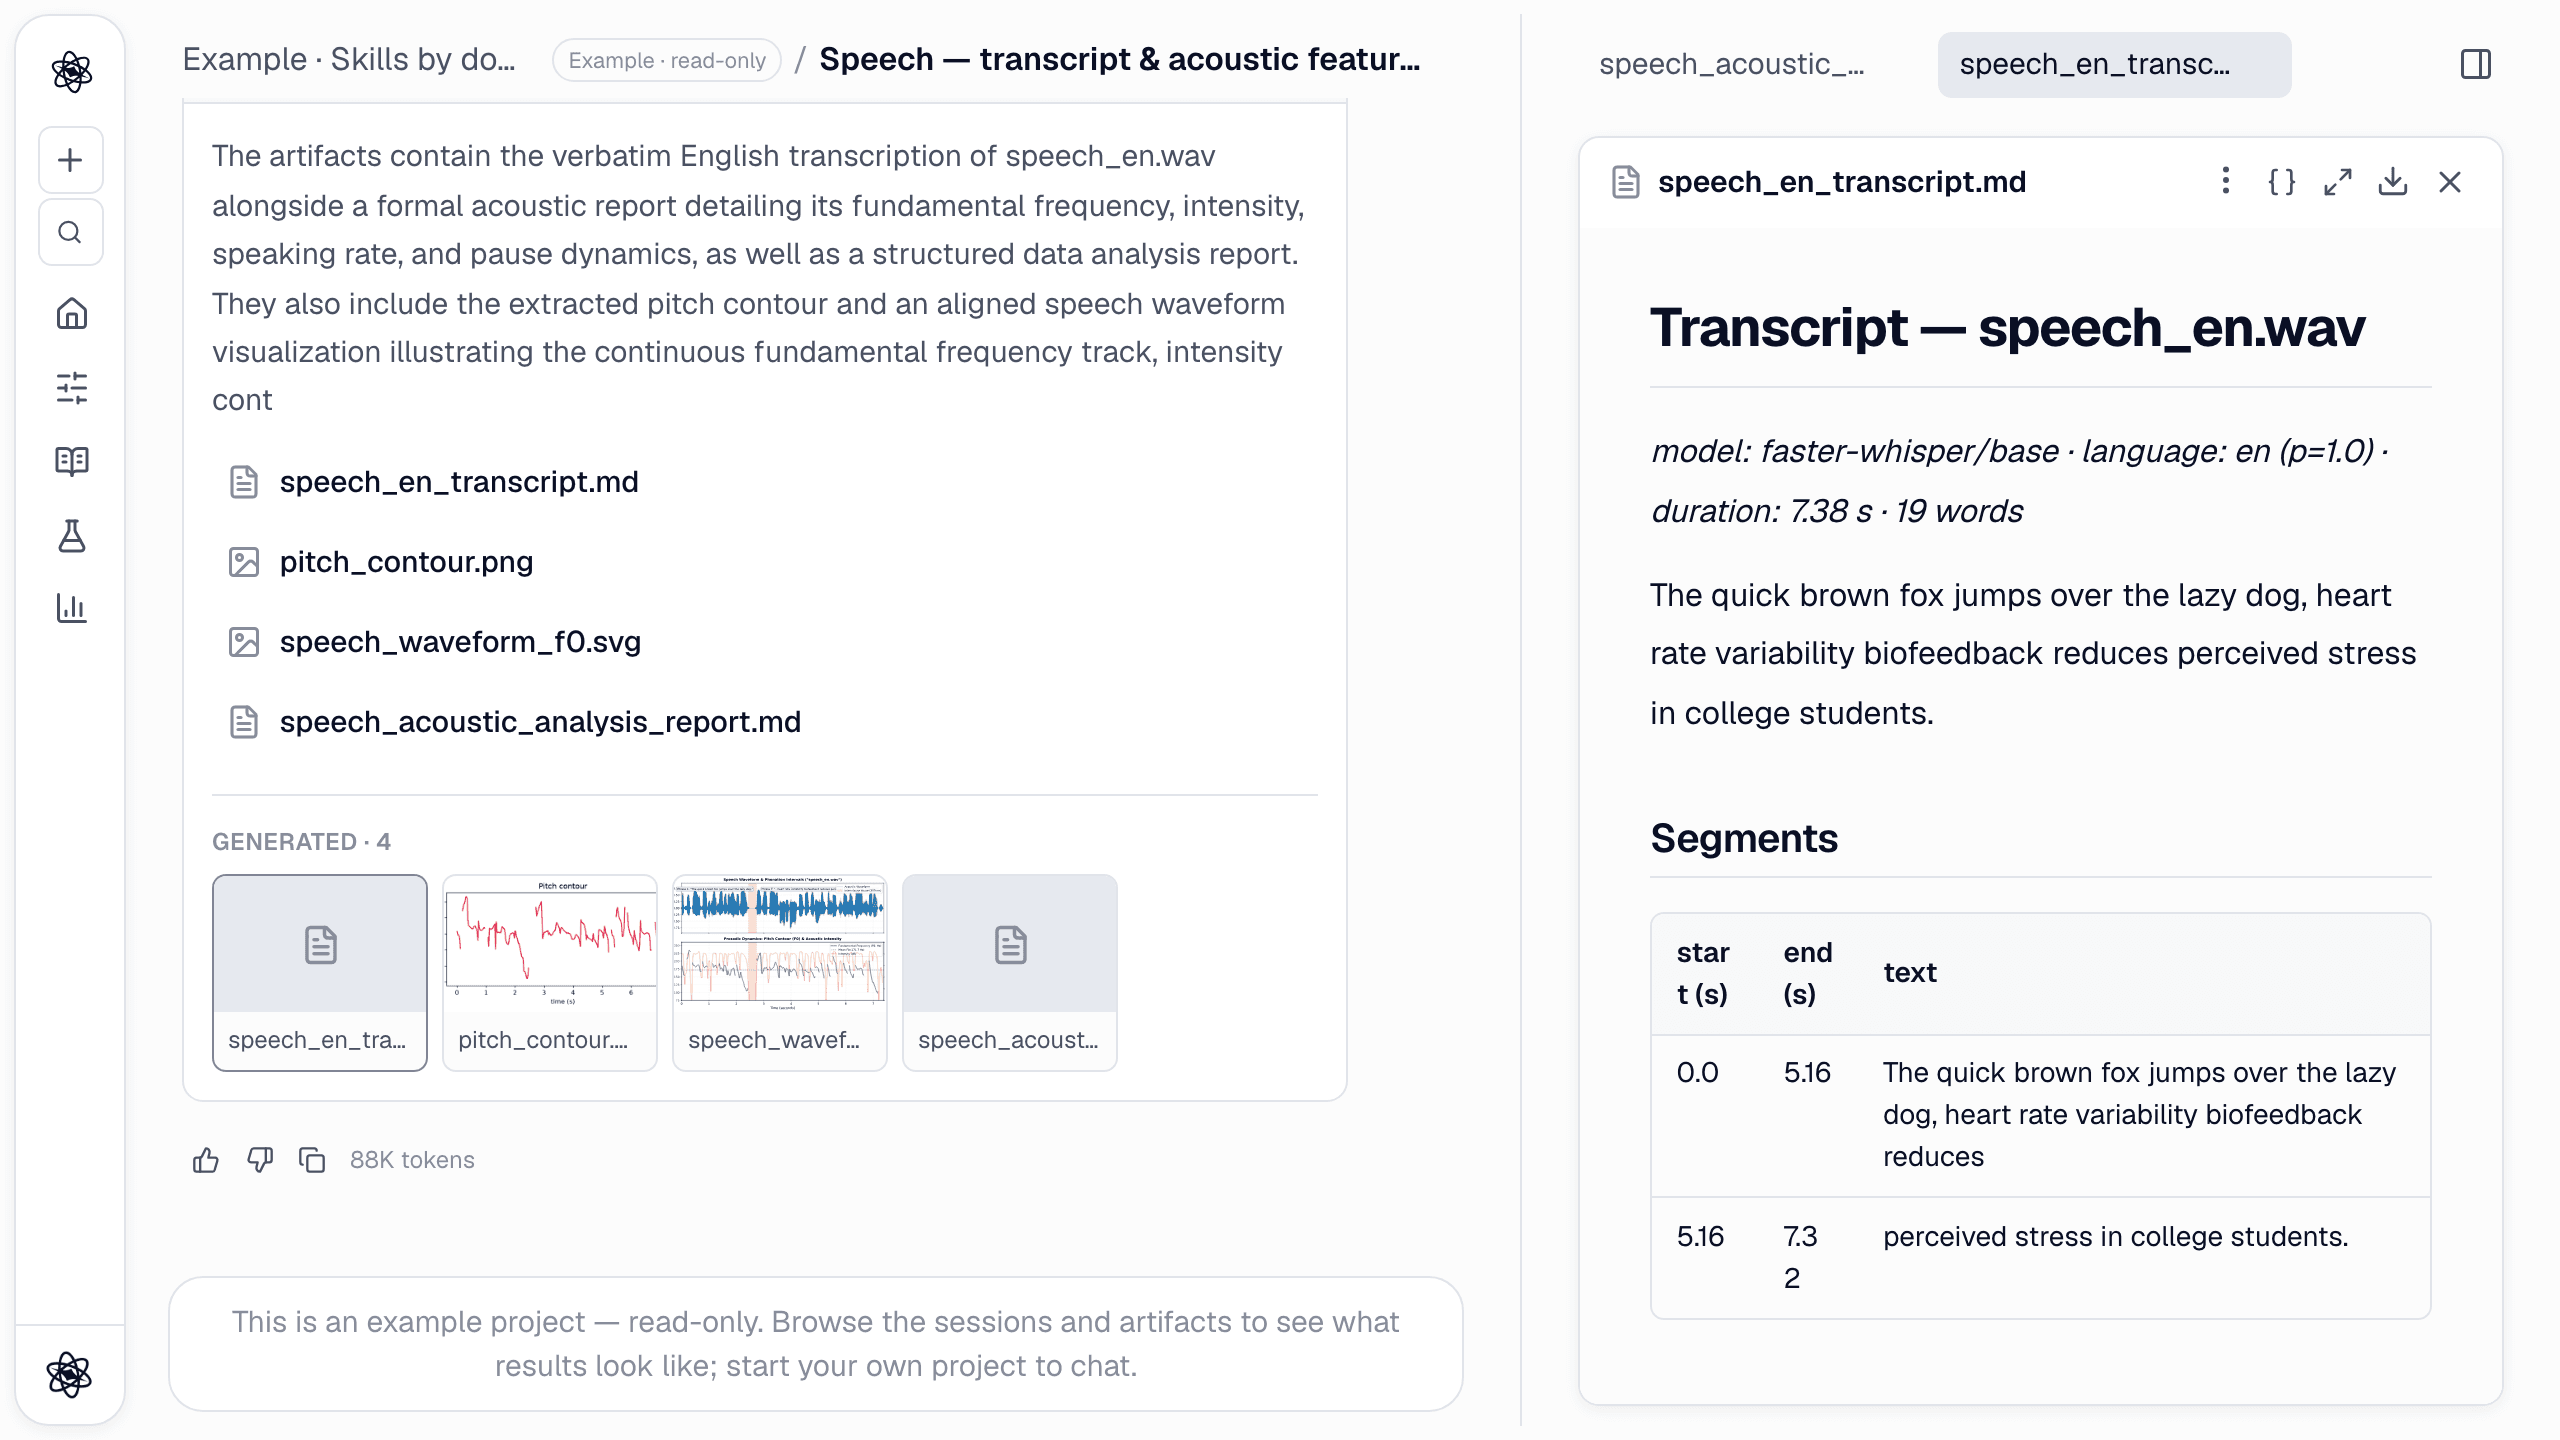
- Speech-to-text runs locally with faster-whisper, so the audio is not sent to an outside transcription service. You get timestamped segments, the detected language with its probability, word count and speaking rate.
- Voice and acoustic features cover F0 (mean, range, contour), intensity, jitter, shimmer, HNR, formants F1–F3 and MFCCs.
/analyze Transcribe speech_en.wav and extract its acoustic features: pitch contour, intensity, jitter/shimmer/HNR, formants and speaking rate. Summarise them in a report.
Video and images: expression, pose and heart rate from the face
Upload MP4, MOV, WebM, AVI or MKV, or a still image.
- Facial expression tracks facial action units over time (AU01, AU06, AU12, AU25 …), with EMFACS emotion labels and head pose.
- Pose estimates 33 body landmarks and derives joint angles, posture and movement.
- rPPG estimates heart rate from subtle skin-colour changes in the face. It runs three published algorithms, POS, CHROM and GREEN, and reports the SNR of each, so you can see when they disagree.
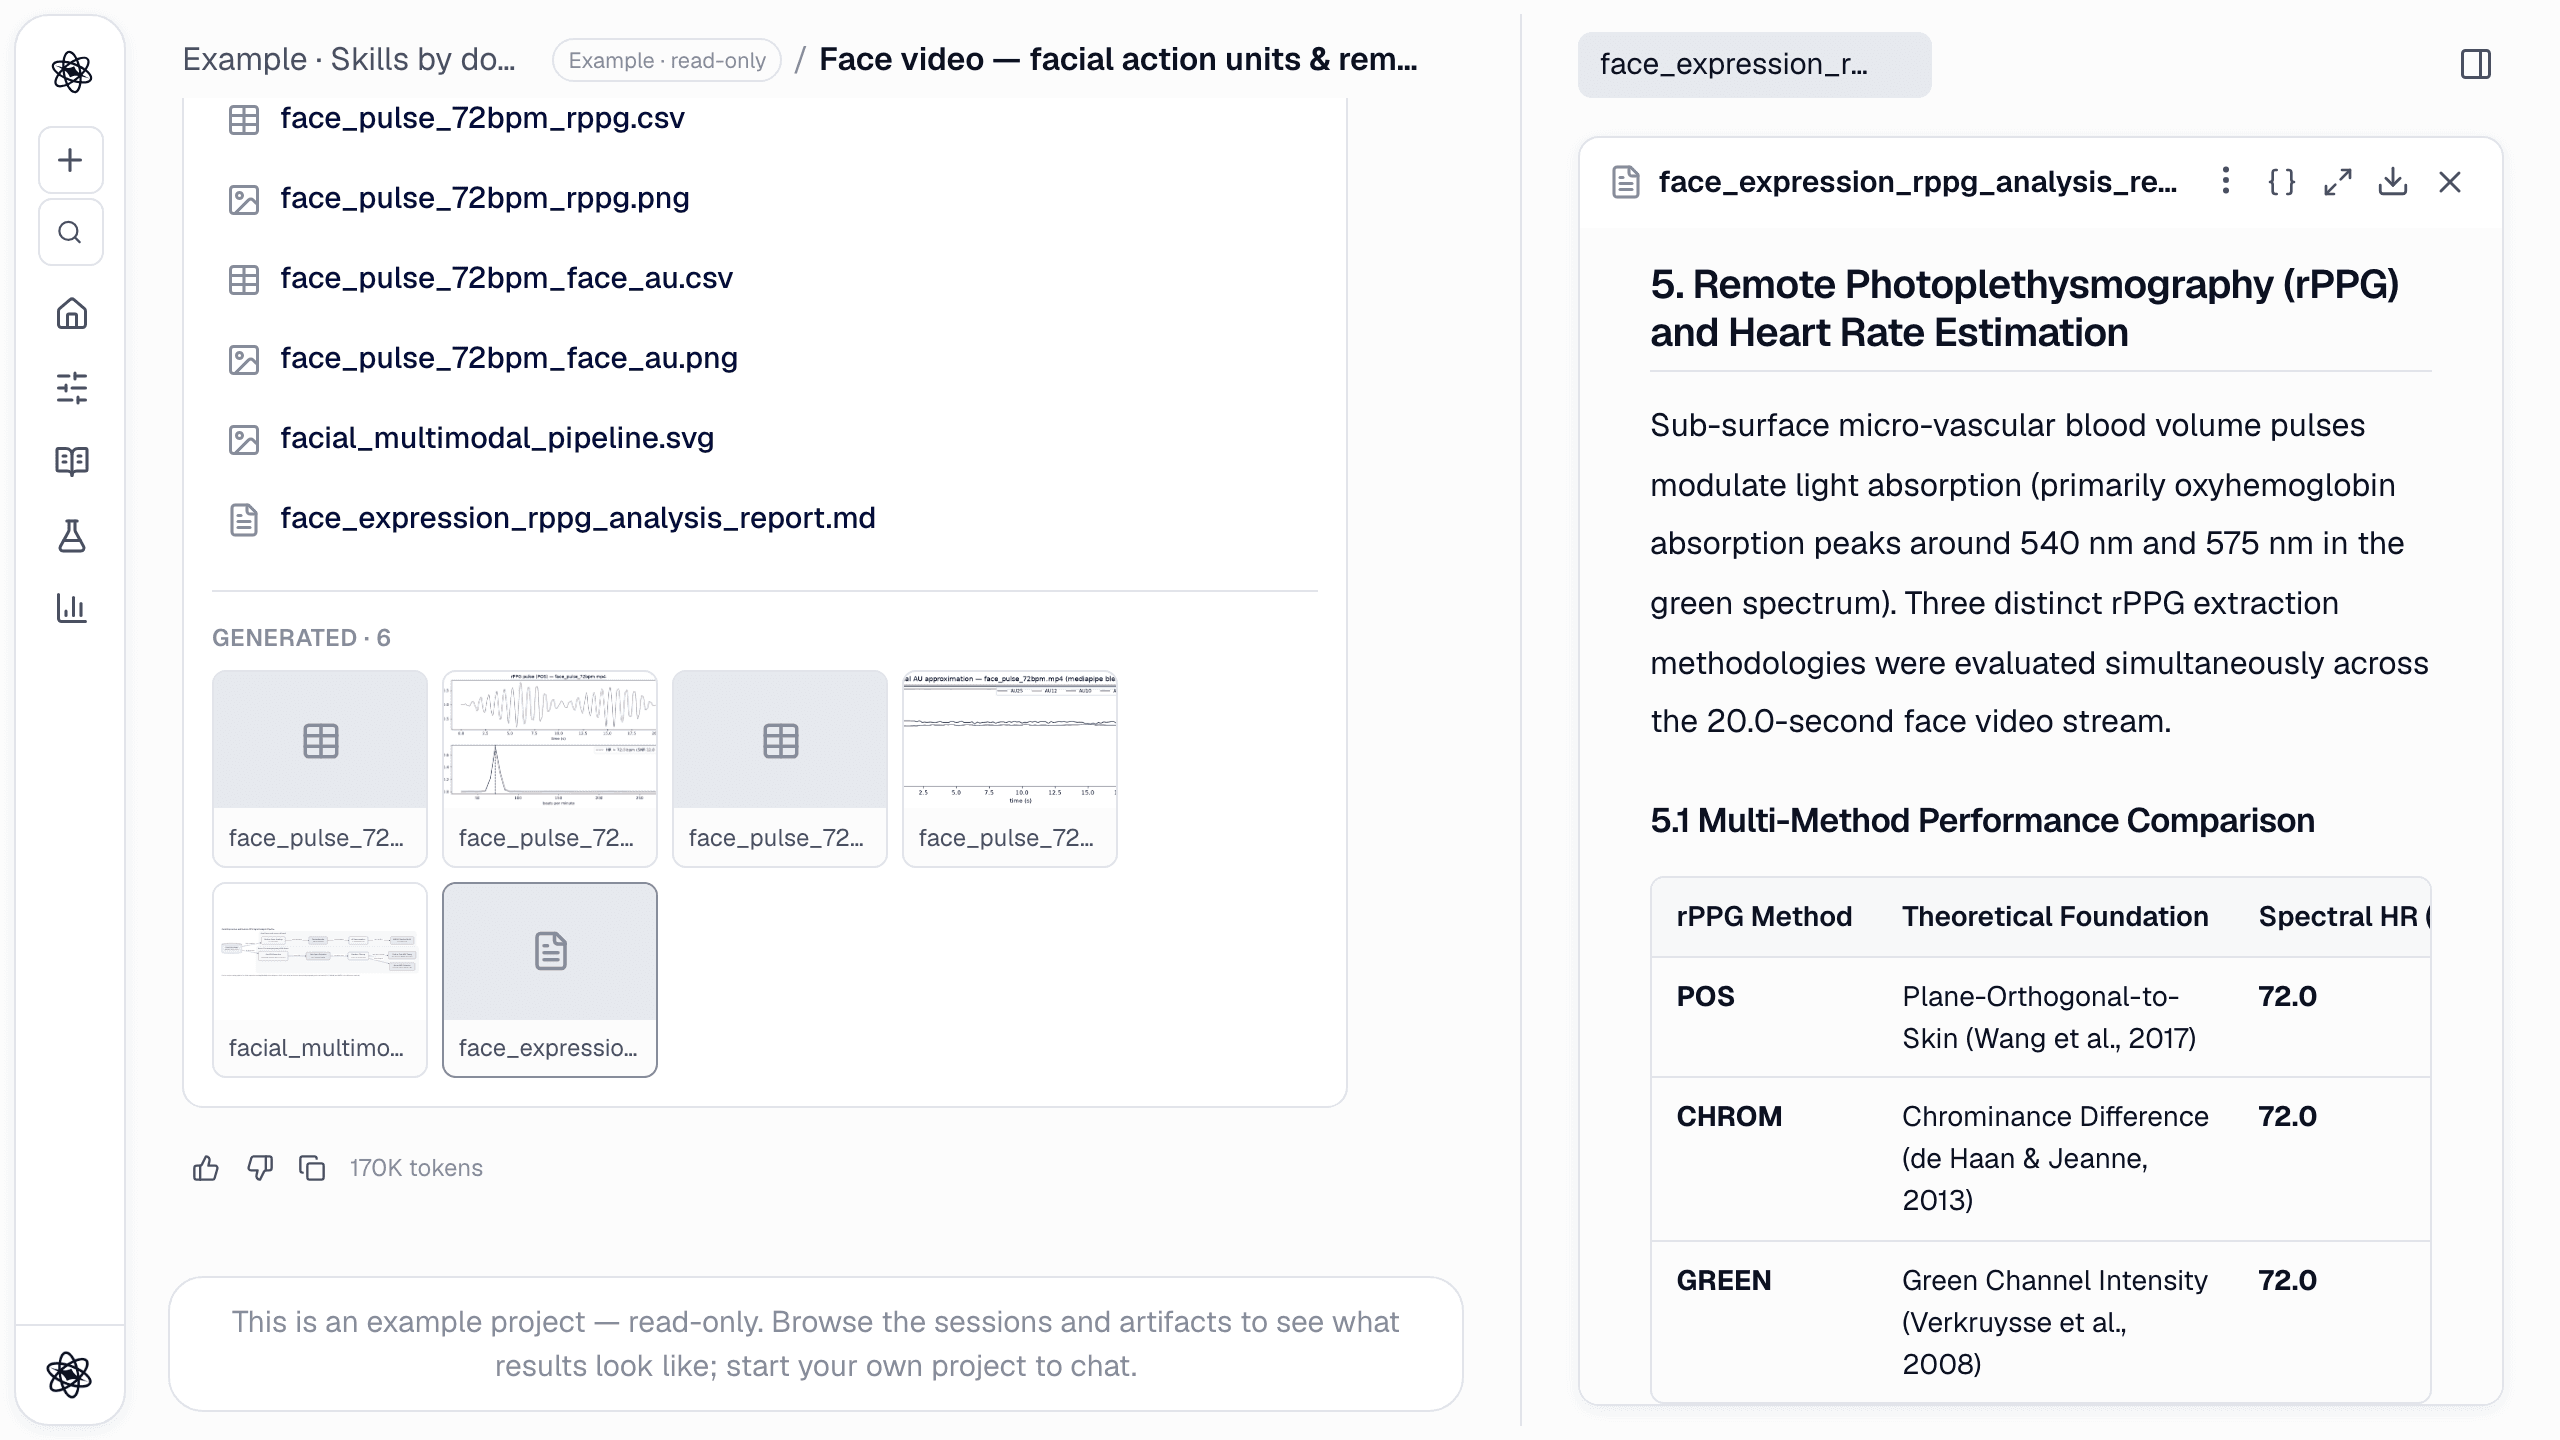
For a full walkthrough of the face-video pipeline, including the AU time series and the pulse spectrum, see Neutropic for psychophysiology labs.
Biosignal CSVs
ECG, PPG, EDA, respiration and RR-interval exports are tables too. Ask for heart rate from ECG or PPG, SCR count and skin-conductance level, breathing rate, or time- and frequency-domain HRV (mean RR, SDNN, RMSSD, pNN50). HRV and EDA have dedicated tools. You get a figure (for example a tachogram) and a report with the recording-length caveats attached.
Then the statistics: a test chosen with its reasons
Features are rarely the end point. Most studies need to compare conditions or groups. The statistics skill's compare_groups tool picks the test from the design and the data, and returns a decision trace explaining the choice.
- It identifies the design: independent or paired, two or more groups, or one-sample.
- It checks assumptions: Shapiro–Wilk per group, Levene, and Mauchly for repeated measures.
- It picks the test by rule. With a normality violation in a small sample (n < 50) it goes non-parametric. With unequal variances it uses Welch. Ordinal outcomes always get a non-parametric test.
- It reports the effect size with a CI, runs post-hoc tests, and saves a descriptive table and a box/strip plot.
The options include Student or Welch t, Mann–Whitney, paired t, Wilcoxon, one-way or Welch ANOVA (Tukey or Games–Howell), Kruskal–Wallis, repeated-measures ANOVA and Friedman. chi_square covers contingency tables, and anova_design covers two-way, mixed and ANCOVA designs.
/stats Compare P3 amplitude at Pz between the two groups in p3_by_participant.csv. Check the assumptions and pick the appropriate test, and explain why.
If the data are skewed and the groups are small, the trace will say so (for example "normality violated … n_min = 18 → non-parametric") and you get Mann–Whitney U with a rank-biserial effect size instead of a t-test that shouldn't have been run. The statistics walkthrough covers this in more depth.
Every number traceable
- Each tool call records its name and arguments. Each figure and table keeps the code that produced it (press { } in the artifact panel), and cleaned data are saved as new files, not overwritten.
- The analysis report is written from the tool outputs, and its sentences carry [n] citations that point to the exact analysis step or data file behind each number.
- The whole path, from raw signal through cleaning, features and test to the write-up, stays in one session. It can go straight into /write when you draft the paper. More on this in Reproducibility by default.
Honest limits
- EEG input is a table. Convert EDF/BDF or vendor formats to CSV first. The ERP component windows are fixed (N1 70–150 ms, P3 250–600 ms). Blink removal needs frontal channels, since separate EOG channels are not yet used. Topomaps need 10–20 channel names.
- rPPG uses only the classic methods (POS, CHROM, GREEN). Deep-learning rPPG is not included, and SNR drops with strong head motion or changing light.
- Action units are approximated from face-landmark blendshapes on a 0–1 scale. They are not OpenFace intensities (0–5), and AU06 is an approximation.
- Pose angles are 2-D projections.
- Measurements are only what the tools return. The agent is instructed to quote tool values verbatim and to say plainly when a tool could not do something (no face detected, SNR too low, language uncertain).
Start with the example project to see these sessions, or attach your own recording and describe what it is. The data analysis docs list the formats and options.