Start
Attach the file and describe what the data is and what you want to know:
text
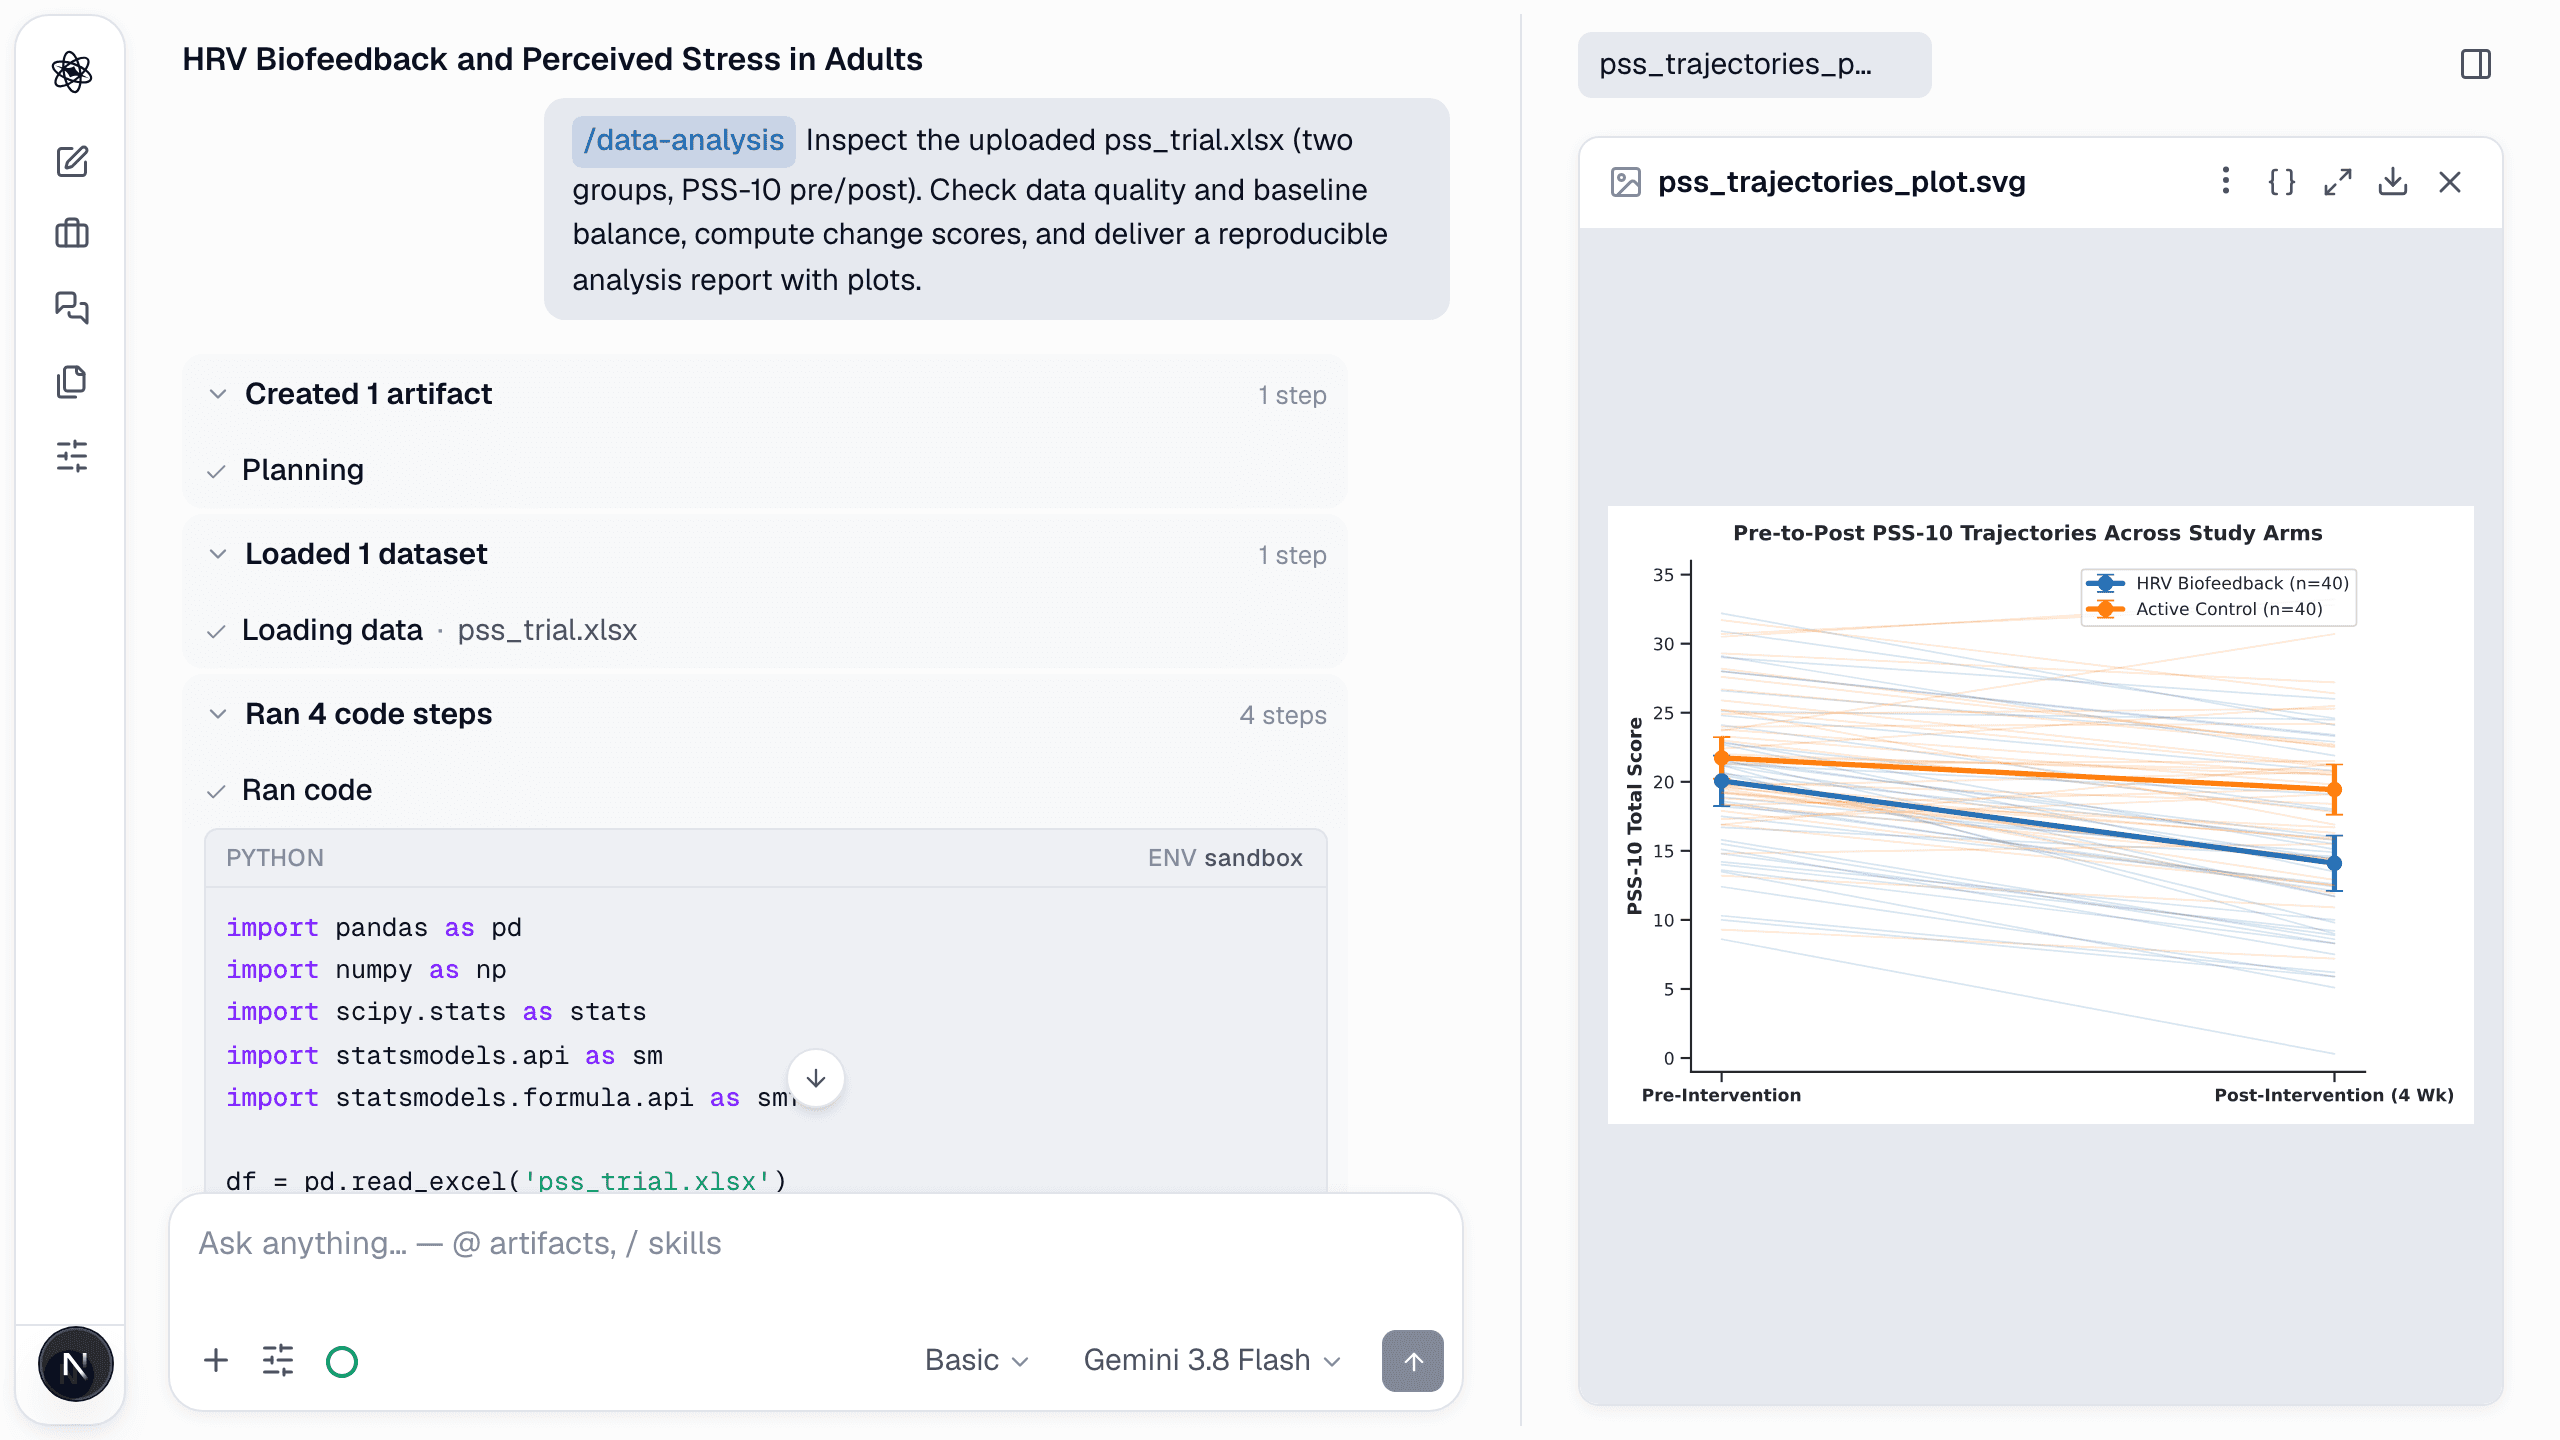
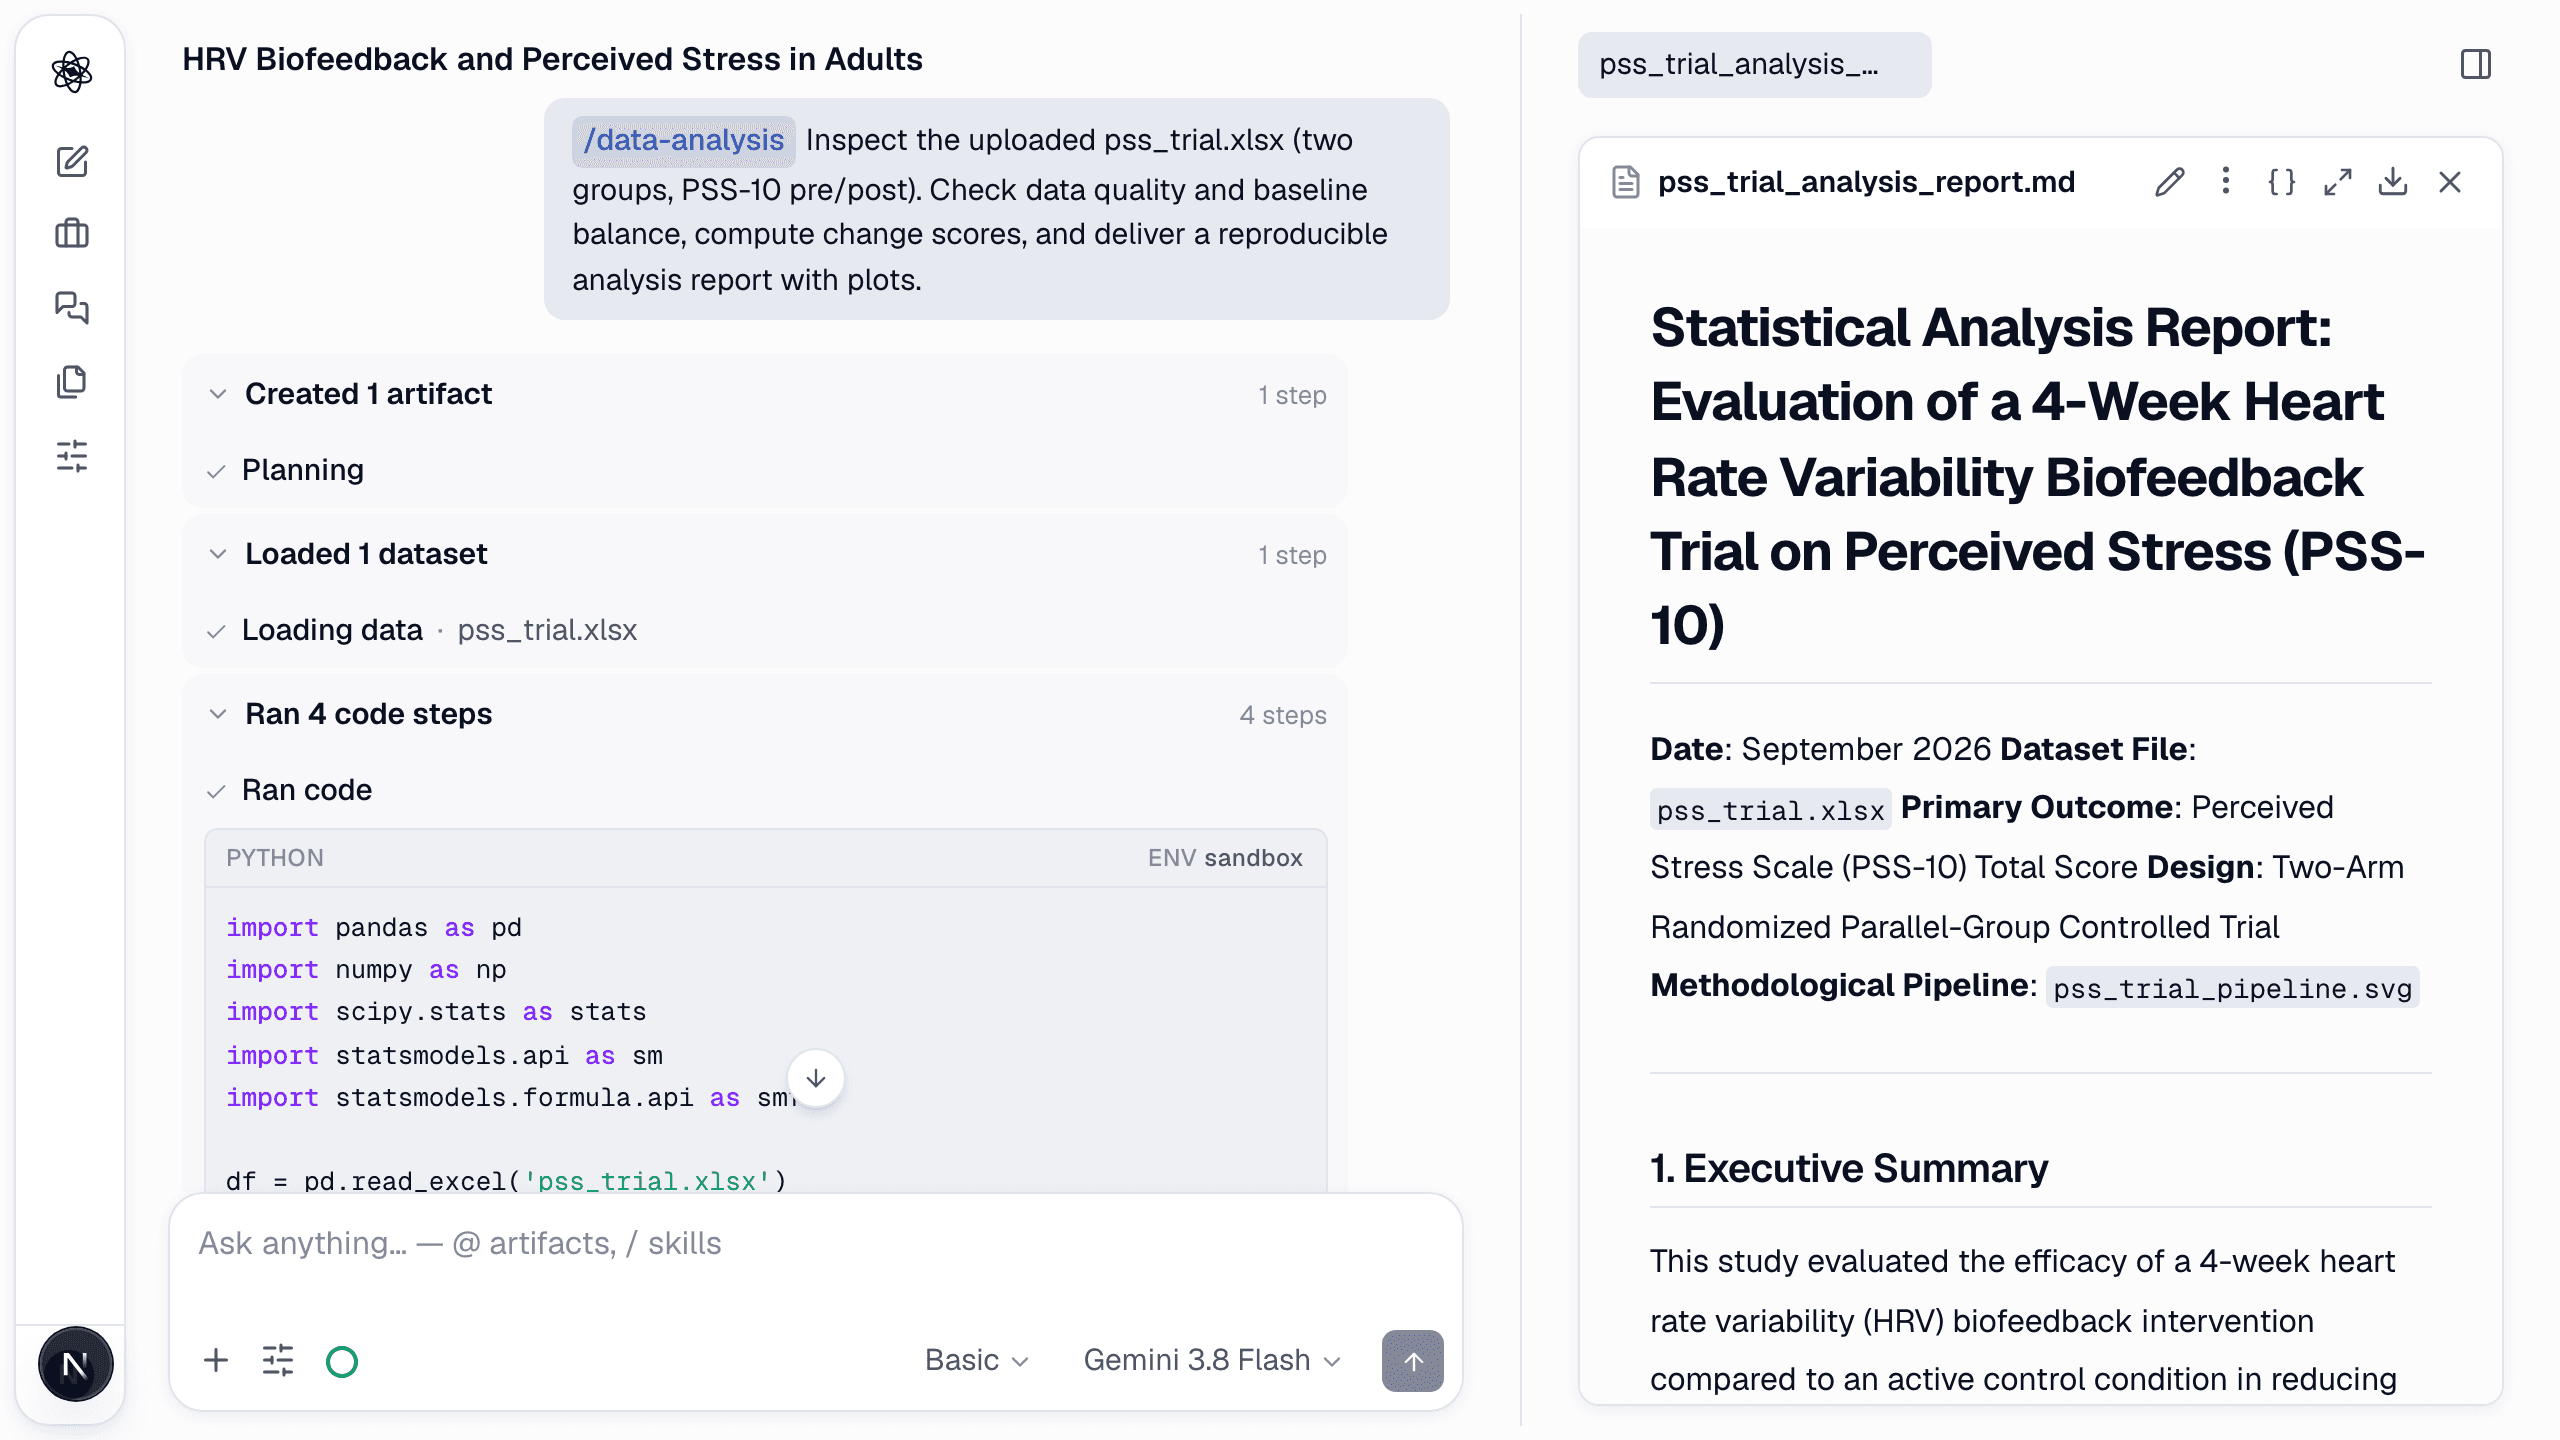
/analyze Inspect the uploaded pss_trial.xlsx (two groups, PSS-10 pre/post). Check data quality and baseline balance, compute change scores, and deliver a reproducible analysis report with plots.
Say what the columns mean if the headers aren't self-explanatory — group codes, scale ranges, reverse-scored items.
What happens
- Inspect — structure, types, missingness, outliers, duplicates; a data-quality summary.
- Plan — an explicit analysis plan you can read before results: variables, transformations, tests, figures.
- Clean and transform — every step is code, recorded with the artifact.
- Analyze — the verified statistical tools run with assumption checks; effect sizes and CIs are reported alongside p-values.
- Interpret — a report with results, interpretation and limitations, checked by the reviewer.
What you get
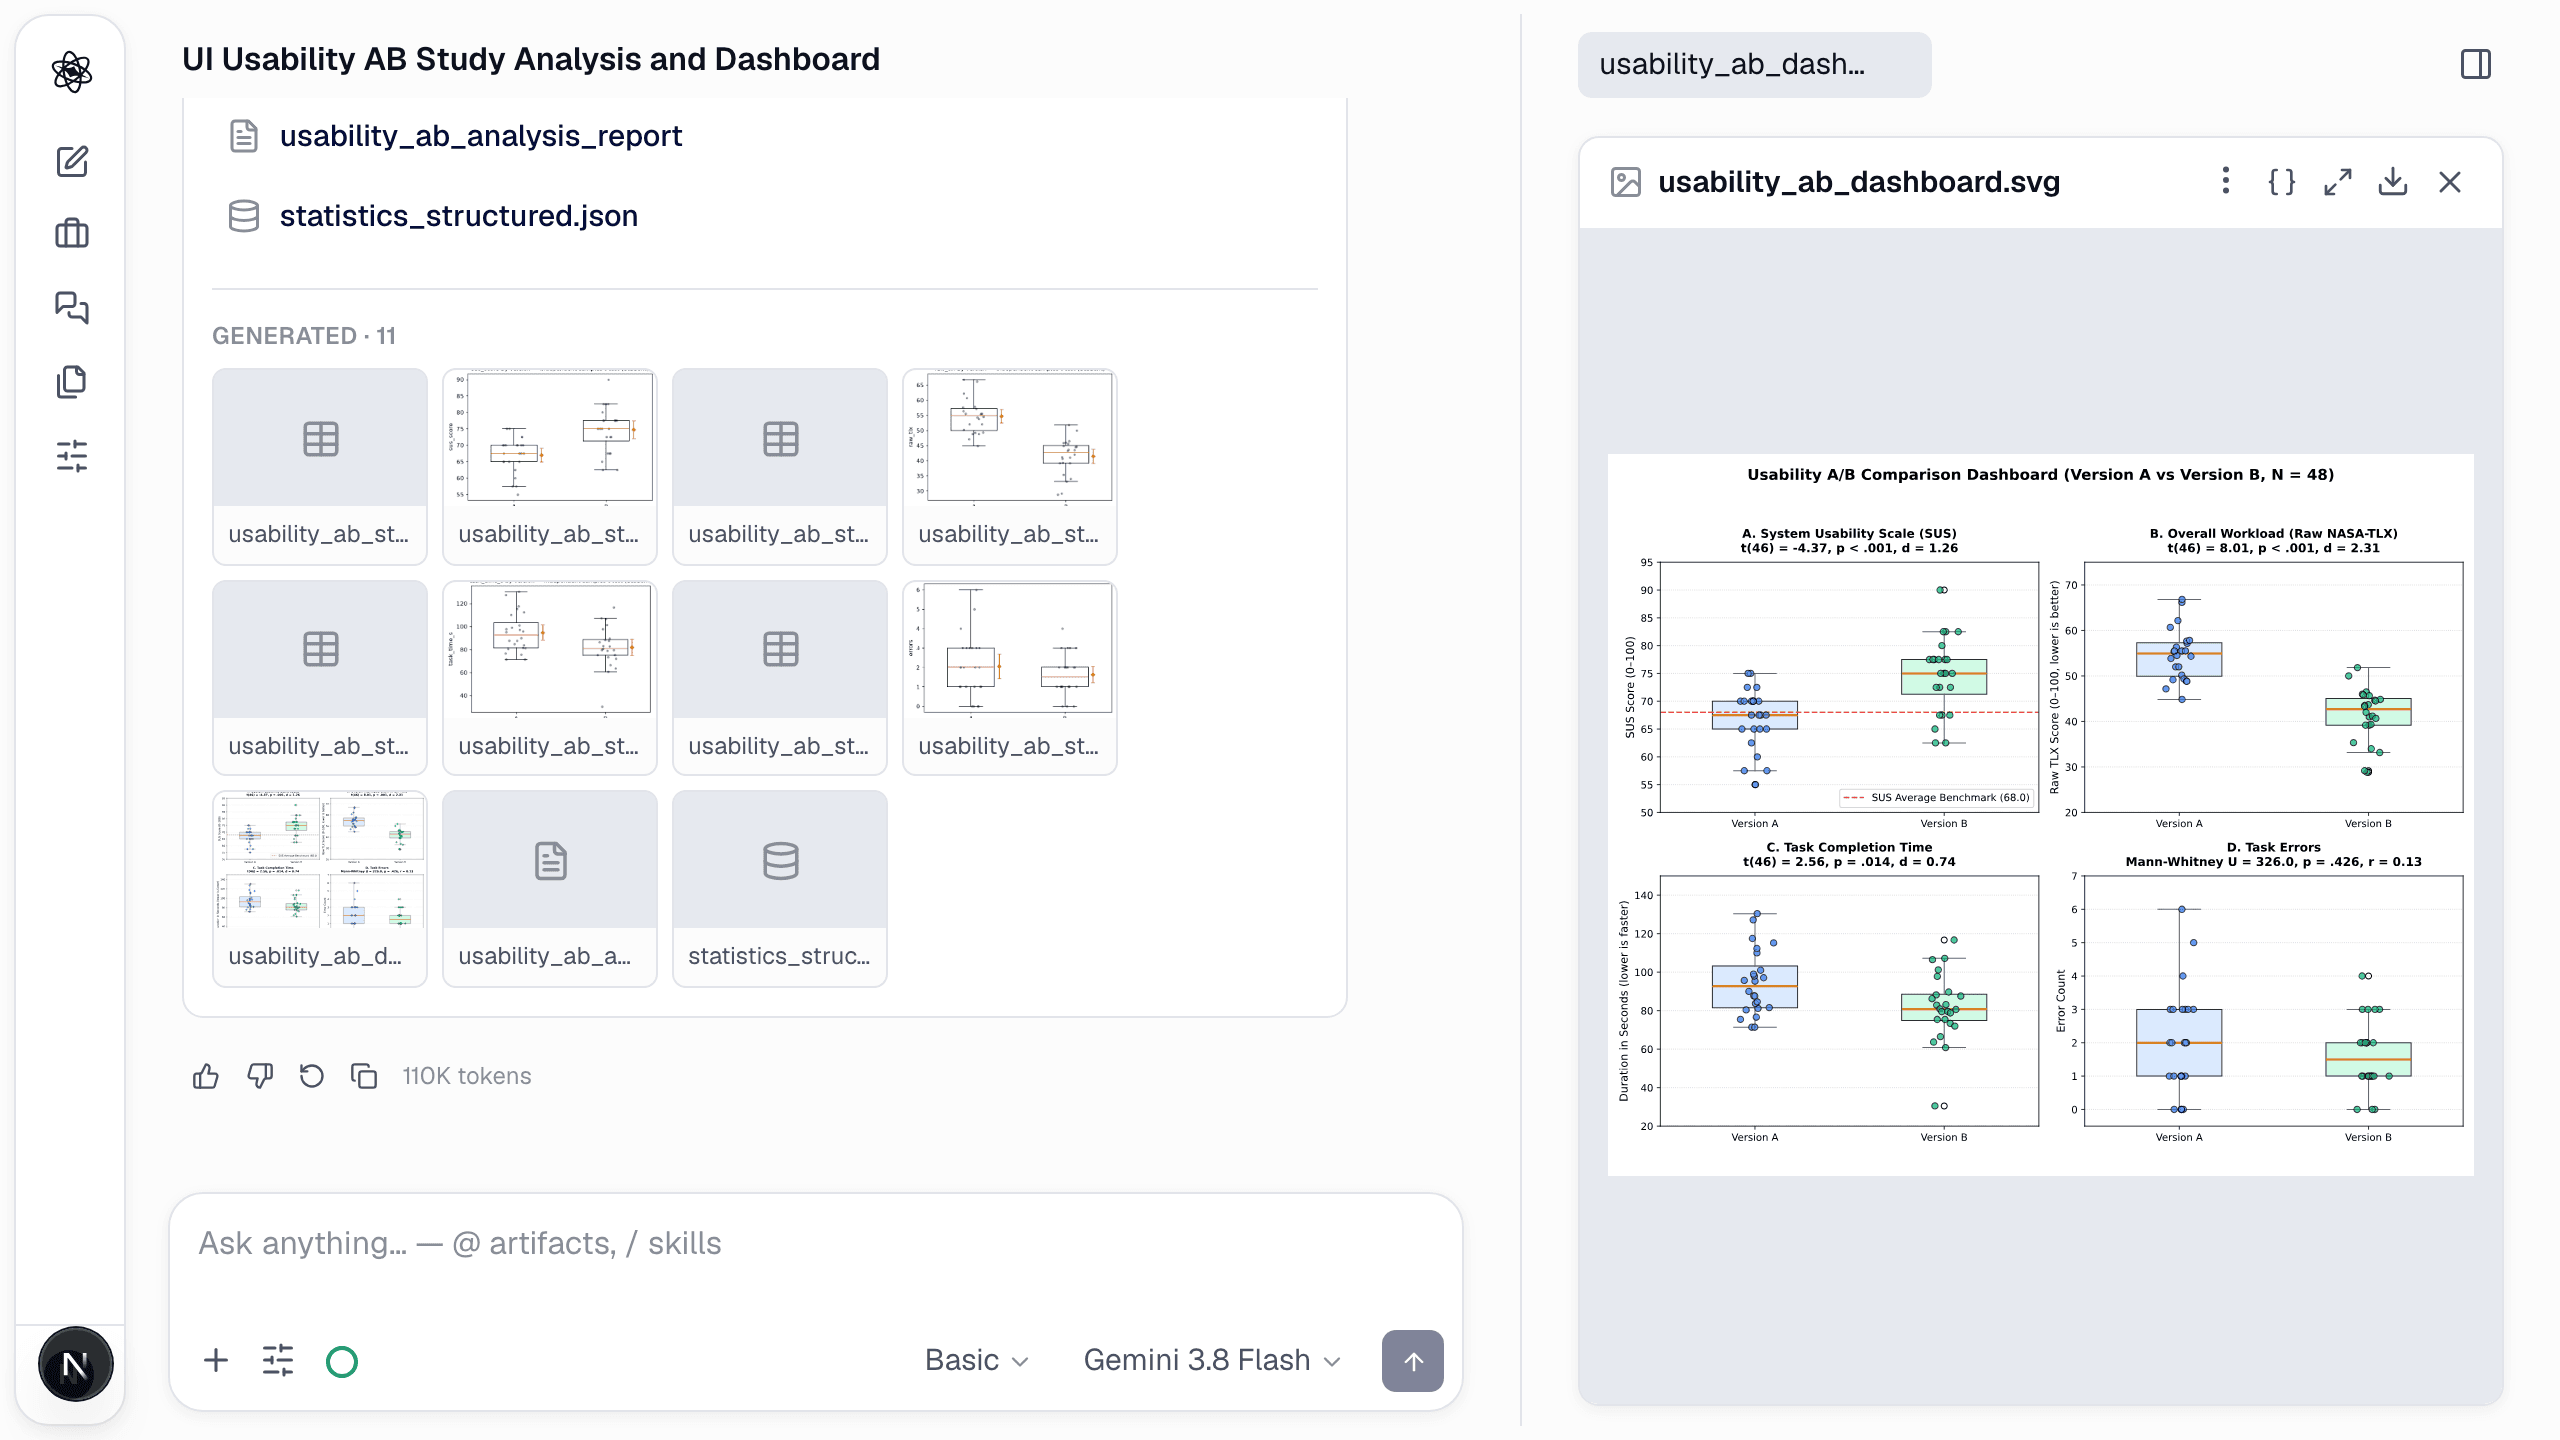
<dataset>_analysis_report.md— data quality · plan · assumption checks · results · interpretation · limitations · code.- Plots as SVG/PNG, cleaned or derived tables as CSV, and a structured JSON of results.
Domain analyses
The same command drives the domain method skills — usability instruments (SUS, NASA-TLX, UEQ), semantic differential and conjoint, biosignals (ECG/HRV, EDA, respiration, EEG), face and voice from video and audio, text analysis of open-ended answers. Ask for them by name; see Method skills.
Walkthrough: Analyzing the data.