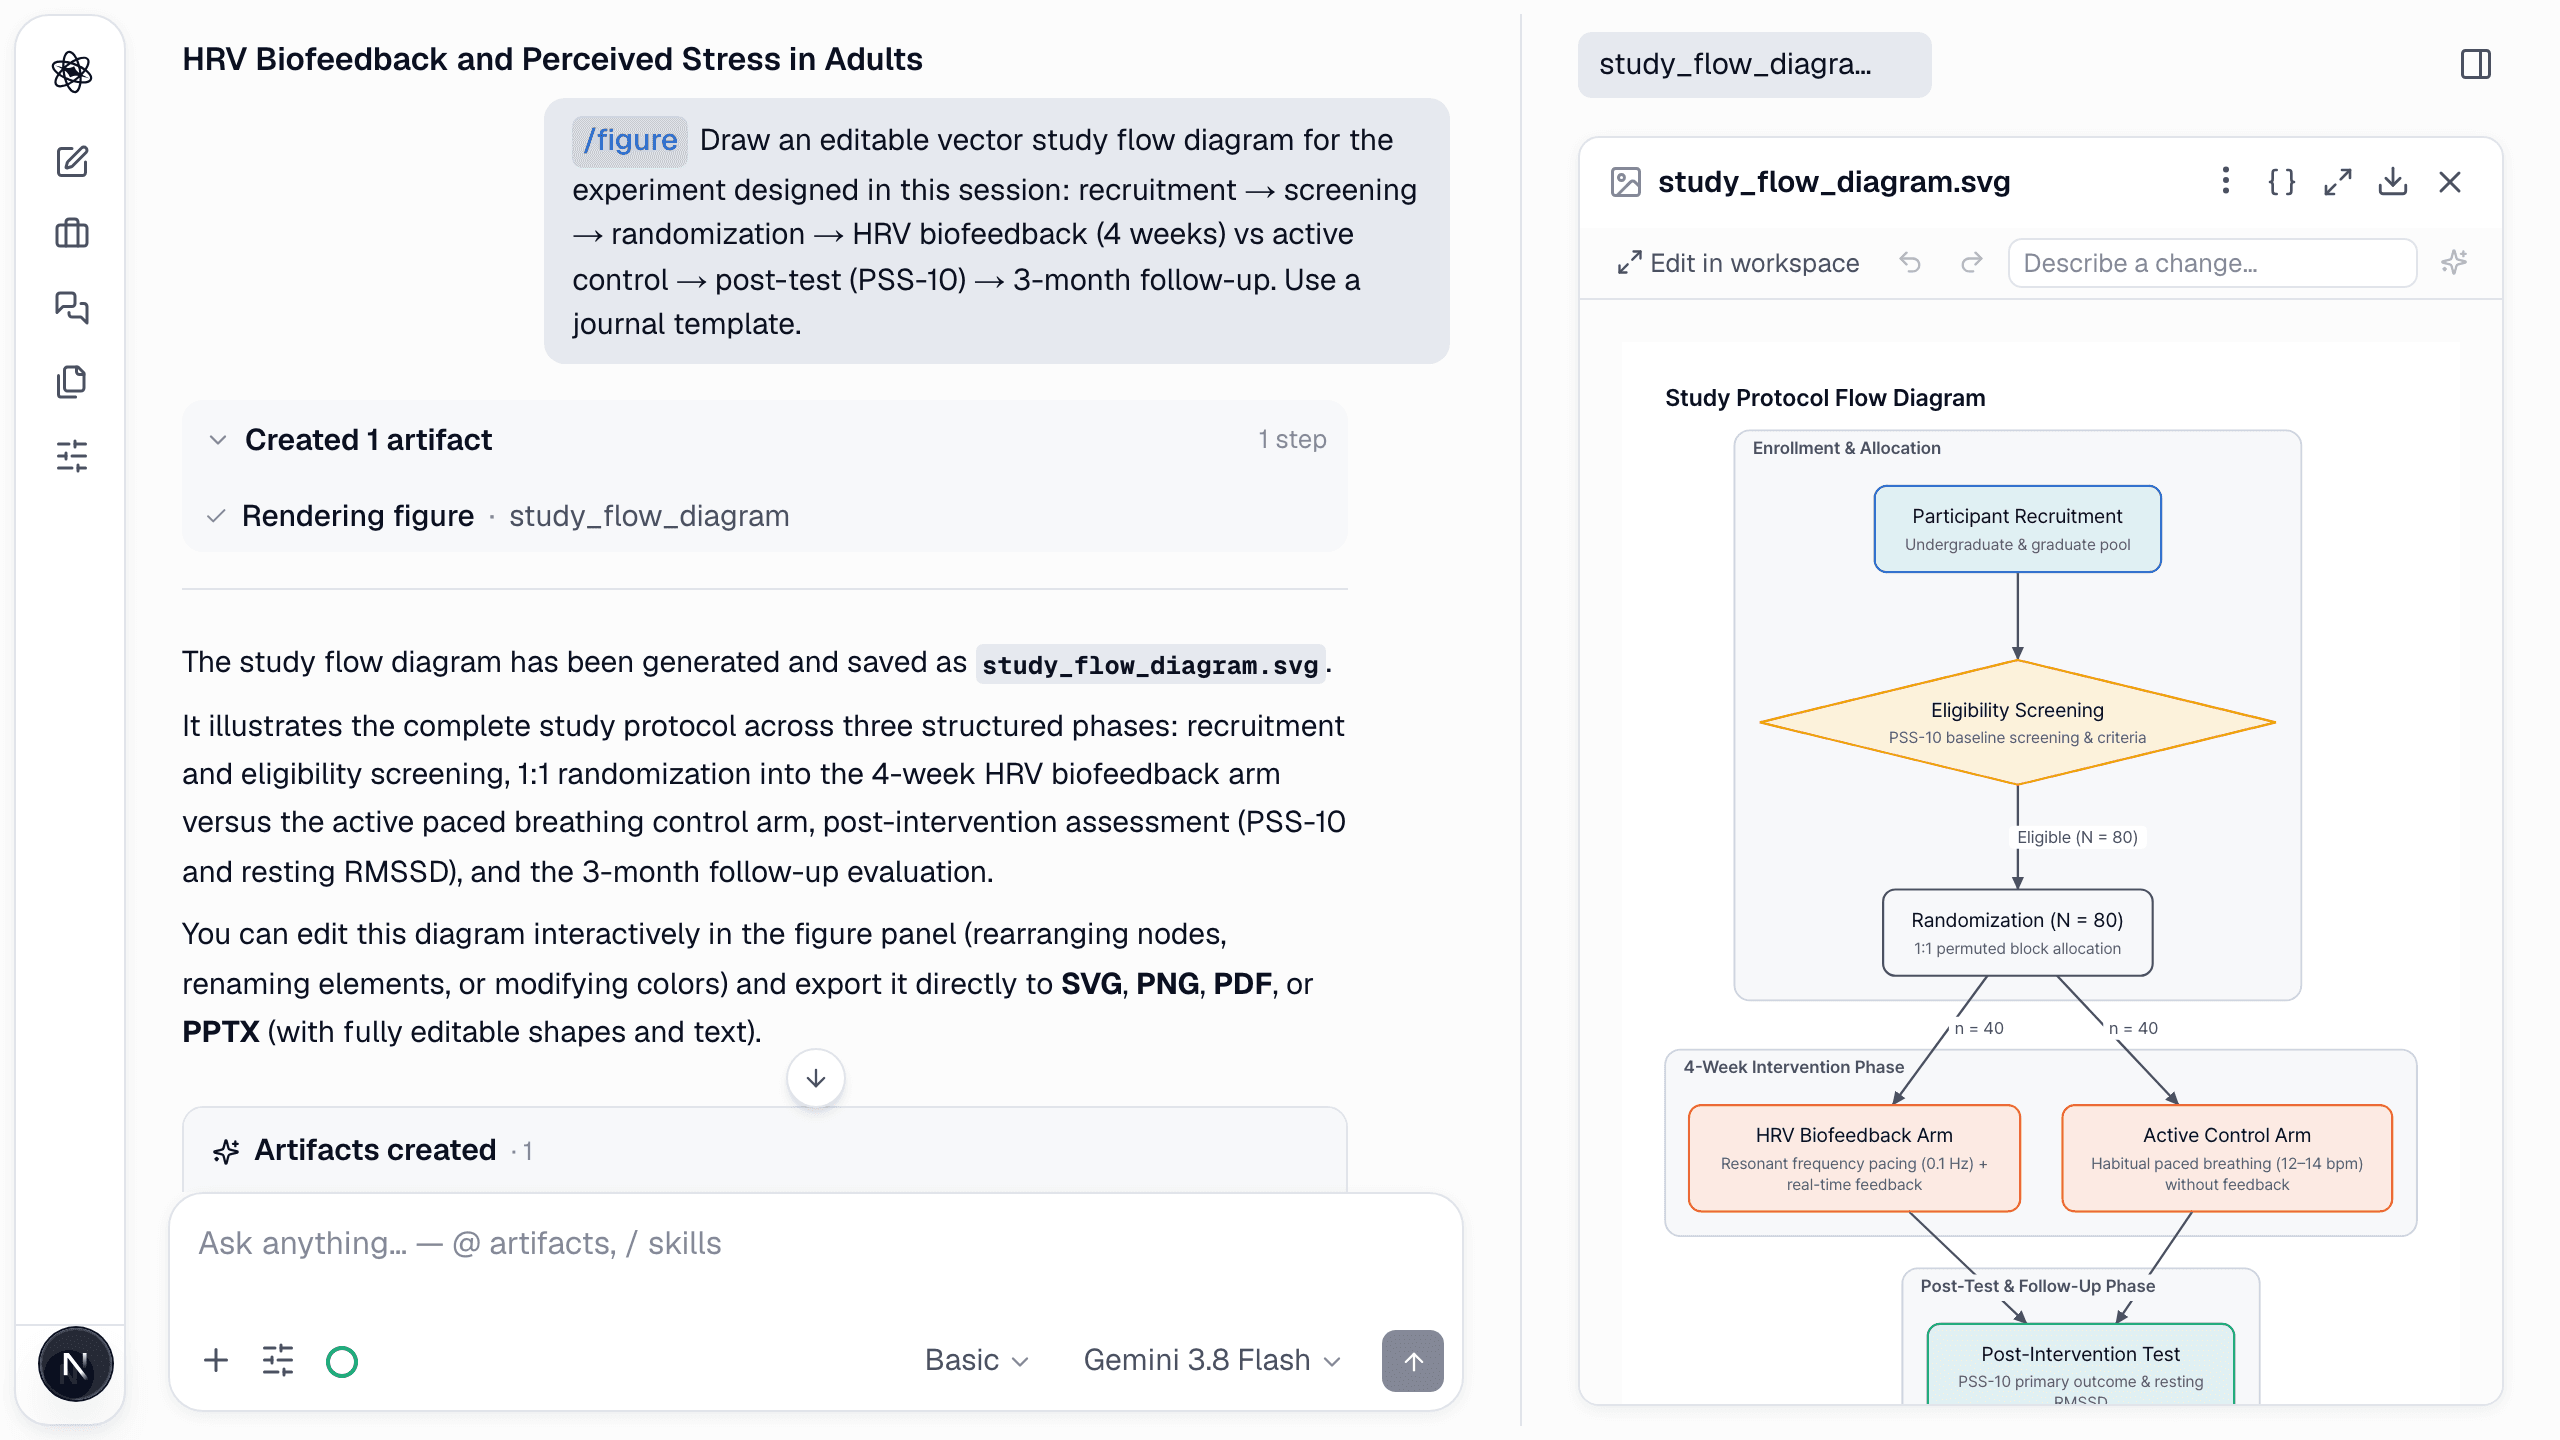
Diagrams — /figure
/figure Draw the research flow of the experiment designed in this session as an editable vector diagram: recruitment → screening → randomization → HRV biofeedback (4 weeks) vs active control → post-test (PSS-10) → 3-month follow-up. Use the journal template.
The figure skill lays out the diagram (flowcharts, frameworks, protocol flows, timelines) with a journal-style template and saves it as SVG. Text stays text, so it's searchable and editable.
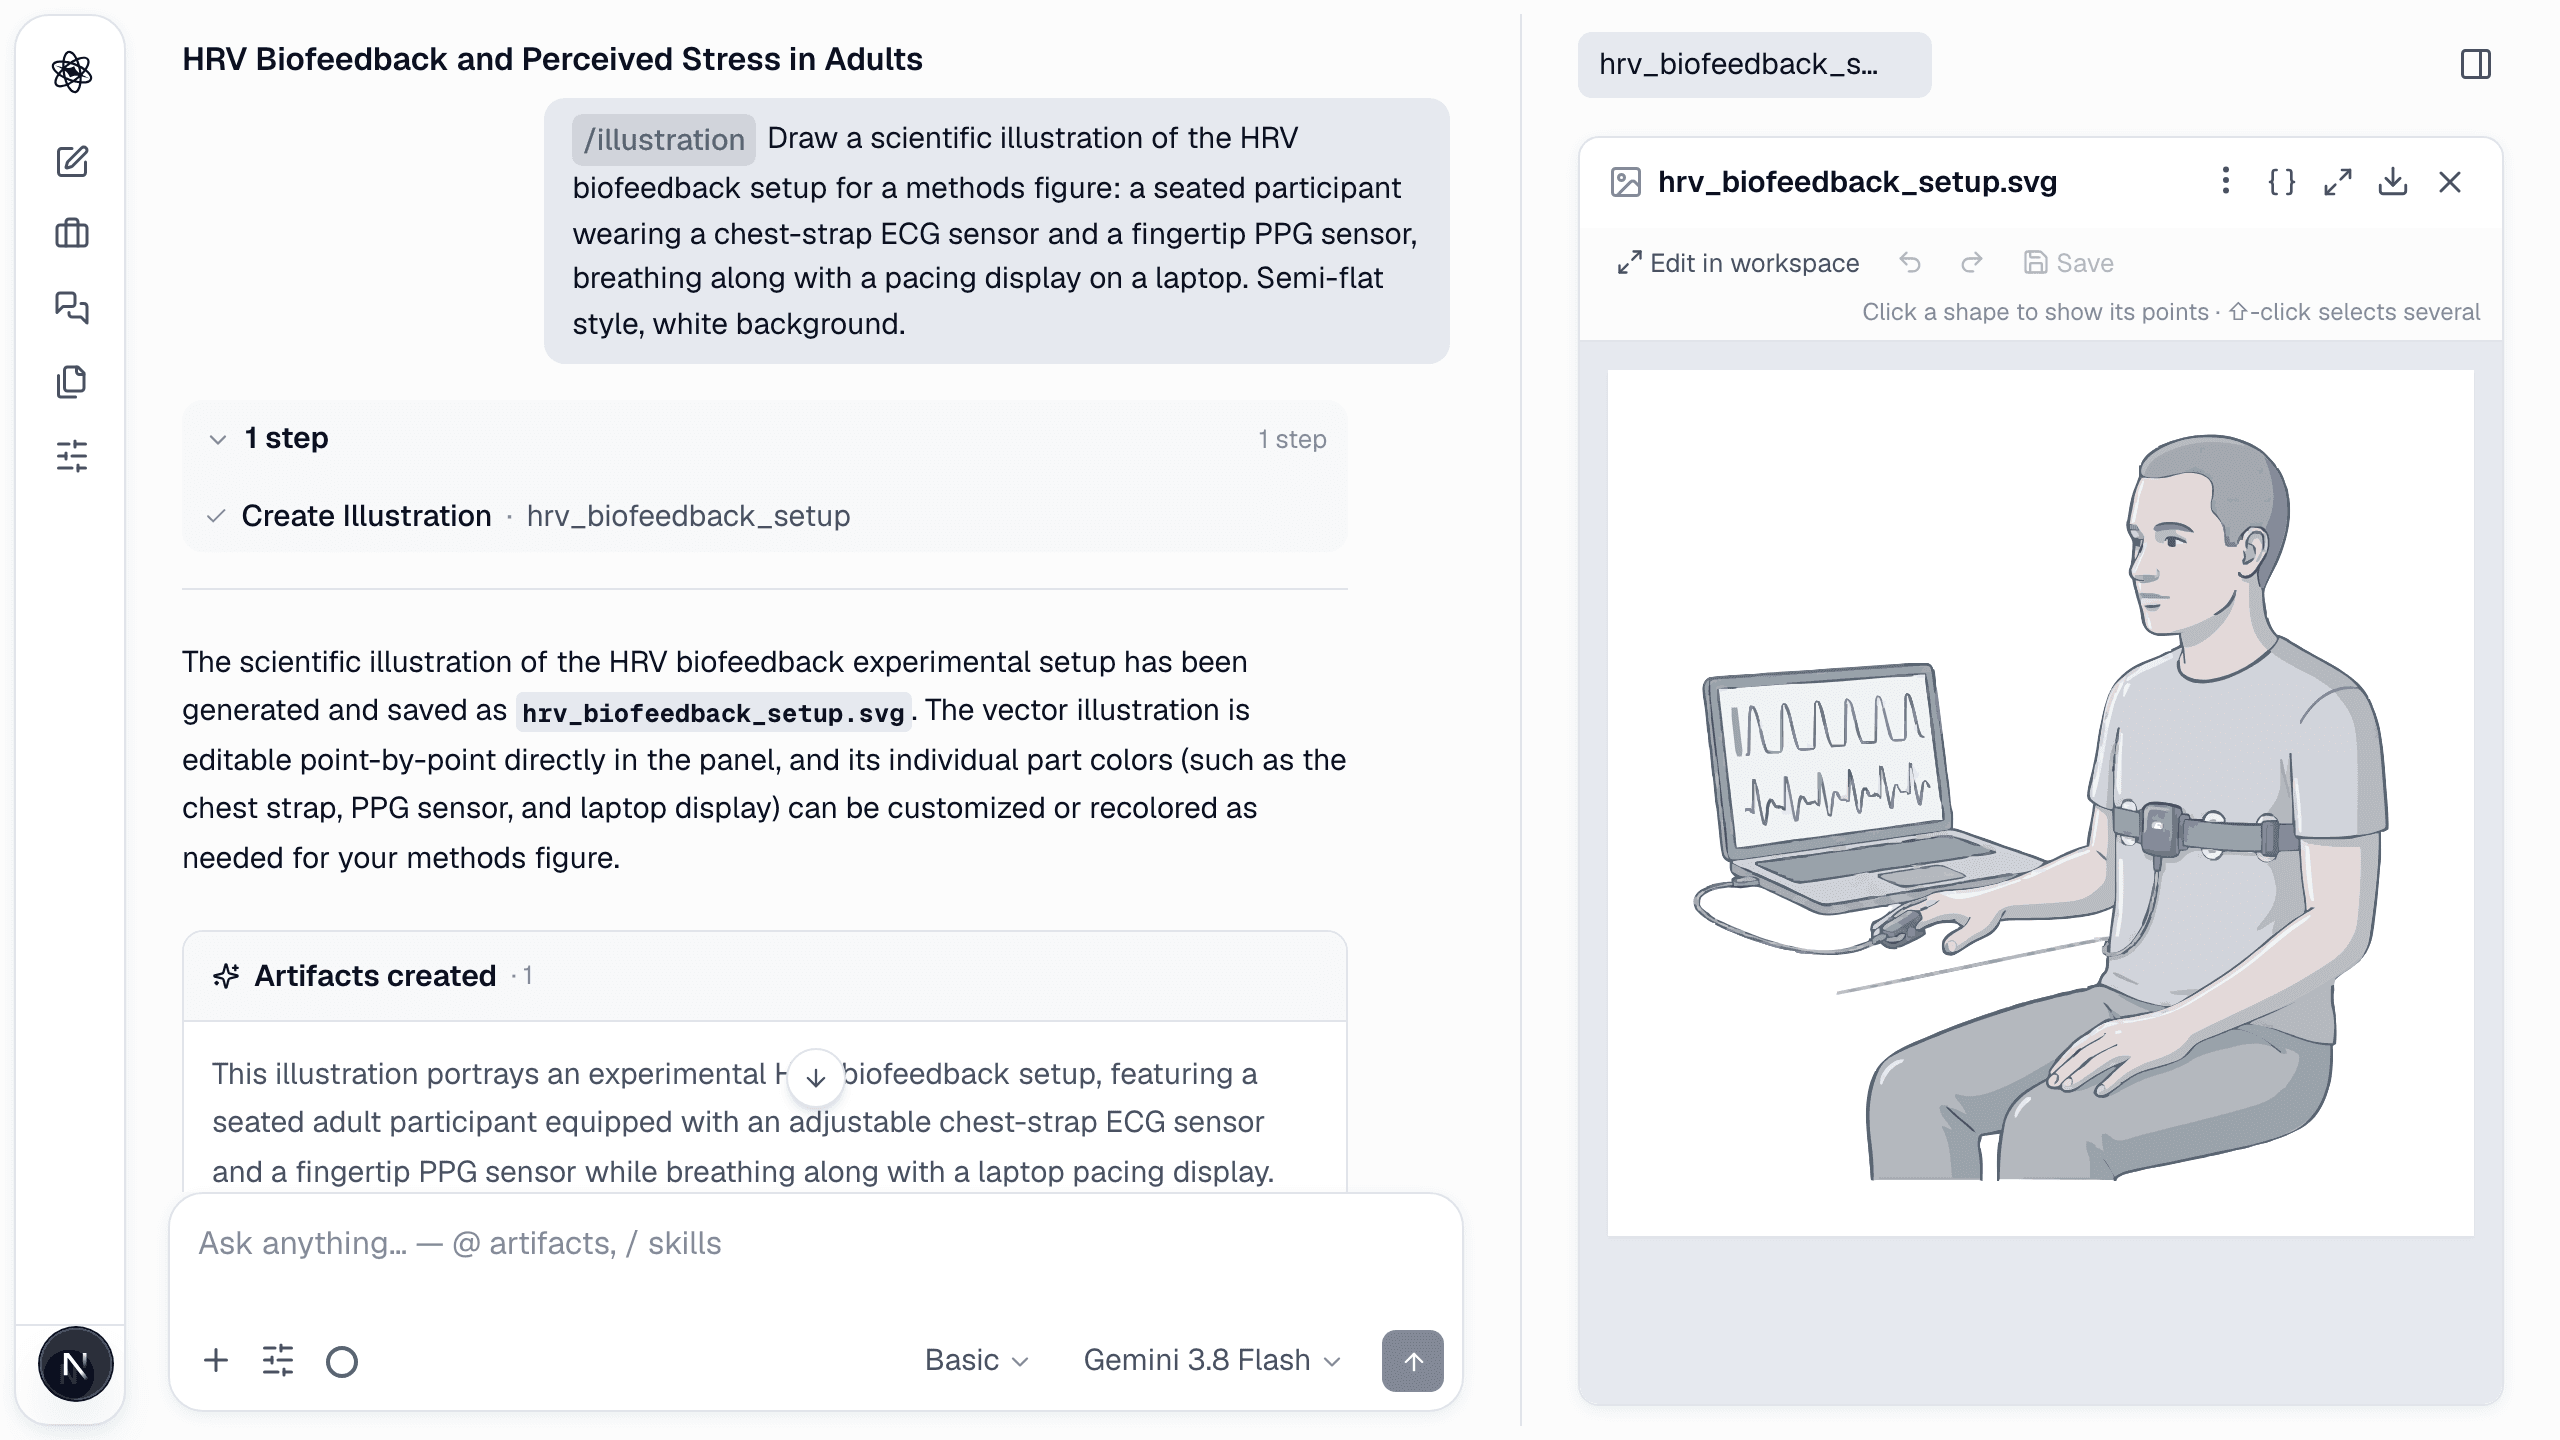
Illustrations — /illustrate
/illustrate A scientific illustration of the HRV biofeedback setup for a methods figure: a seated participant wearing a chest-strap ECG sensor and a fingertip PPG sensor, breathing along with a paced-breathing display on a laptop. Semi-flat style, white background.
Illustrations are generated as vector art with labeled parts. Quality follows the effort level — Lite is quick and rough, Deep is publication-grade.
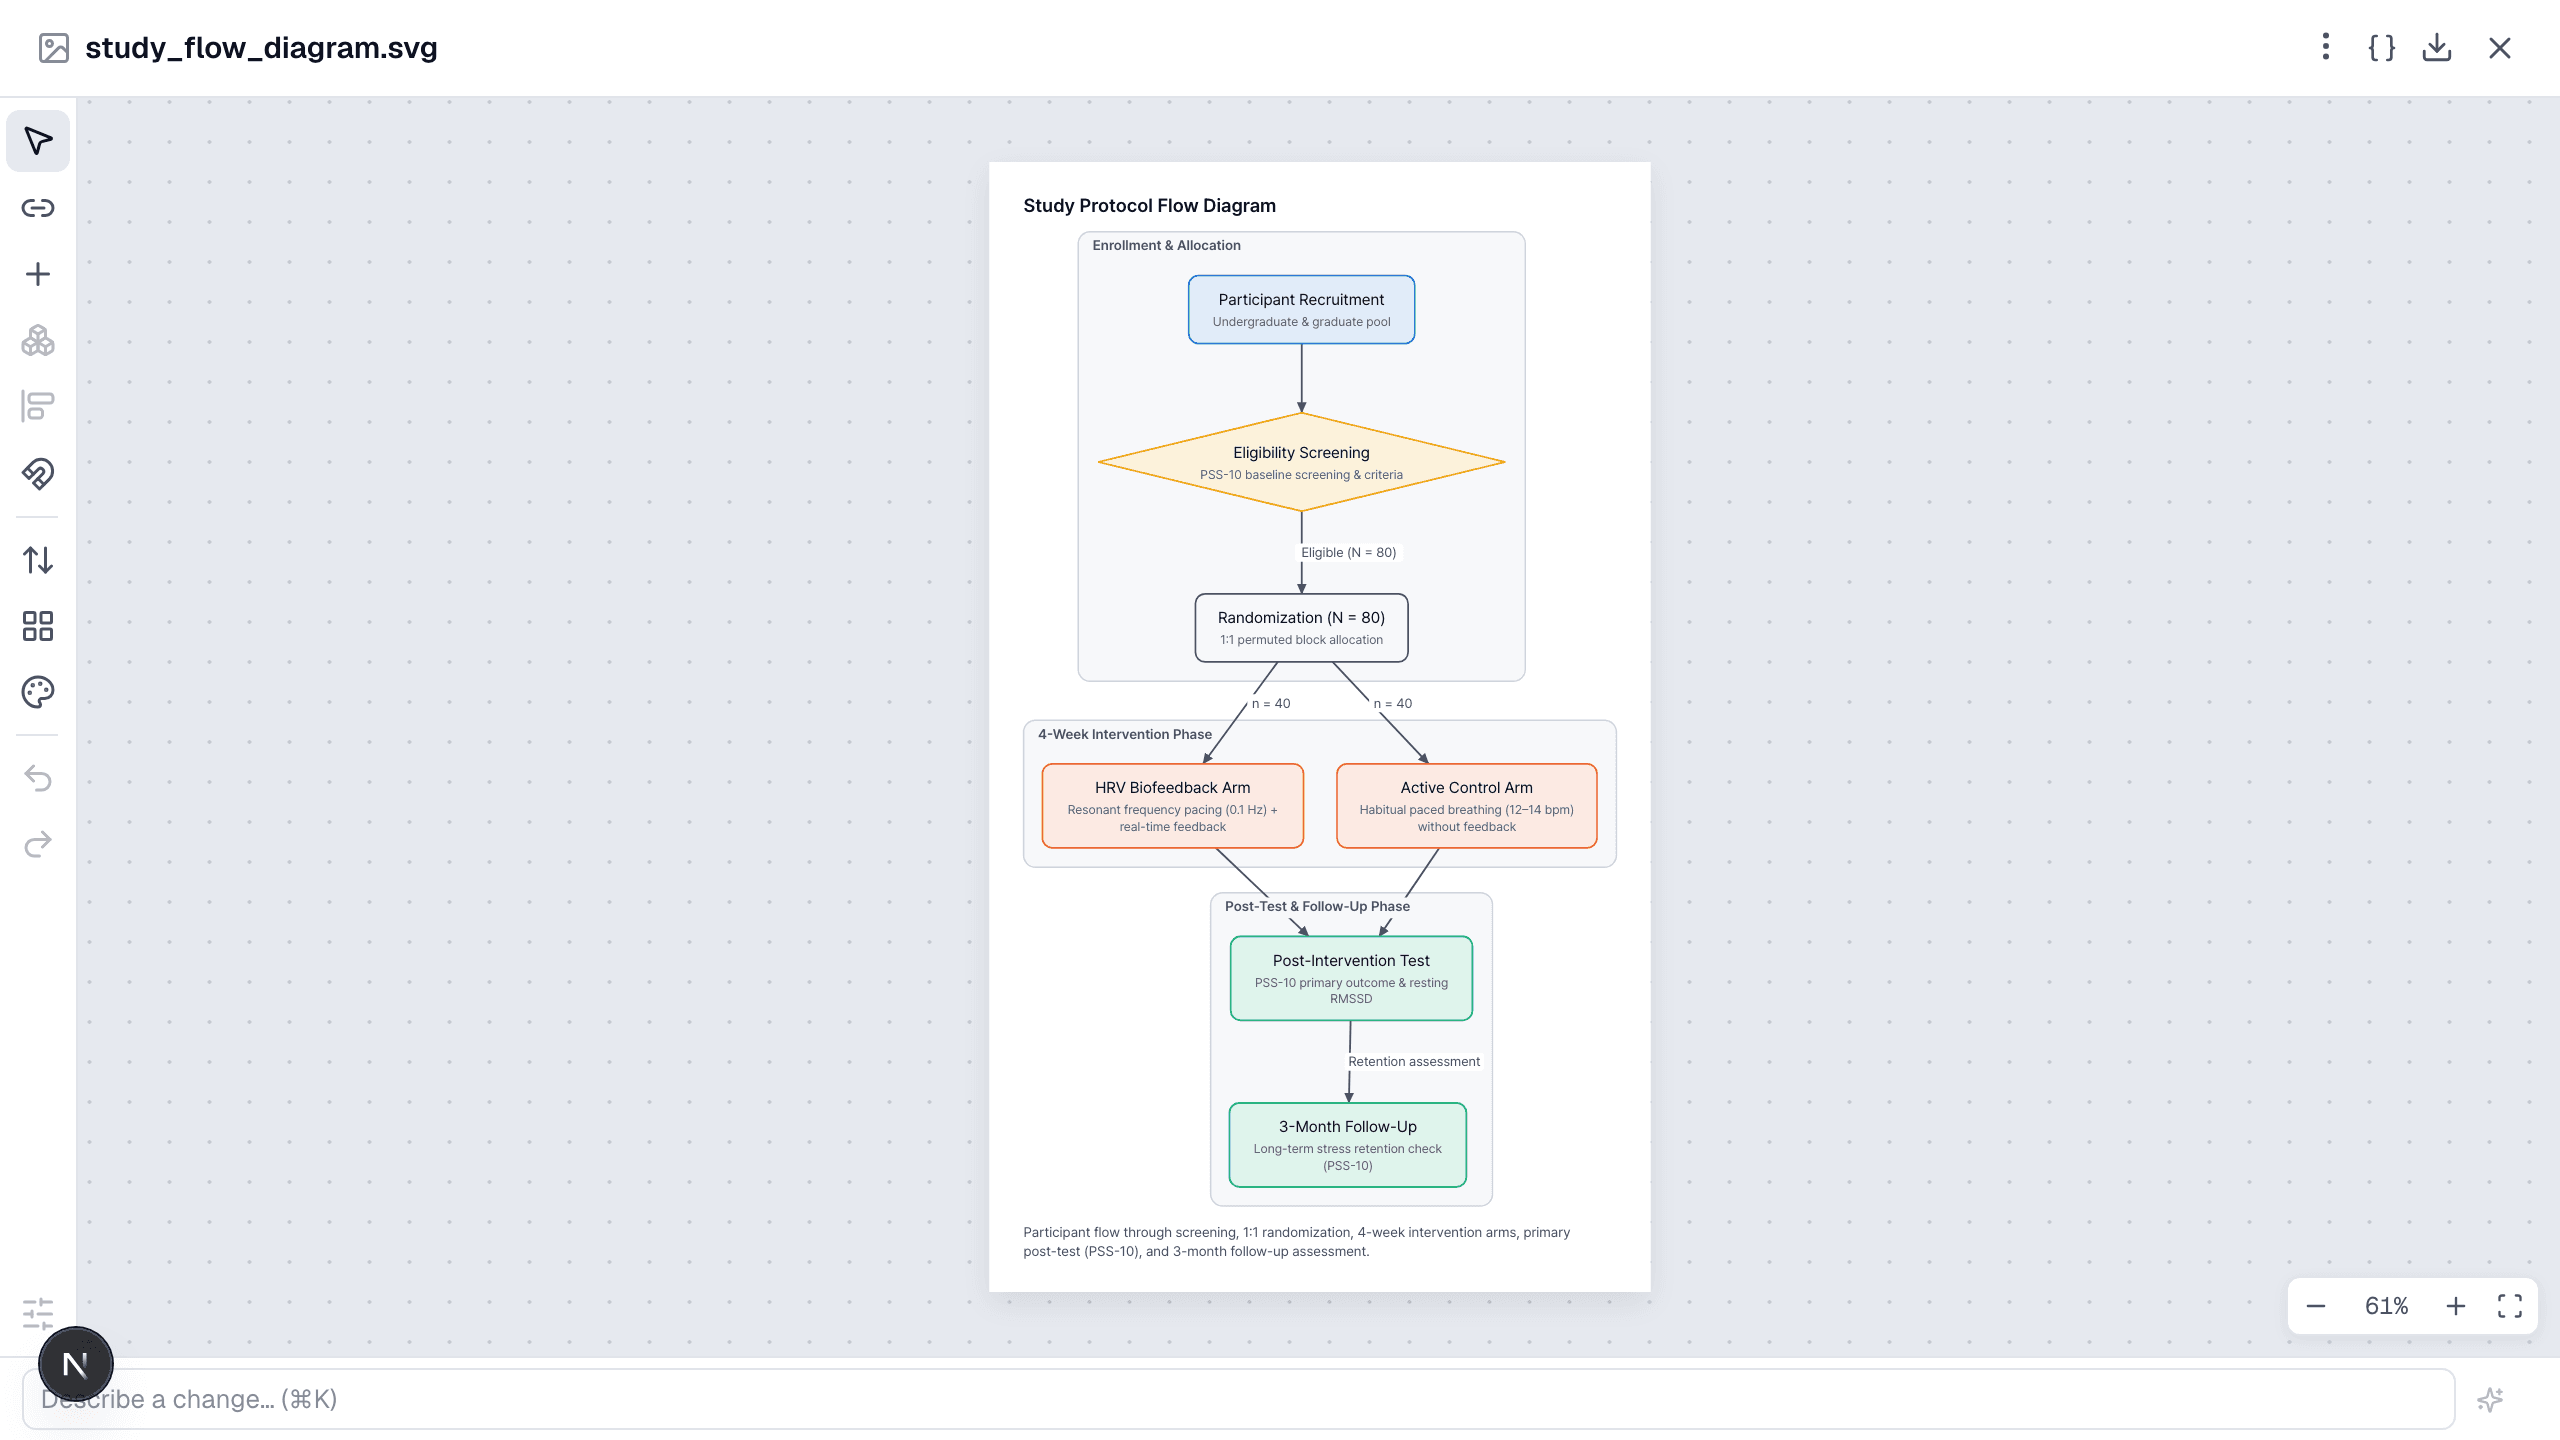
Edit in the workspace
Press Edit in workspace on any SVG artifact to open the editor: move and resize elements, change colors and fonts, relabel, align. Undo/redo is available, and each save is a new revision.
Export
Download as SVG, PNG, PDF or PPTX (shapes and text stay editable in PowerPoint). Ask for a specific size or DPI in the request when the journal requires it.
Figures from analyses
Plots made during analysis and statistics turns are artifacts too — open them, ask for style changes ("make it grayscale, label the axes in Korean") or send them to the editor.
Walkthrough: Figures: diagrams and illustrations.