Facial expressions are some of the richest behavioural data a study can collect, and some of the most laborious to code. Manual FACS coding takes a trained coder much longer than the video itself, and most labs cannot run it on every participant. Automated tools help, but getting their output into the same place as your design, your statistics and your write-up usually takes a stack of scripts.
Neutropic measures facial action units (AUs) directly from a video or a photo, in the same workspace where the rest of the study lives. This post covers what the face_expression tool computes, what it returns, how to compare expression across conditions and participants, and where the approximation ends. The screenshots come from the face-video session in the example project (Example · Skills by domain) and from one new chat measuring a still photo.
What you can upload
- Video. MP4, MOV, WebM, AVI, MKV or M4V. The in-app preview uses your browser's player, so H.264 MP4 is the safest choice for watching the clip; the analysis decodes the file on the server either way.
- Photos. PNG, JPG, WebP or BMP.
- Existing AU output. If you already ran OpenFace or a similar tool, upload its CSV. The data-analysis skill treats it as a table, and the statistics tools work on it directly.
Then describe what you want:
/analyze Extract facial action units and expression over time from session_03.mp4. Plot the strongest AUs, save the per-frame table, and summarise which AUs are active and when.
How the measurement works
The tool runs Google's MediaPipe FaceLandmarker on each frame. It fits a face mesh and returns 52 blendshape scores, which describe how far parts of the face have moved (mouth corners up, brows down, jaw open and so on). Each score runs from 0 to 1.
Neutropic maps those blendshapes onto 17 FACS action units: AU01, AU02, AU04, AU05, AU06, AU07, AU09, AU10, AU12, AU14, AU15, AU17, AU20, AU23, AU25, AU26 and AU45 (blink). Where FACS has one AU and the mesh has a left and a right score, the larger one is used. Two mappings are worth knowing:
- AU06 (cheek raiser) is read from both the cheek-squint and eye-squint scores, because the mesh splits the Duchenne marker across the two. AU07 (lid tightener) also reads eye squint, so AU06 and AU07 often come out identical.
- AU25 (lips part) is the inverse of the mouth-close score.
On top of the AUs, the tool adds:
- Emotion labels from EMFACS-style AU combinations (for example AU06 + AU12 for happiness). A label is only given when its core AU is active (AU12 for happiness, AU15 for sadness, and so on) and at least half of its AUs are active. The default activity threshold is 0.3. For video, you get the share of frames carrying each label.
- Head pose. Yaw, pitch and roll in degrees, from the face mesh.
For video, frames are sampled at 5 per second by default. You can ask for a different rate.
What you get back from a video
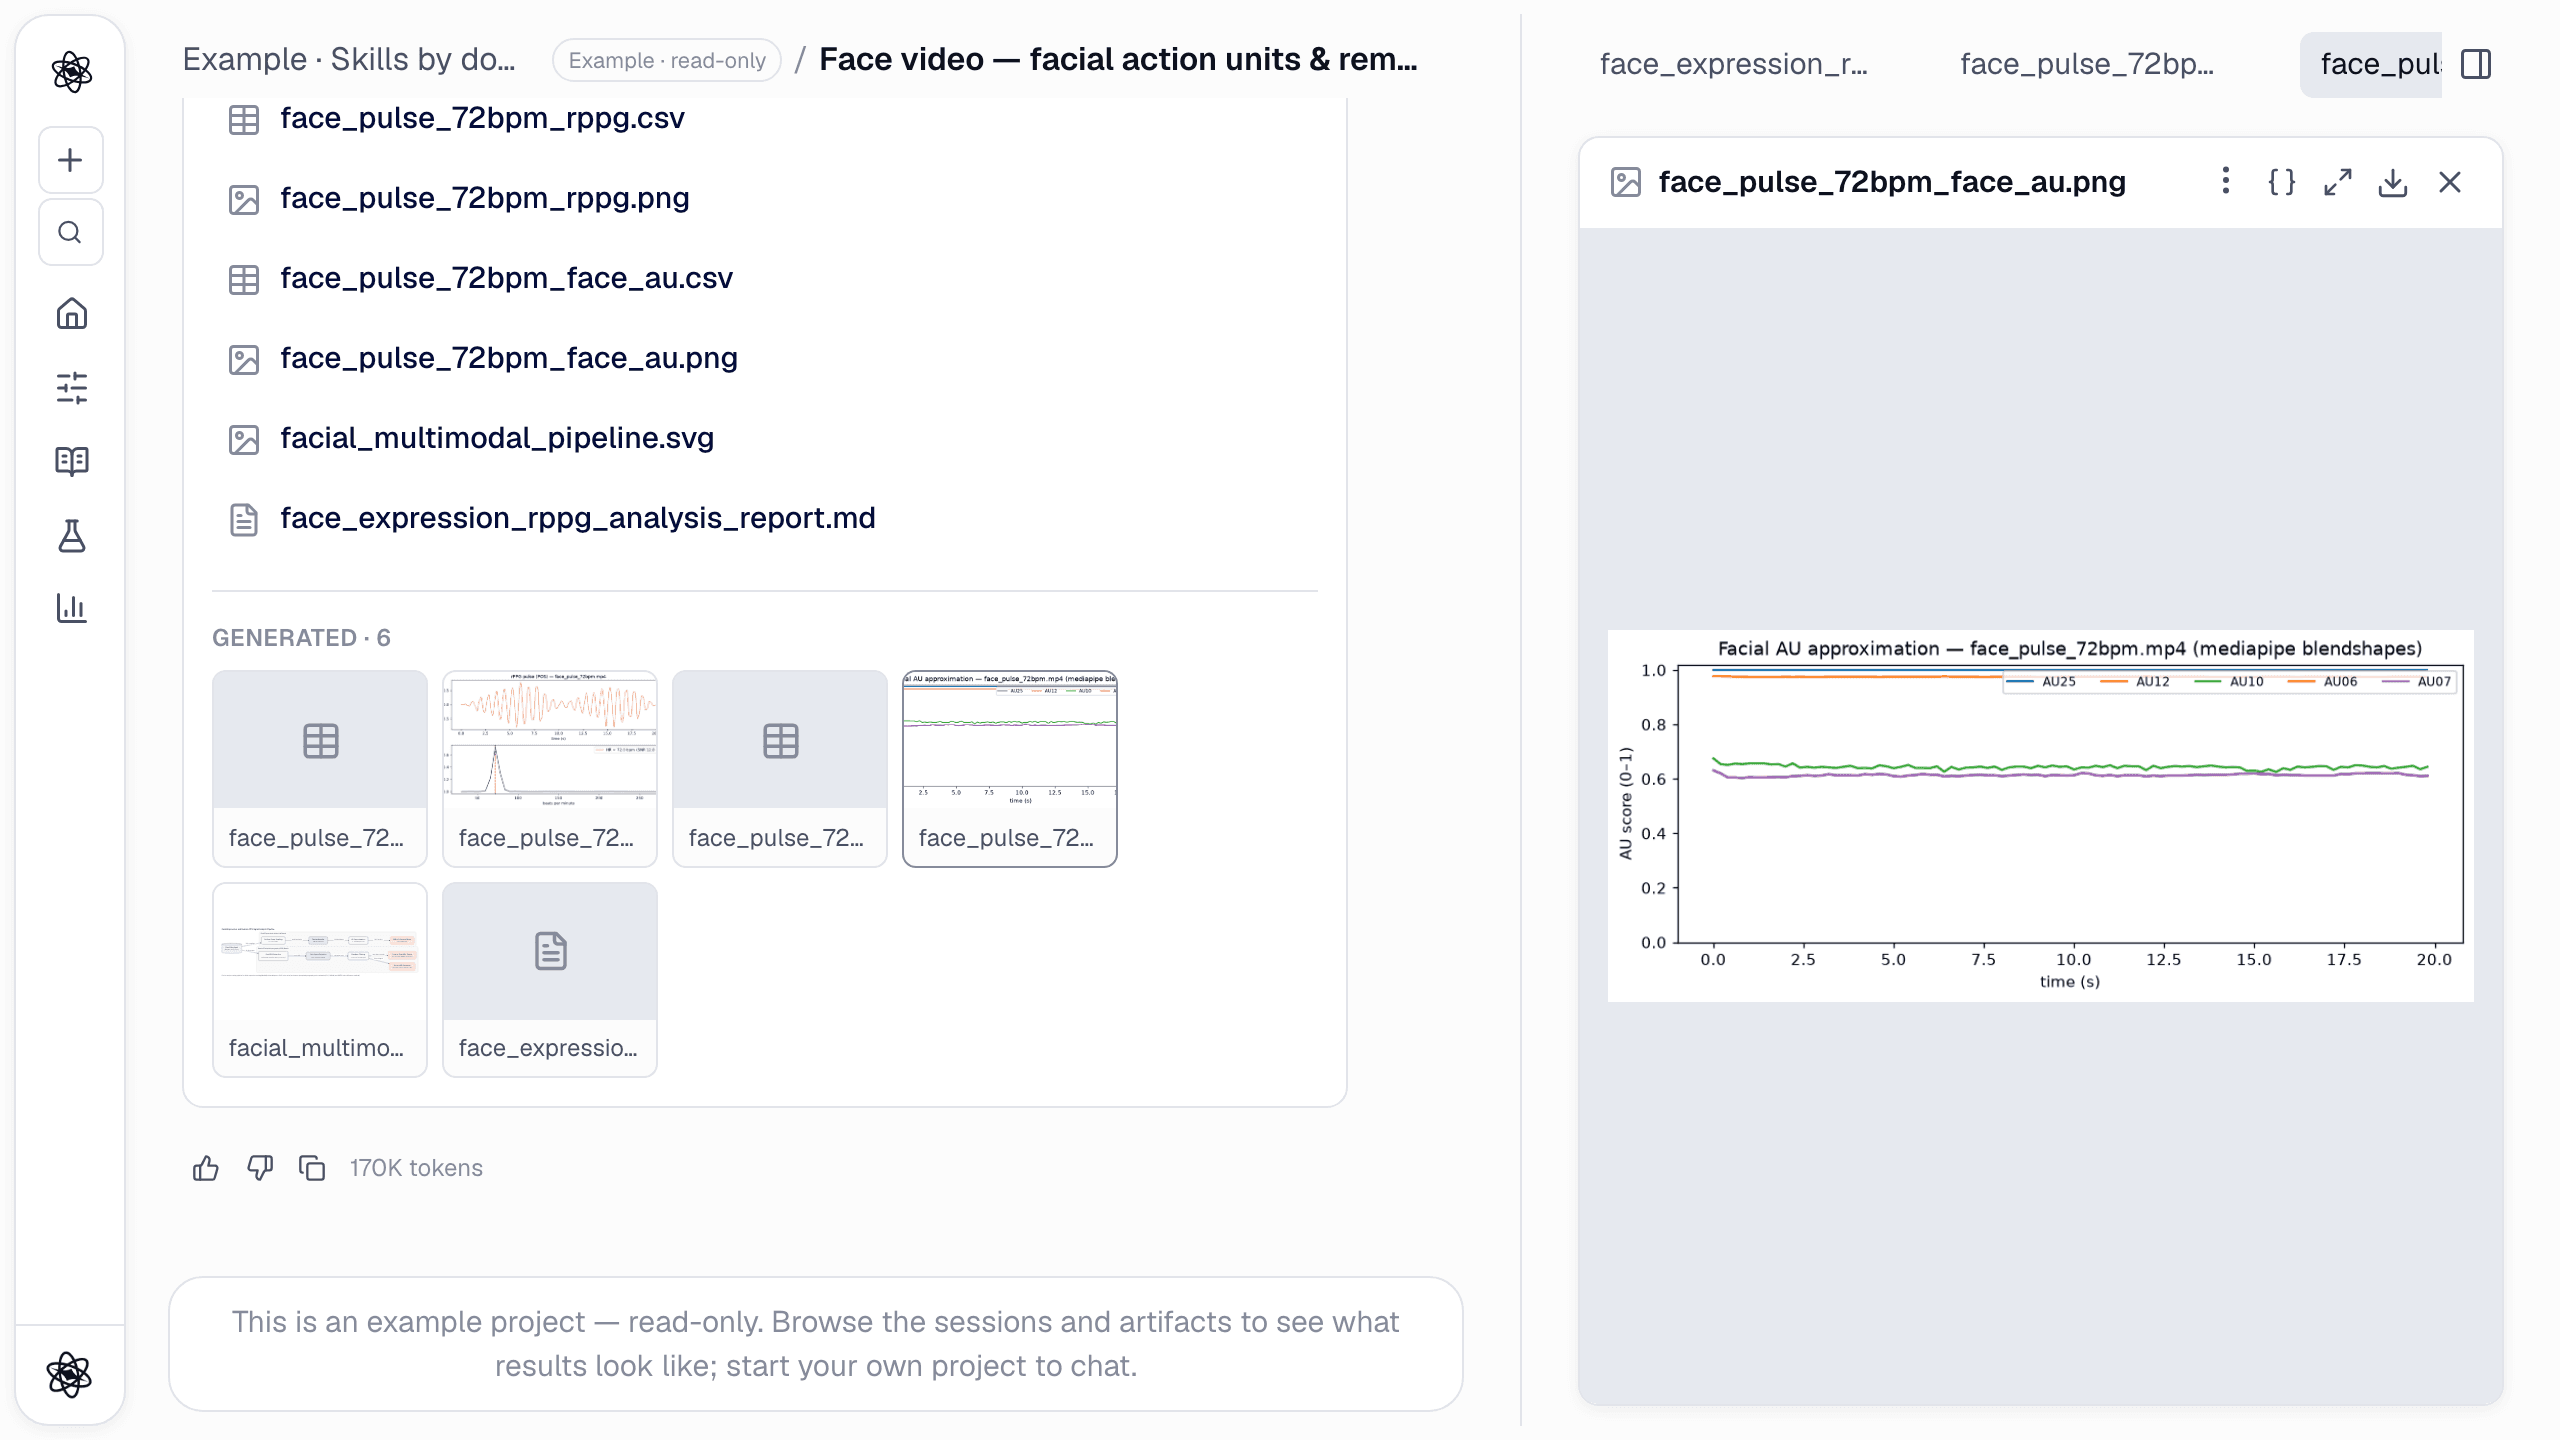
- A figure (
*_face_au.png) with the five AUs that reach the highest peaks, plotted over time on the 0–1 scale. - A per-frame table (
*_face_au.csv): time, whether a face was found, all 17 AU values, yaw, pitch, roll and the emotion labels for that frame. - Summary numbers: mean and peak for every AU, the list of active AUs, emotion shares and mean head pose.
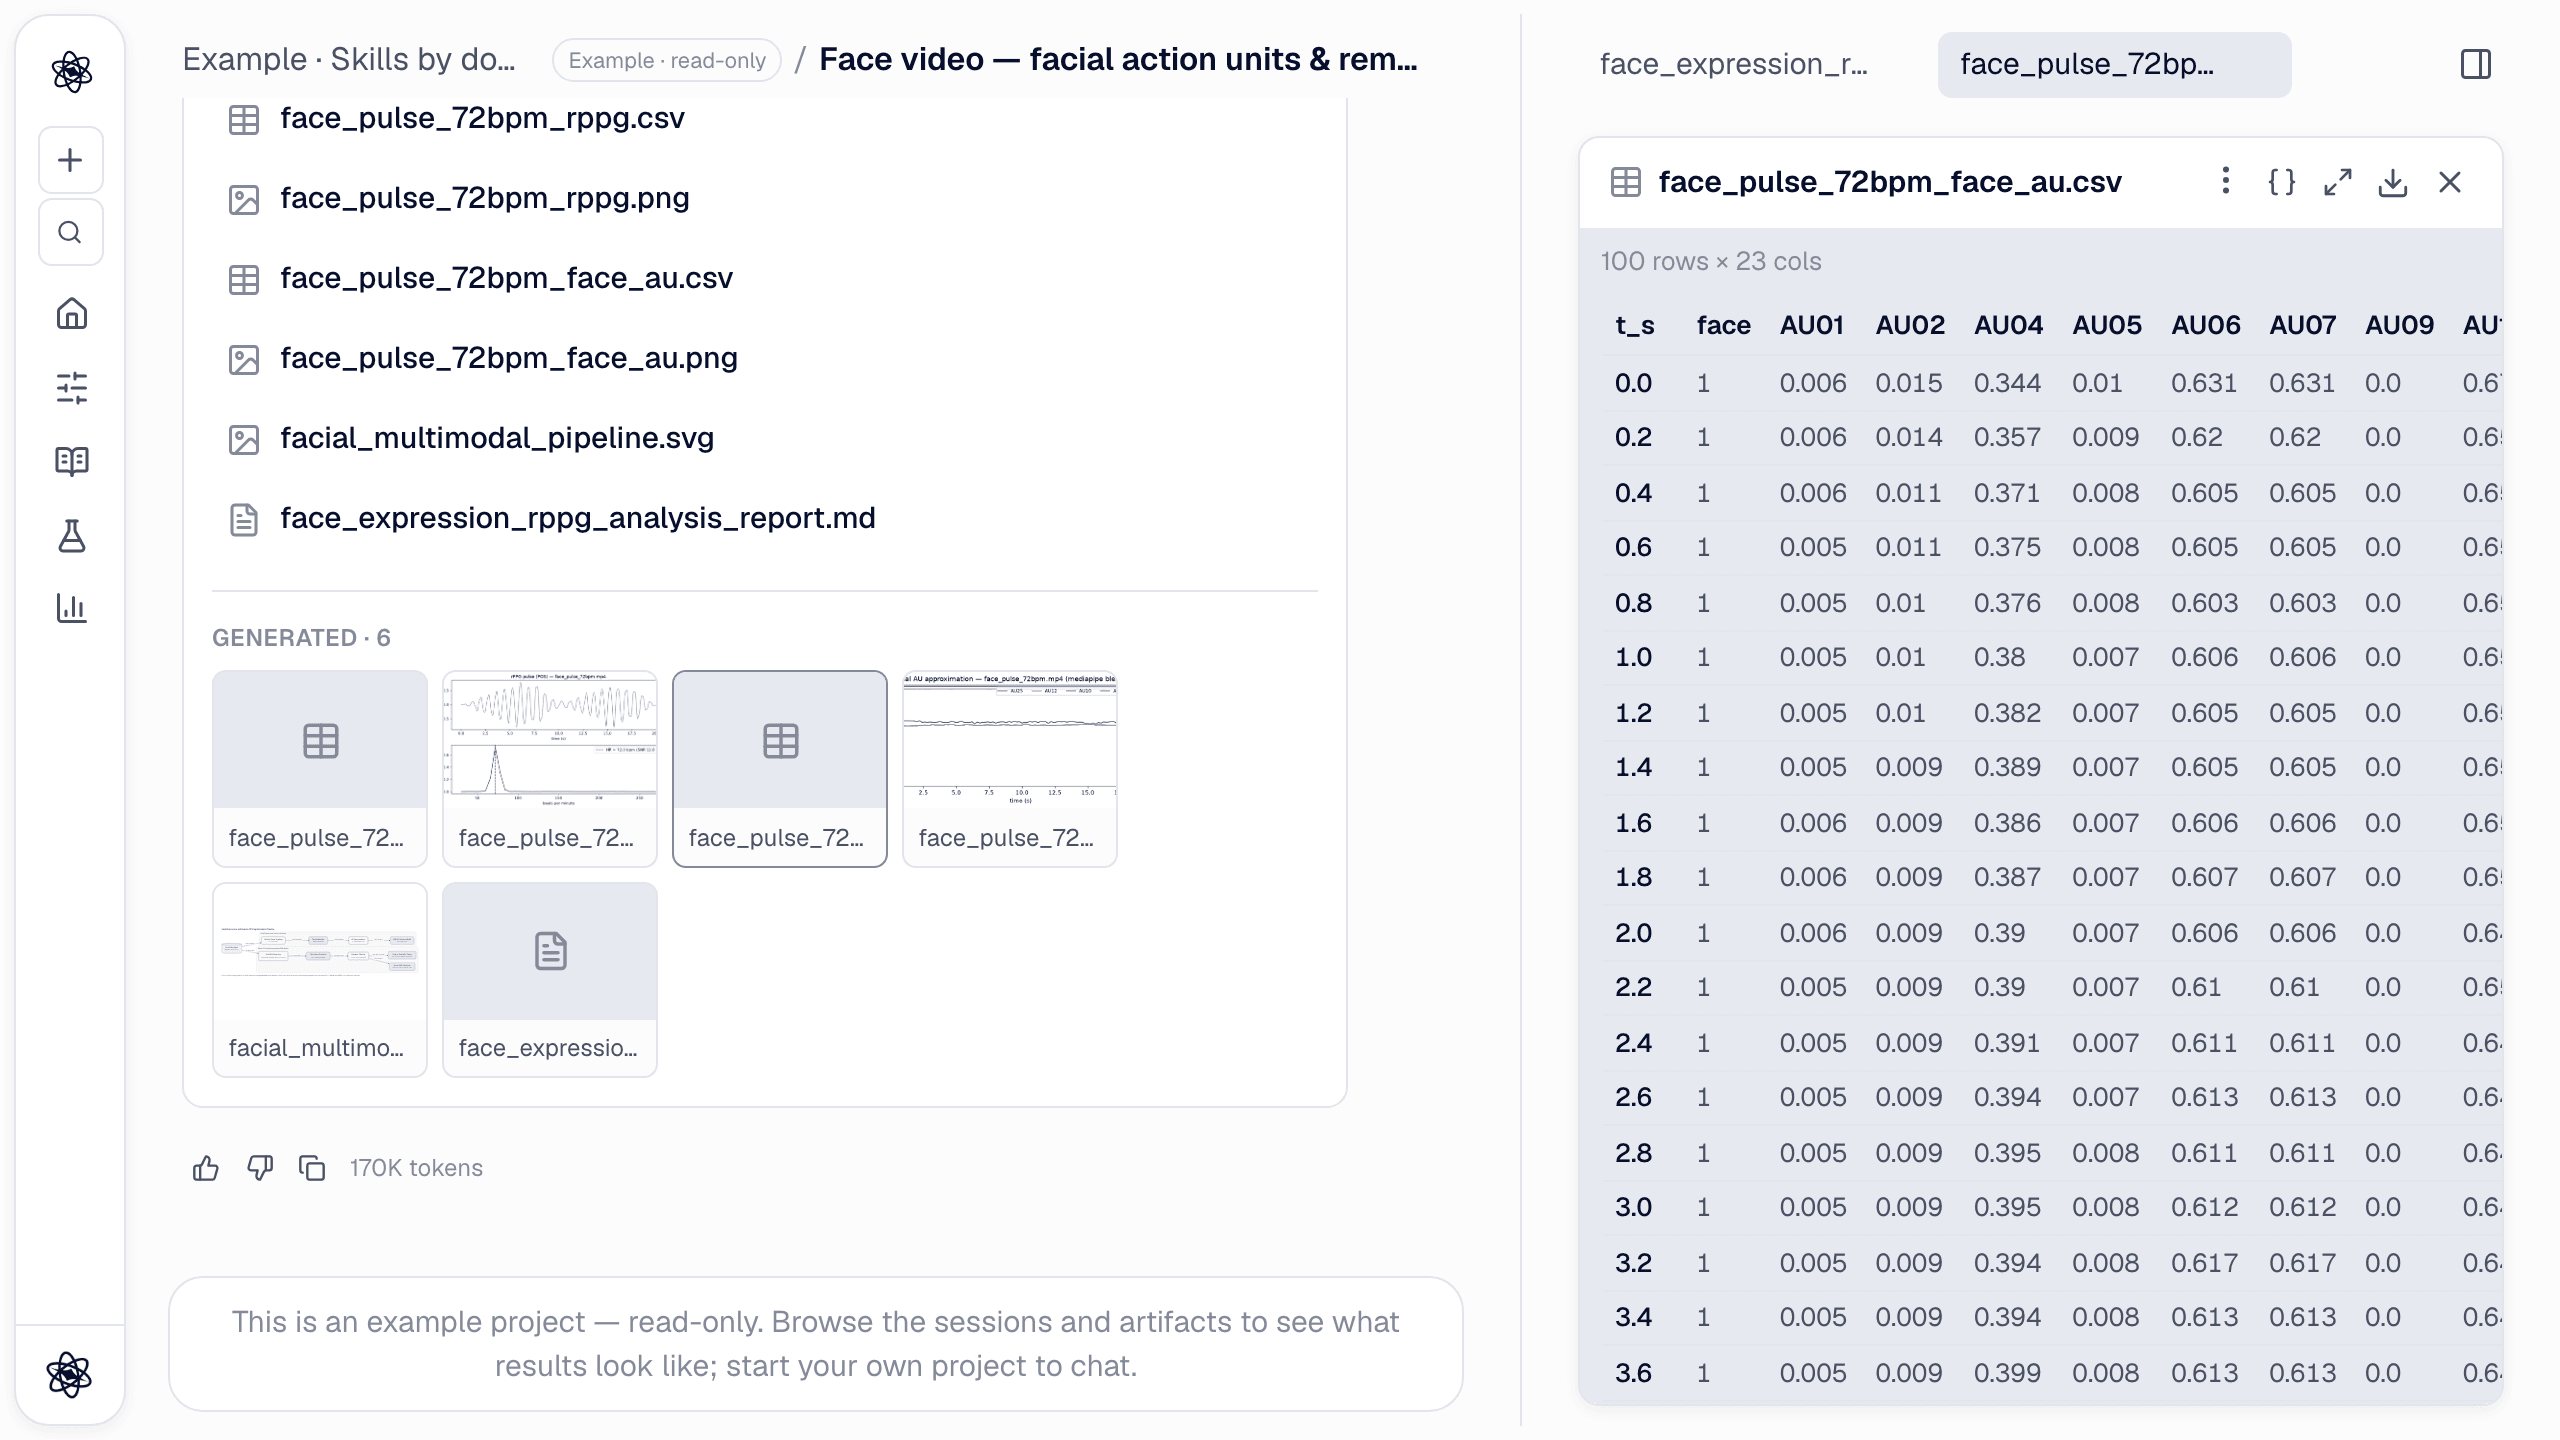
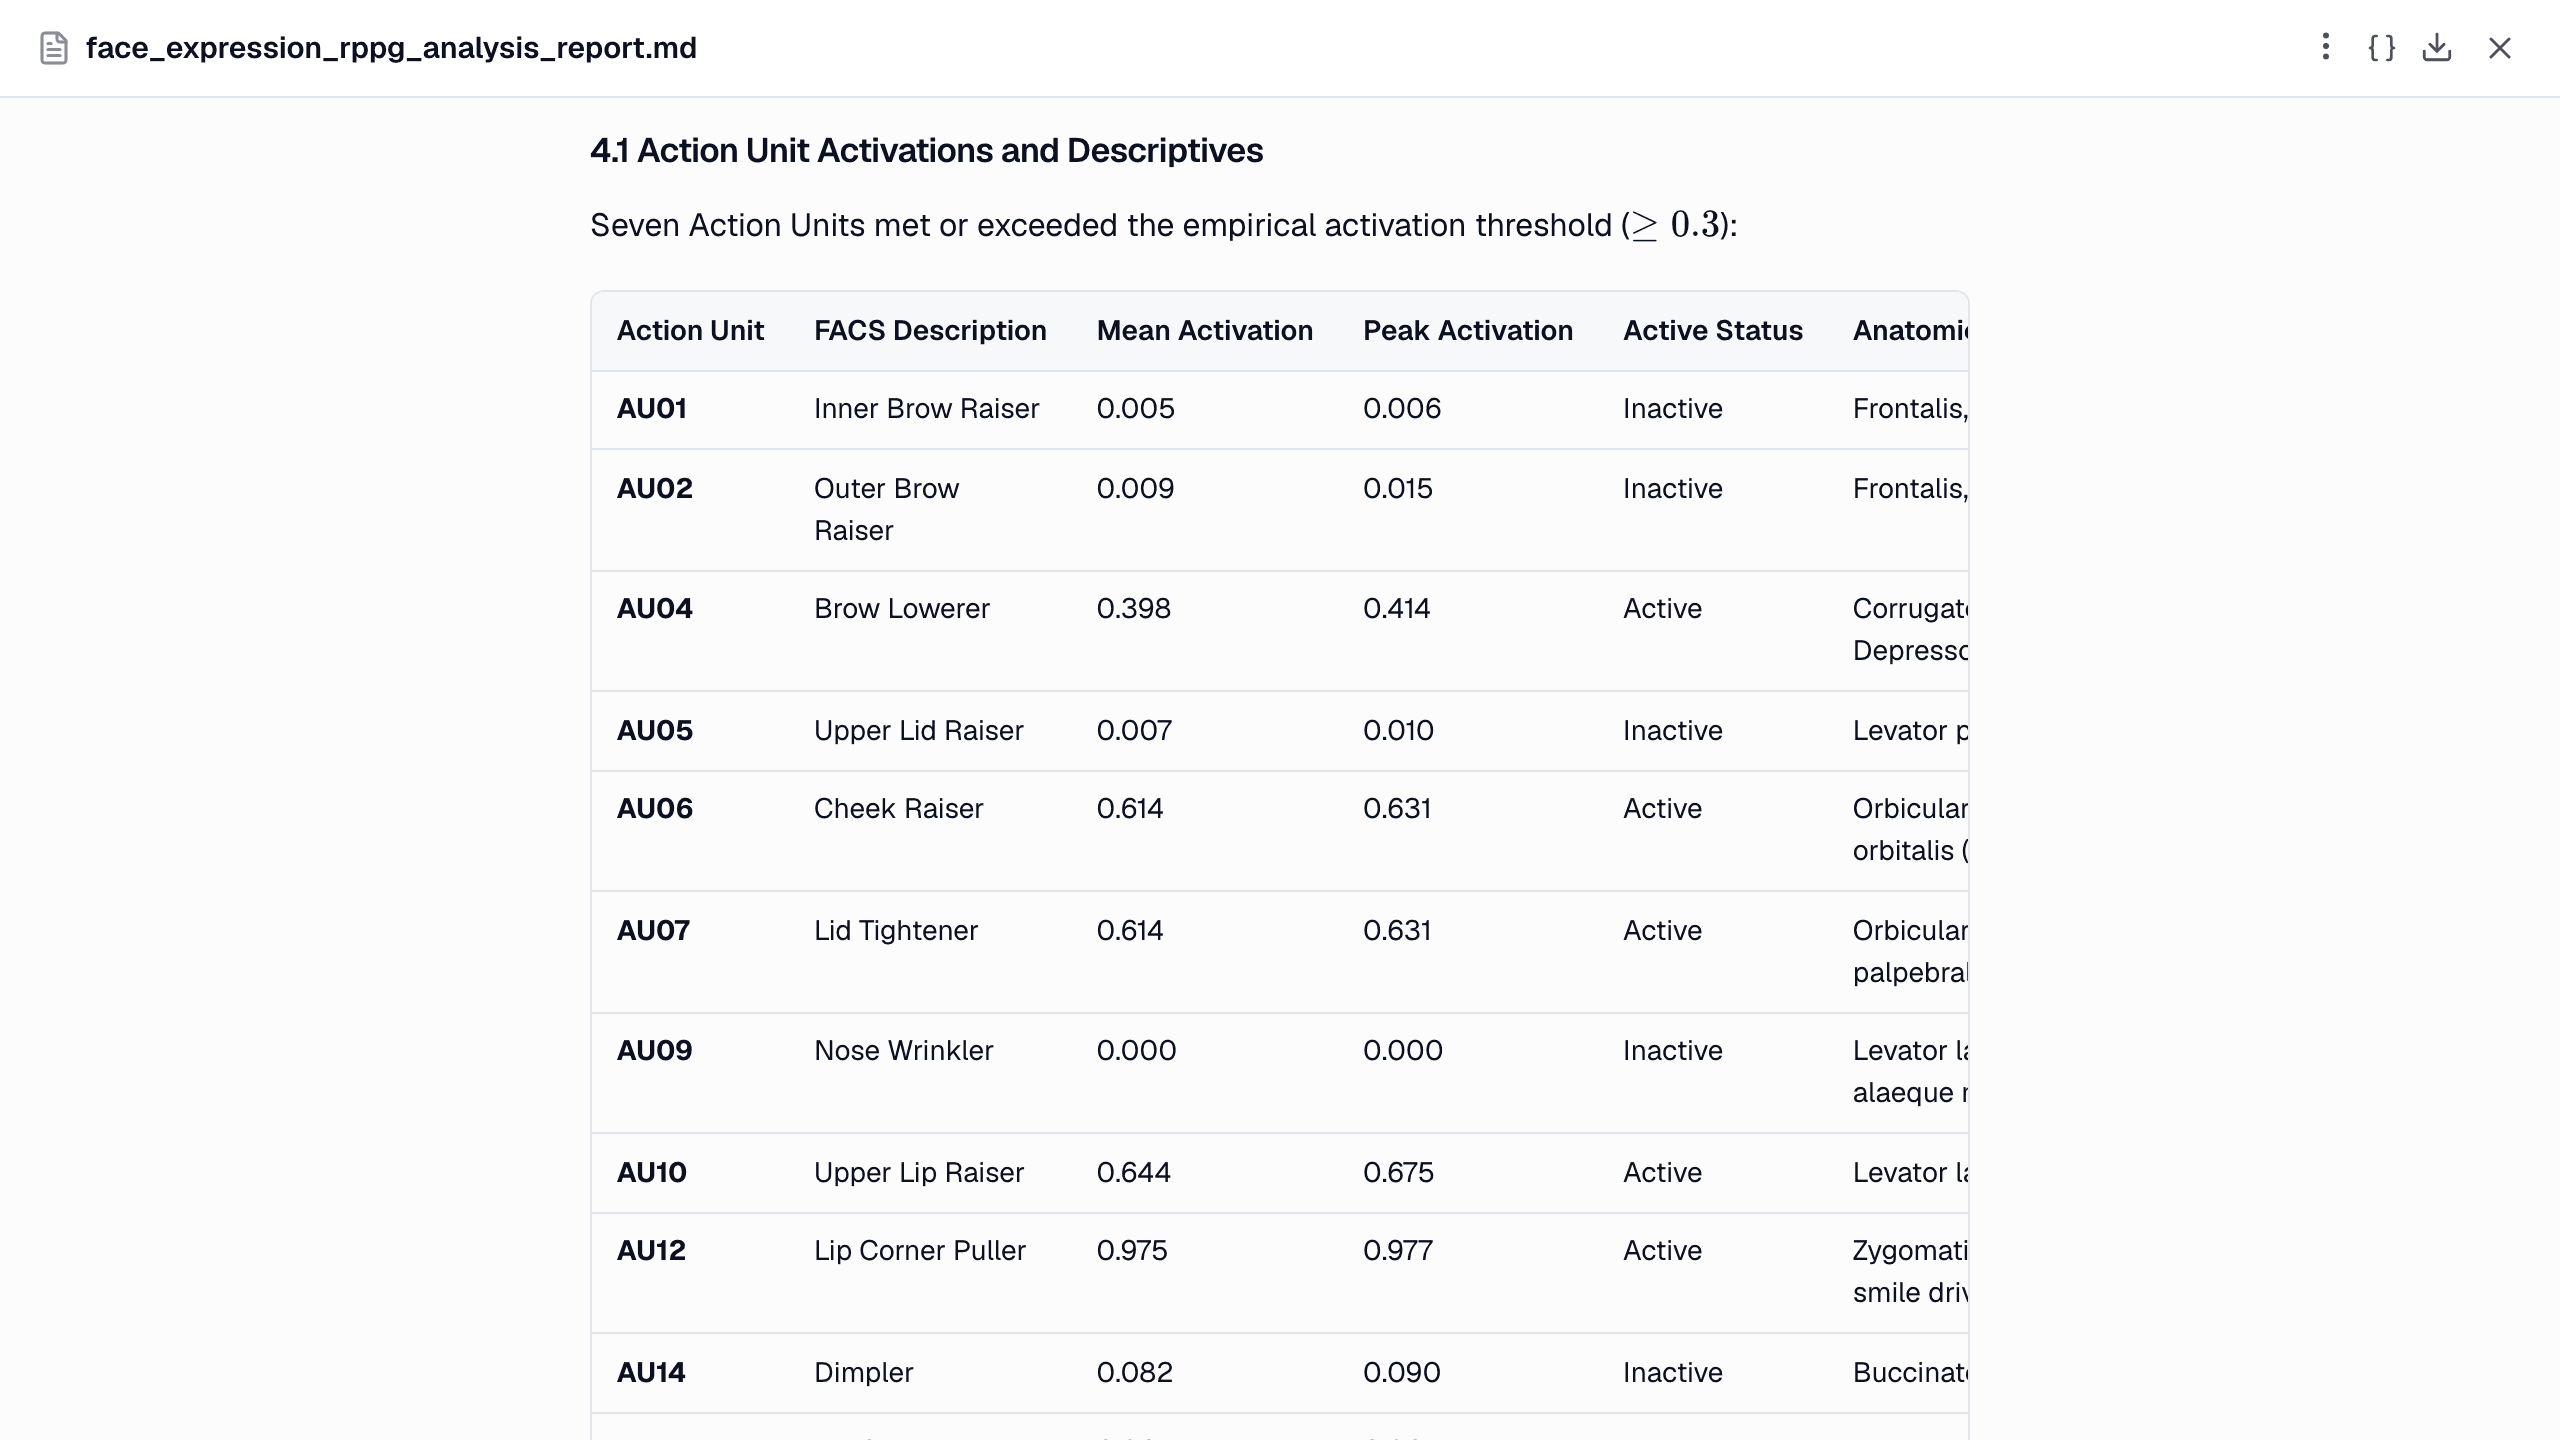
The report puts the mean and peak of every AU in one table and marks which cross the threshold:
A still photo works too
A single image goes through the same tool. You get one row instead of a time series:
/analyze Measure the facial expression in face_smile.jpg: action units, emotion and head pose. Summarise the numbers briefly.
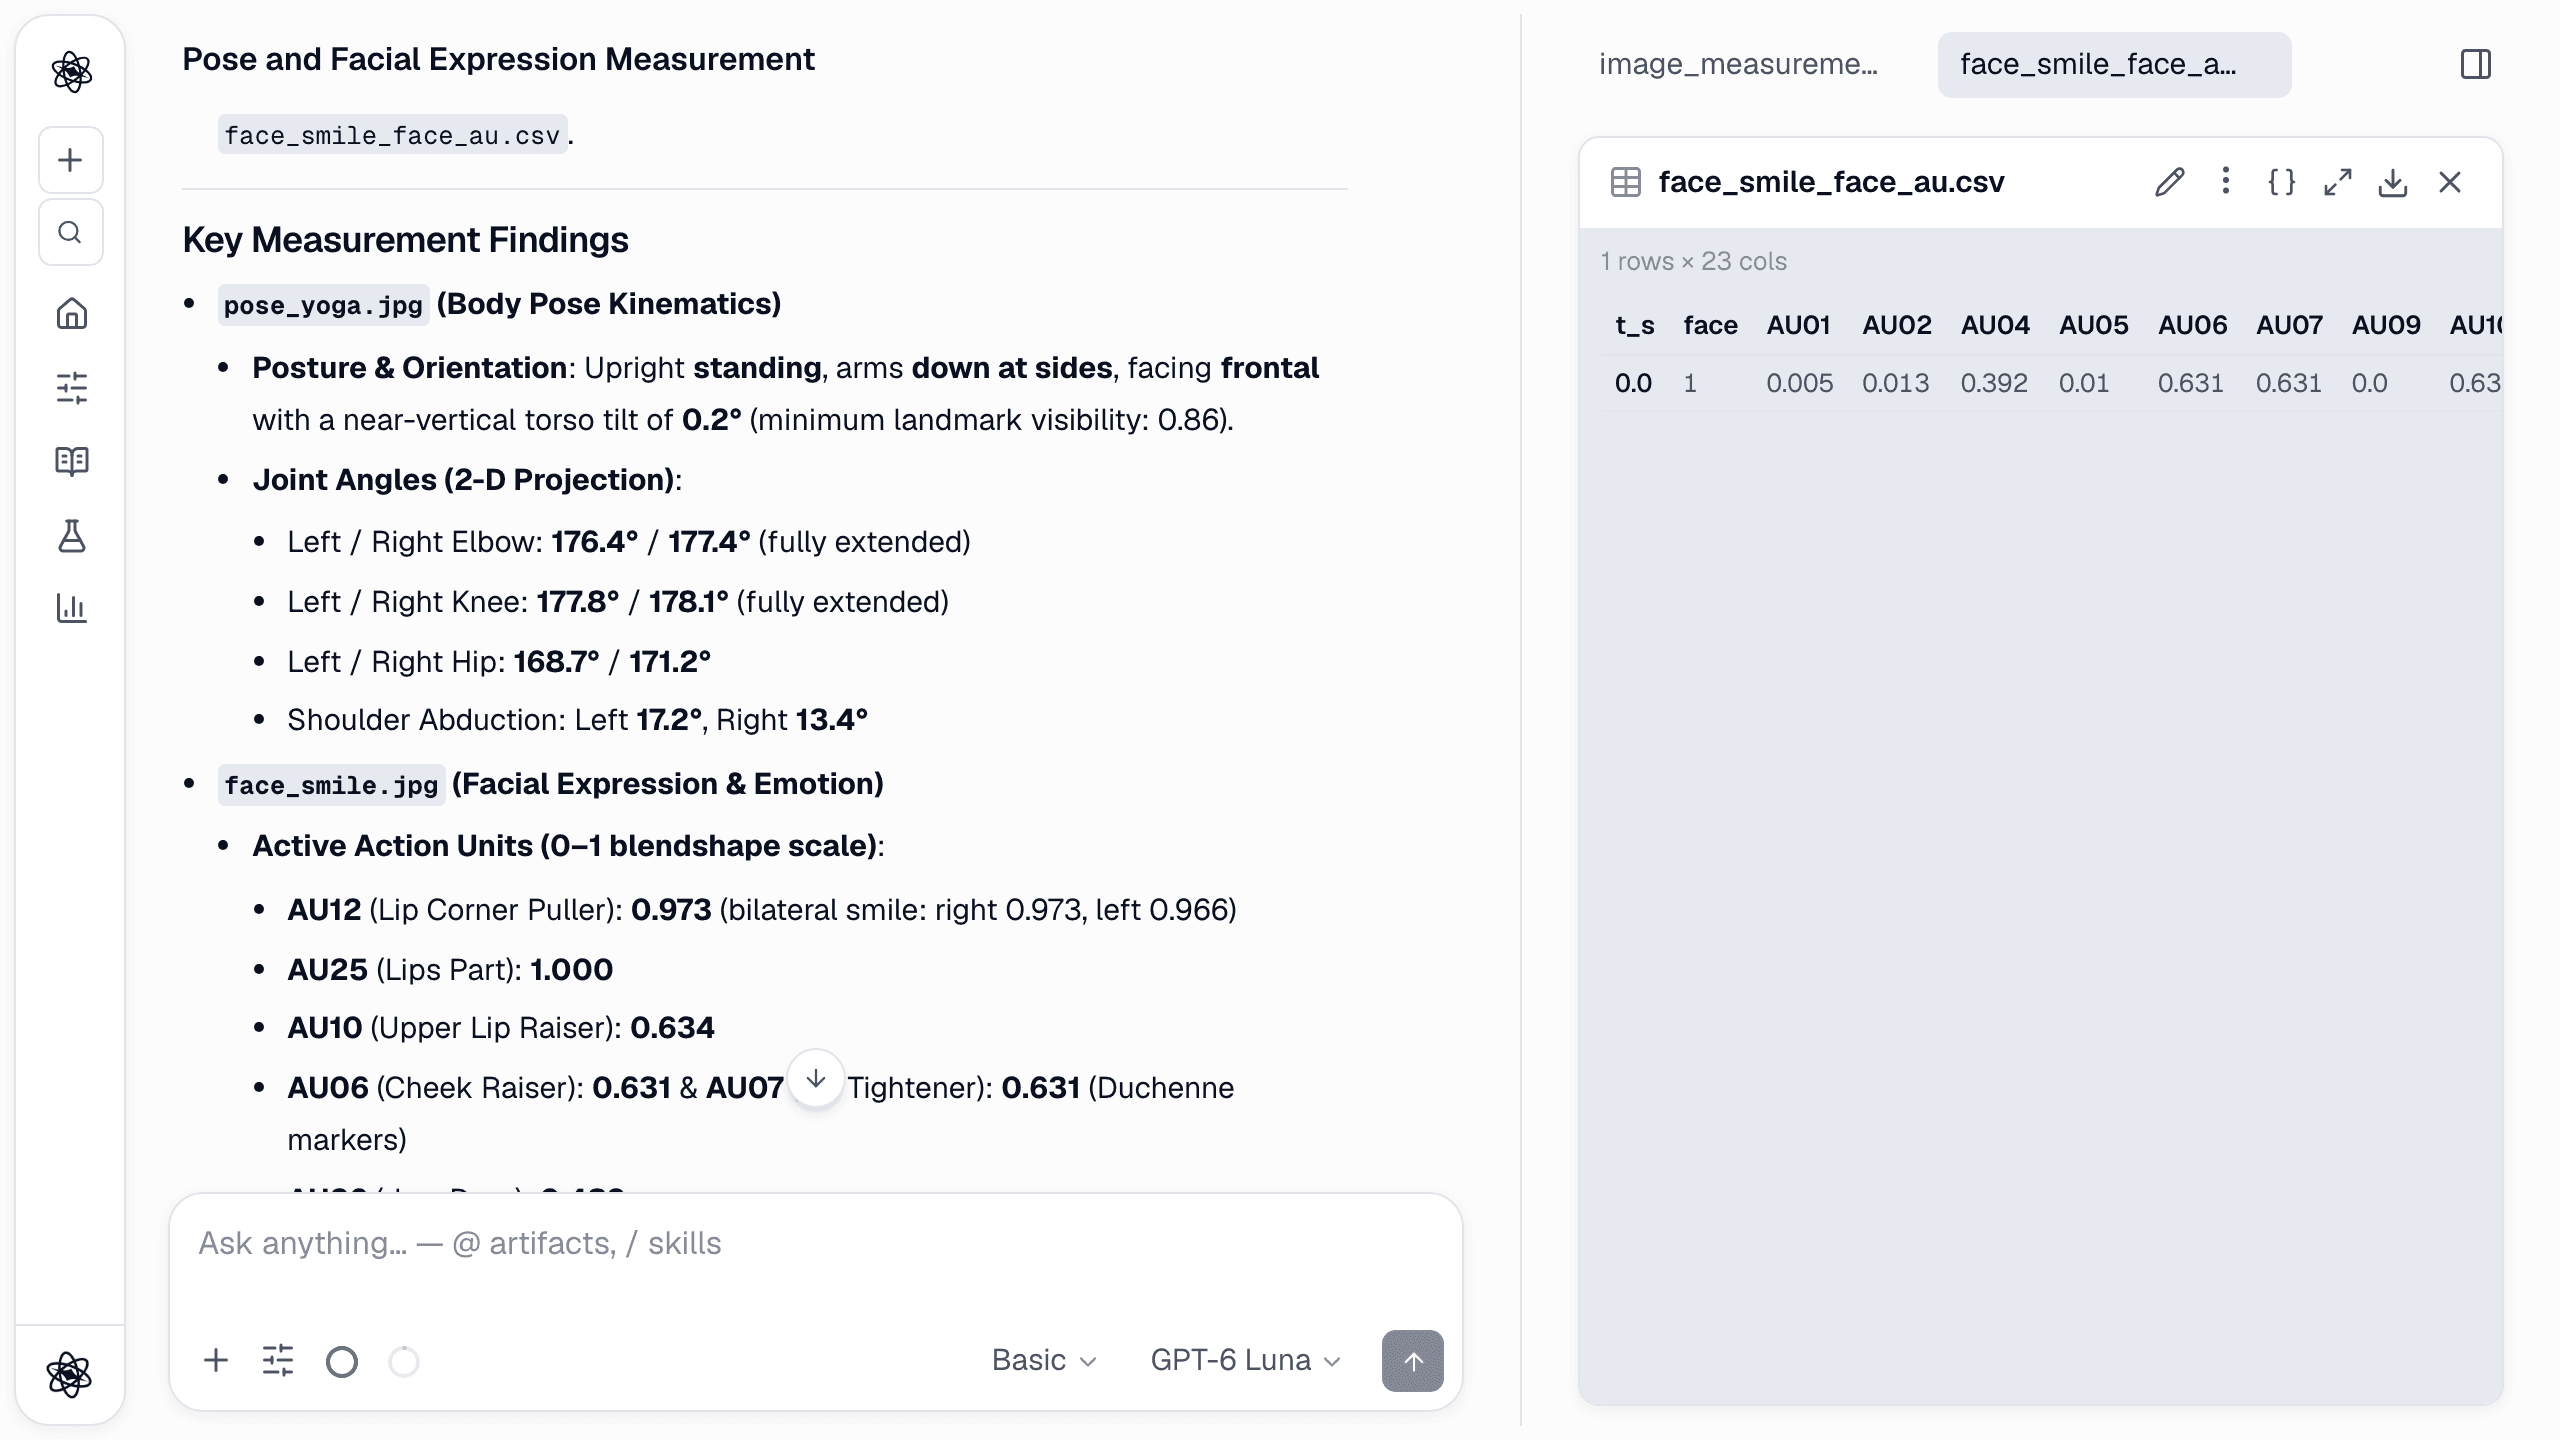
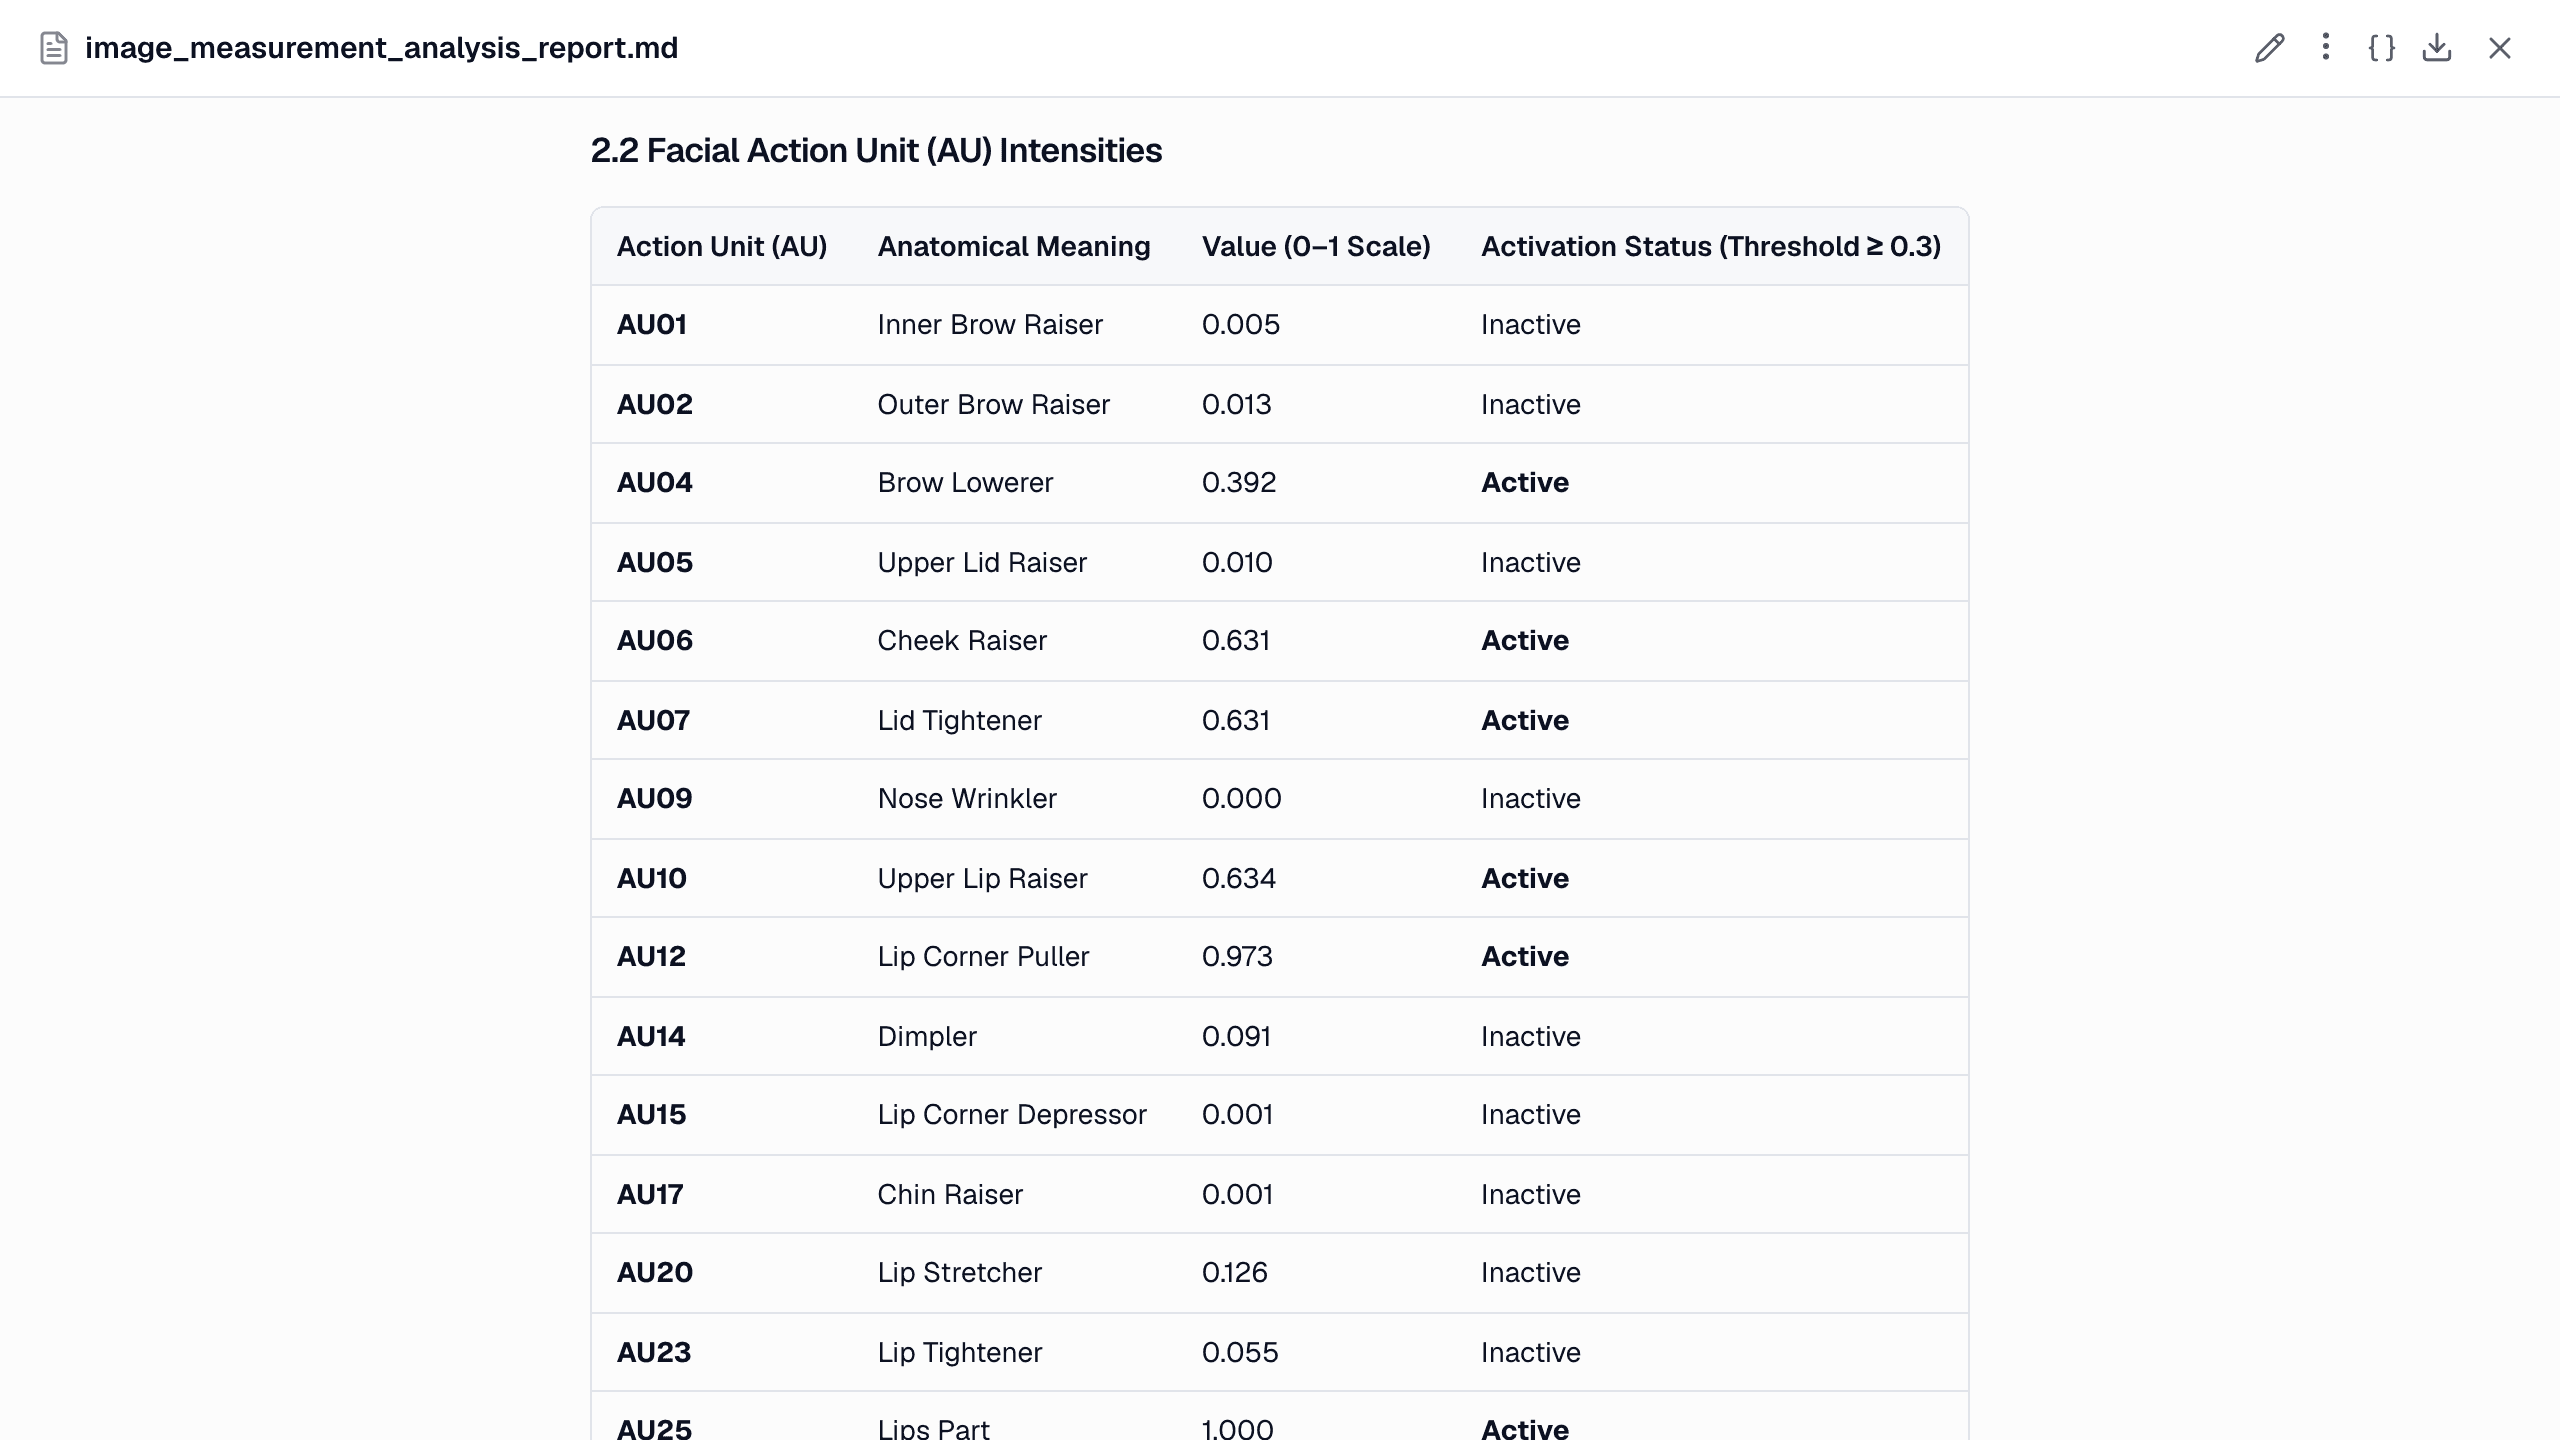
The chat answer and the report use the numbers the tool returned, and the report's sentences carry [n] citations to the analysis step that produced them. That is the difference from simply showing a photo to a chat model. A model looking at the image can describe the expression, but it cannot measure AU12 to three decimals. See image analysis for when each approach fits.
How it was checked
Our internal validation used two inputs with known answers.
- A smiling photo. The tool returned AU12 0.97 with AU06 active and labelled the expression happiness. An earlier version also attached "anger" to this photo because brow and lid AUs crossed the threshold. That is why labels now require their core AU.
- A 20-second face video built from the same smile. AU12 averaged 0.975 and AU06 0.614, and 100 of 100 sampled frames were labelled happiness.
These are sanity checks that the mapping behaves, not a validation of AU accuracy against human FACS coders. If your conclusions depend on specific AUs, have a trained coder check a subset of your own videos.
Comparing conditions and participants
Expression becomes a result when it is compared. The per-frame CSV has a time column, so any event log (stimulus onsets, task blocks) can be used to cut it into conditions. From there:
- Aggregate per participant and condition (for example mean AU12 during positive vs. neutral clips).
- Compare with the statistics tools.
compare_groupspicks a paired or independent test after checking assumptions, and a mixed model handles repeated trials within participants.
/stats au_by_condition.csv has one row per participant and condition (positive, neutral, negative) with mean AU12 and AU04. Test whether each AU differs between conditions, check the assumptions, and report effect sizes with a figure.
Research uses that fit this pattern include emotion-induction studies, UX sessions (frowning at a confusing screen, smiling at a success message), engagement during lectures or games, and pairing expression with heart rate from the same video. See heart rate from face video.
Limits, stated plainly
- An approximation of FACS. Blendshapes describe the mesh, not muscle activity. Values are on a 0–1 scale that is not comparable with OpenFace intensities (0–5), and AU06 and AU07 overlap by design.
- Emotion labels are heuristics. They describe AU patterns, not what a person feels. Report the AUs, and treat labels as a summary.
- One face per frame. The first face found is used. Crop group videos first.
- Sampling. At 5 frames per second, very brief micro-expressions can fall between samples. Ask for a higher rate if timing matters.
- Pose and occlusion. Strong head turns, masks, hands over the mouth and poor light reduce detection. Frames without a face are recorded as such, not guessed.
Filming participants: consent and privacy
Facial video identifies people, and expression data can be sensitive. Before the first upload, Neutropic shows a Before you upload research data notice. You confirm that you have the rights, consents and approvals (such as an IRB or ethics committee) needed to process the data.
- Tell participants that their face will be analysed automatically, not only recorded.
- The measurement runs on Neutropic's servers, and the model receives the numbers. Uploads stay in your private workspace until you delete them, and they are not used for training. The privacy policy explains what goes to the model provider you choose.
- Share the derived AU tables with collaborators rather than the raw video where you can.