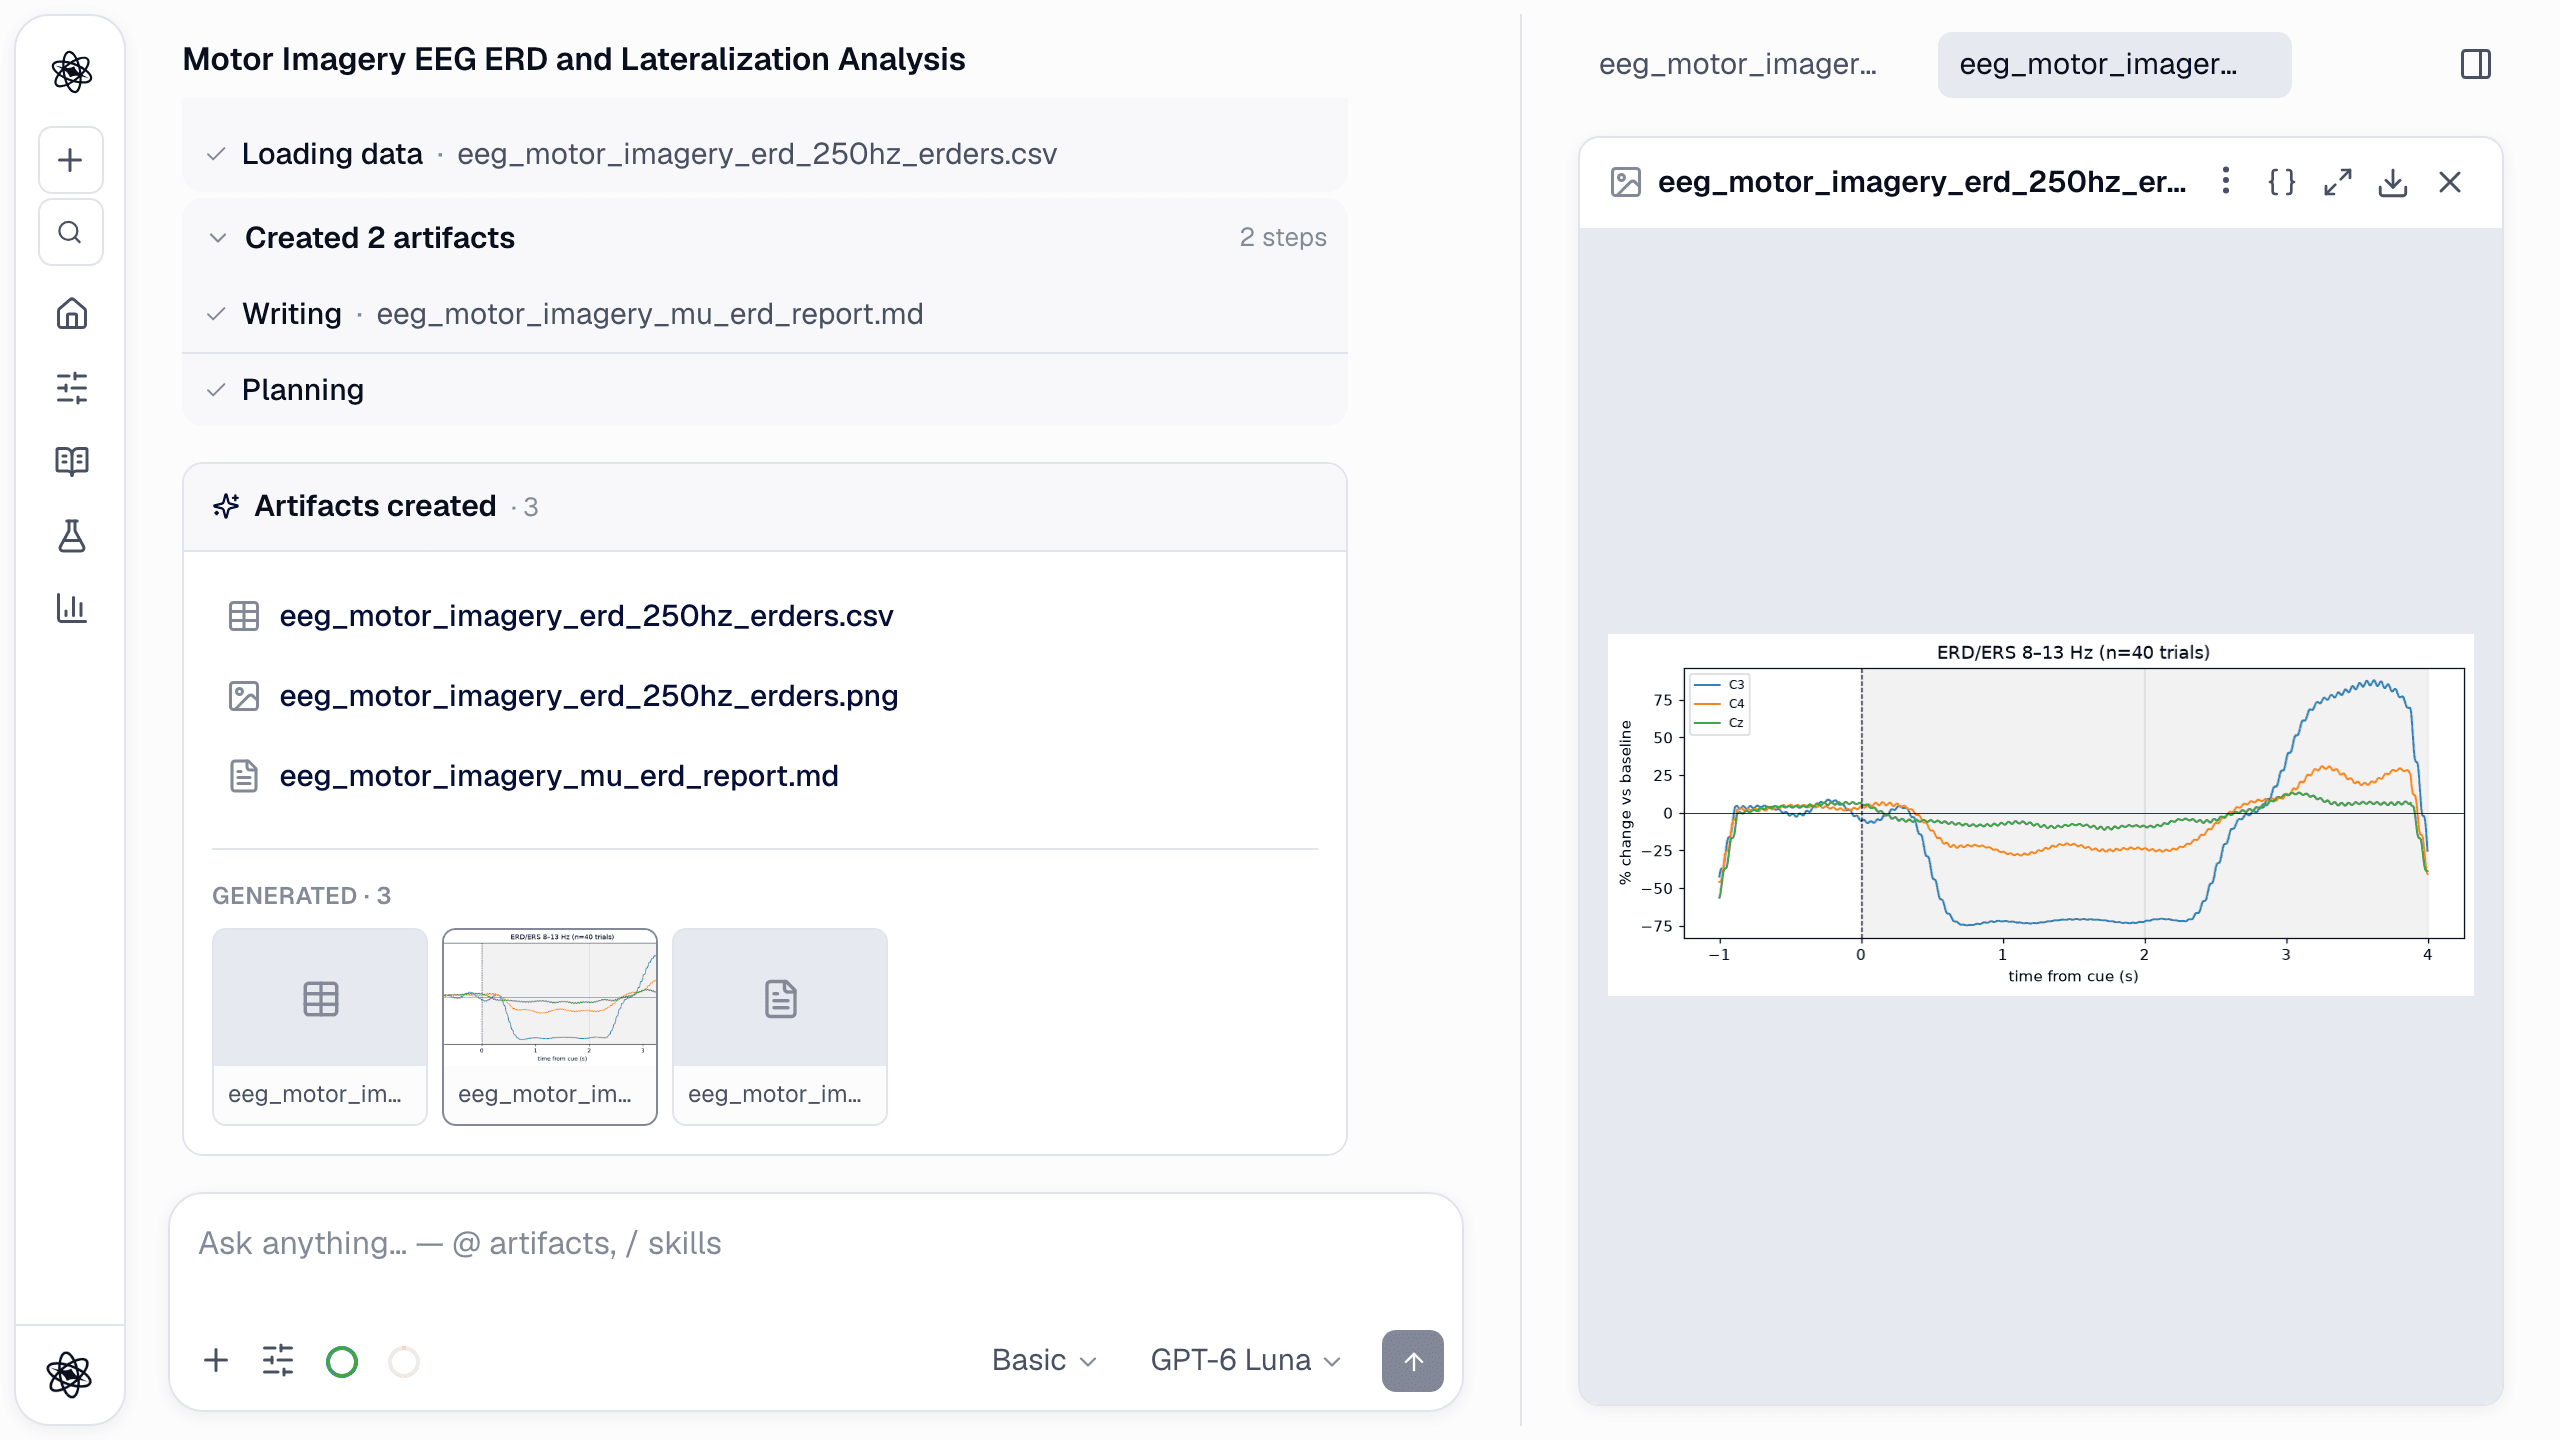
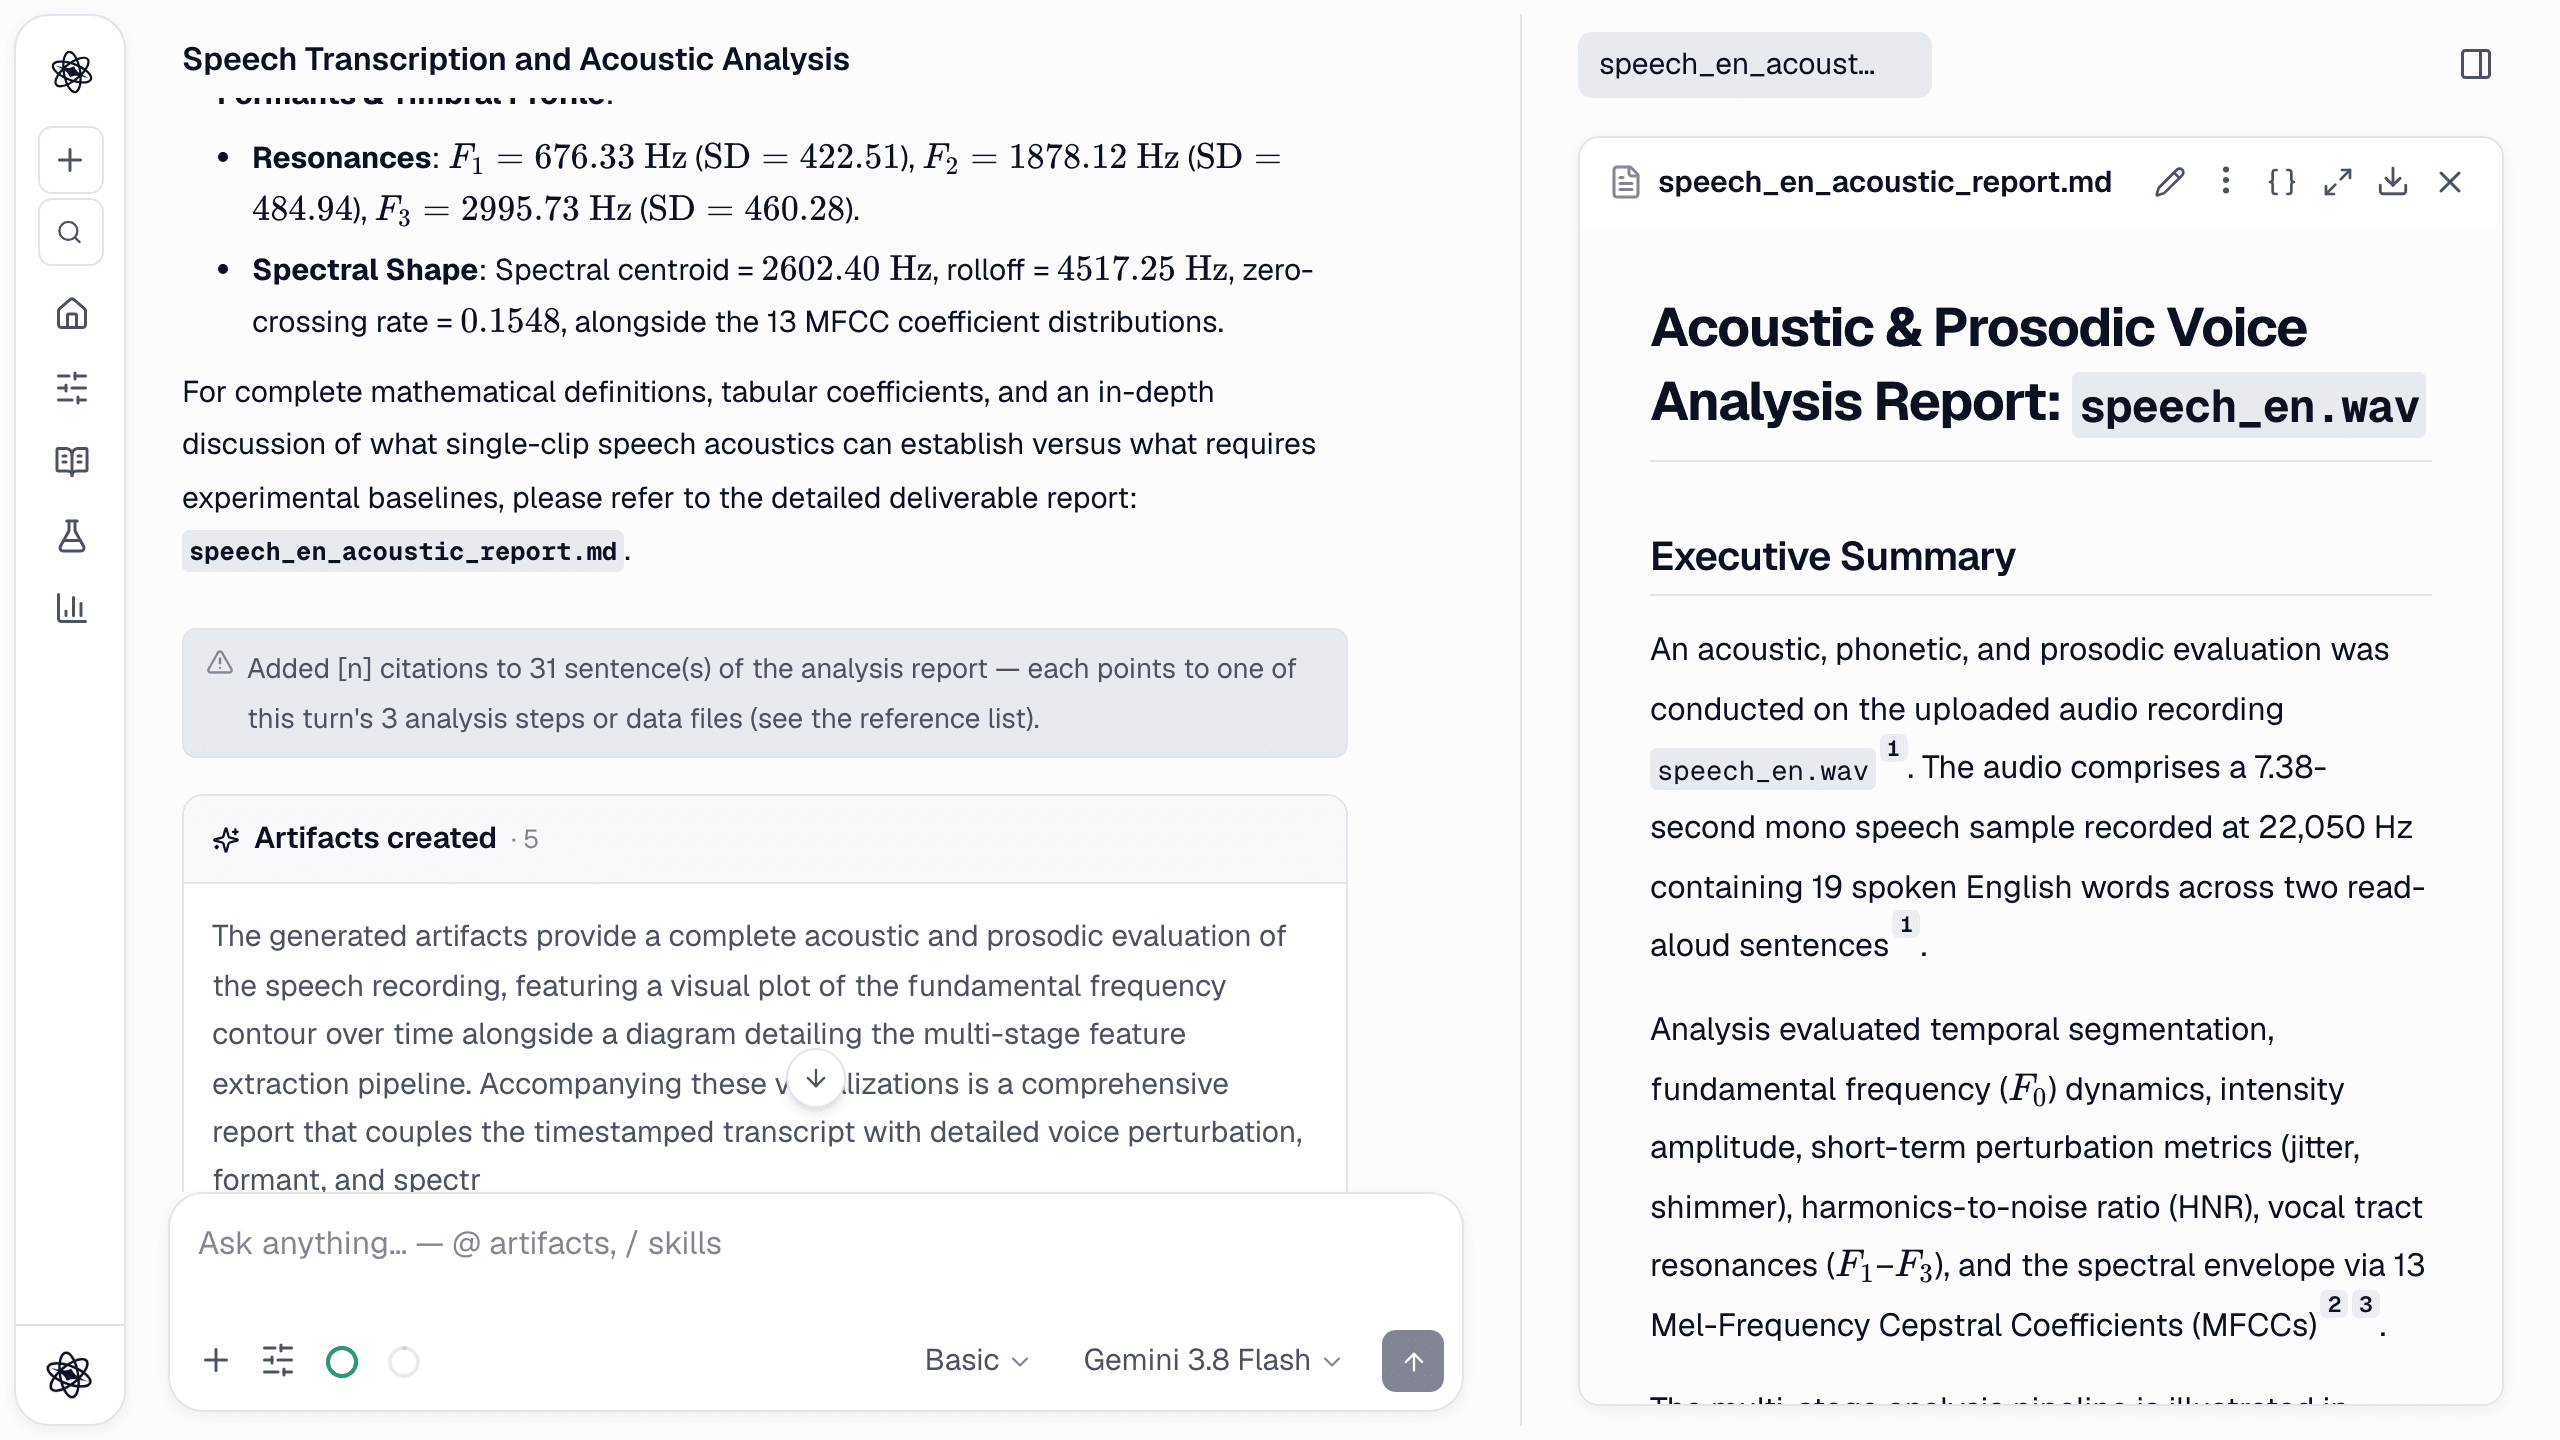
Research runs on images more often than it seems. There are figures in papers you want to check, stimuli you want described consistently, screenshots of software output, and photos of participants. Neutropic handles images in two different ways. The model can look at an image and tell you what it sees, or a measurement tool can measure it and return numbers with the code behind them. Knowing which one you are getting is most of the job.
This post covers both. The screenshots come from two new chats: one reading a bar chart, and one measuring two photos.
How to give Neutropic an image
- Upload it in the composer (PNG, JPG, GIF or WebP). The upload is attached to your message as an @ chip, and the model sees it with that message.
- Mention an existing image with @. Figures Neutropic made earlier in the project work too, for example asking for a critique of a chart before submission.
A few practical limits:
- Up to 4 images are attached per message, each up to 4 MB.
- The model has to support images. The Gemini, Claude, GPT and Kimi models do. The DeepSeek models do not, so switch models for image questions.
- Only images attached to the current message are seen. Earlier uploads are listed by name, and the agent will ask you to attach them again with @ rather than guess.
Reading a figure
Here is a typical request: a bar chart from a paper or a colleague, with no data file.
Read the attached figure stroop_rt_figure.png. What does it show? Estimate each bar's mean and error bar from the axis, say what pattern it suggests, and list what the figure alone cannot tell us.
We drew the figure ourselves, so the true values are known: congruent 512 and 505 ms, incongruent 598 and 561 ms, with standard errors of 14, 13, 17 and 15 ms.
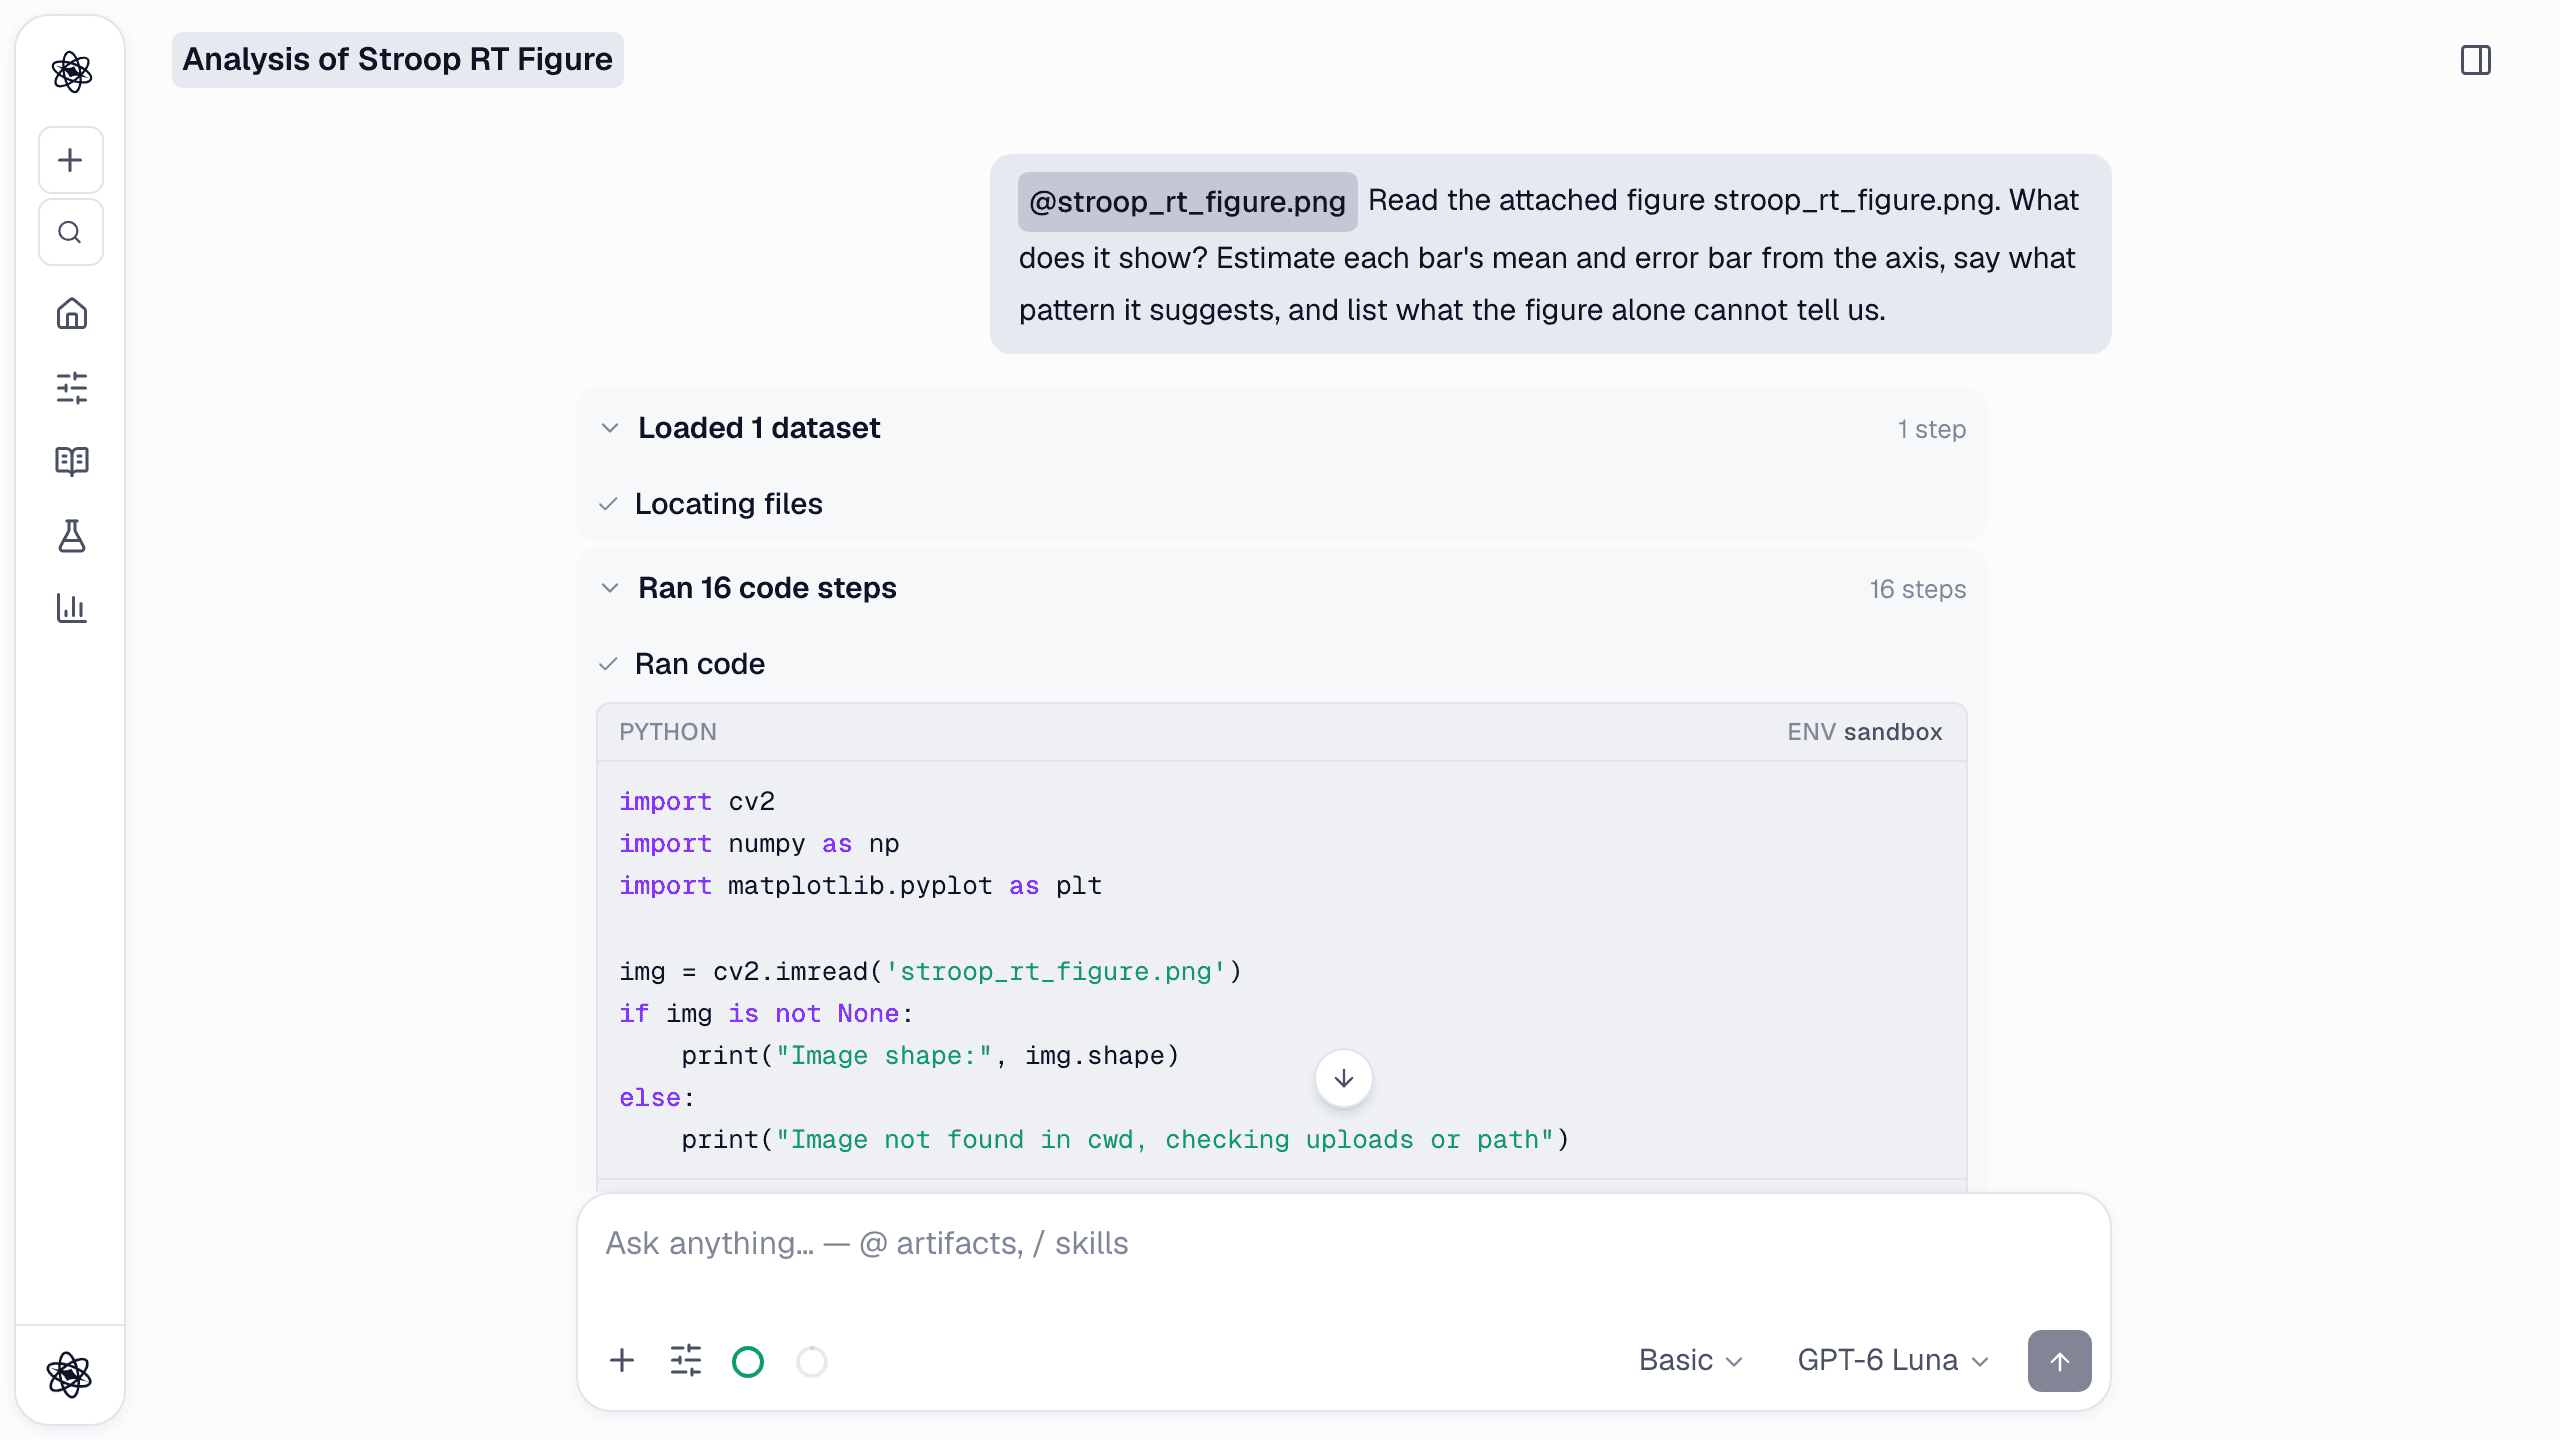
In this run the agent went further than looking. It loaded the image in the sandbox and measured it: it found the axis ticks, calibrated pixels to milliseconds, and located the top of each bar. Its estimates were 511.2, 504.3, 597.3 and 560.4 ms, each within 1 ms of the true value. The code is saved with the answer, so the digitisation can be checked and re-run.
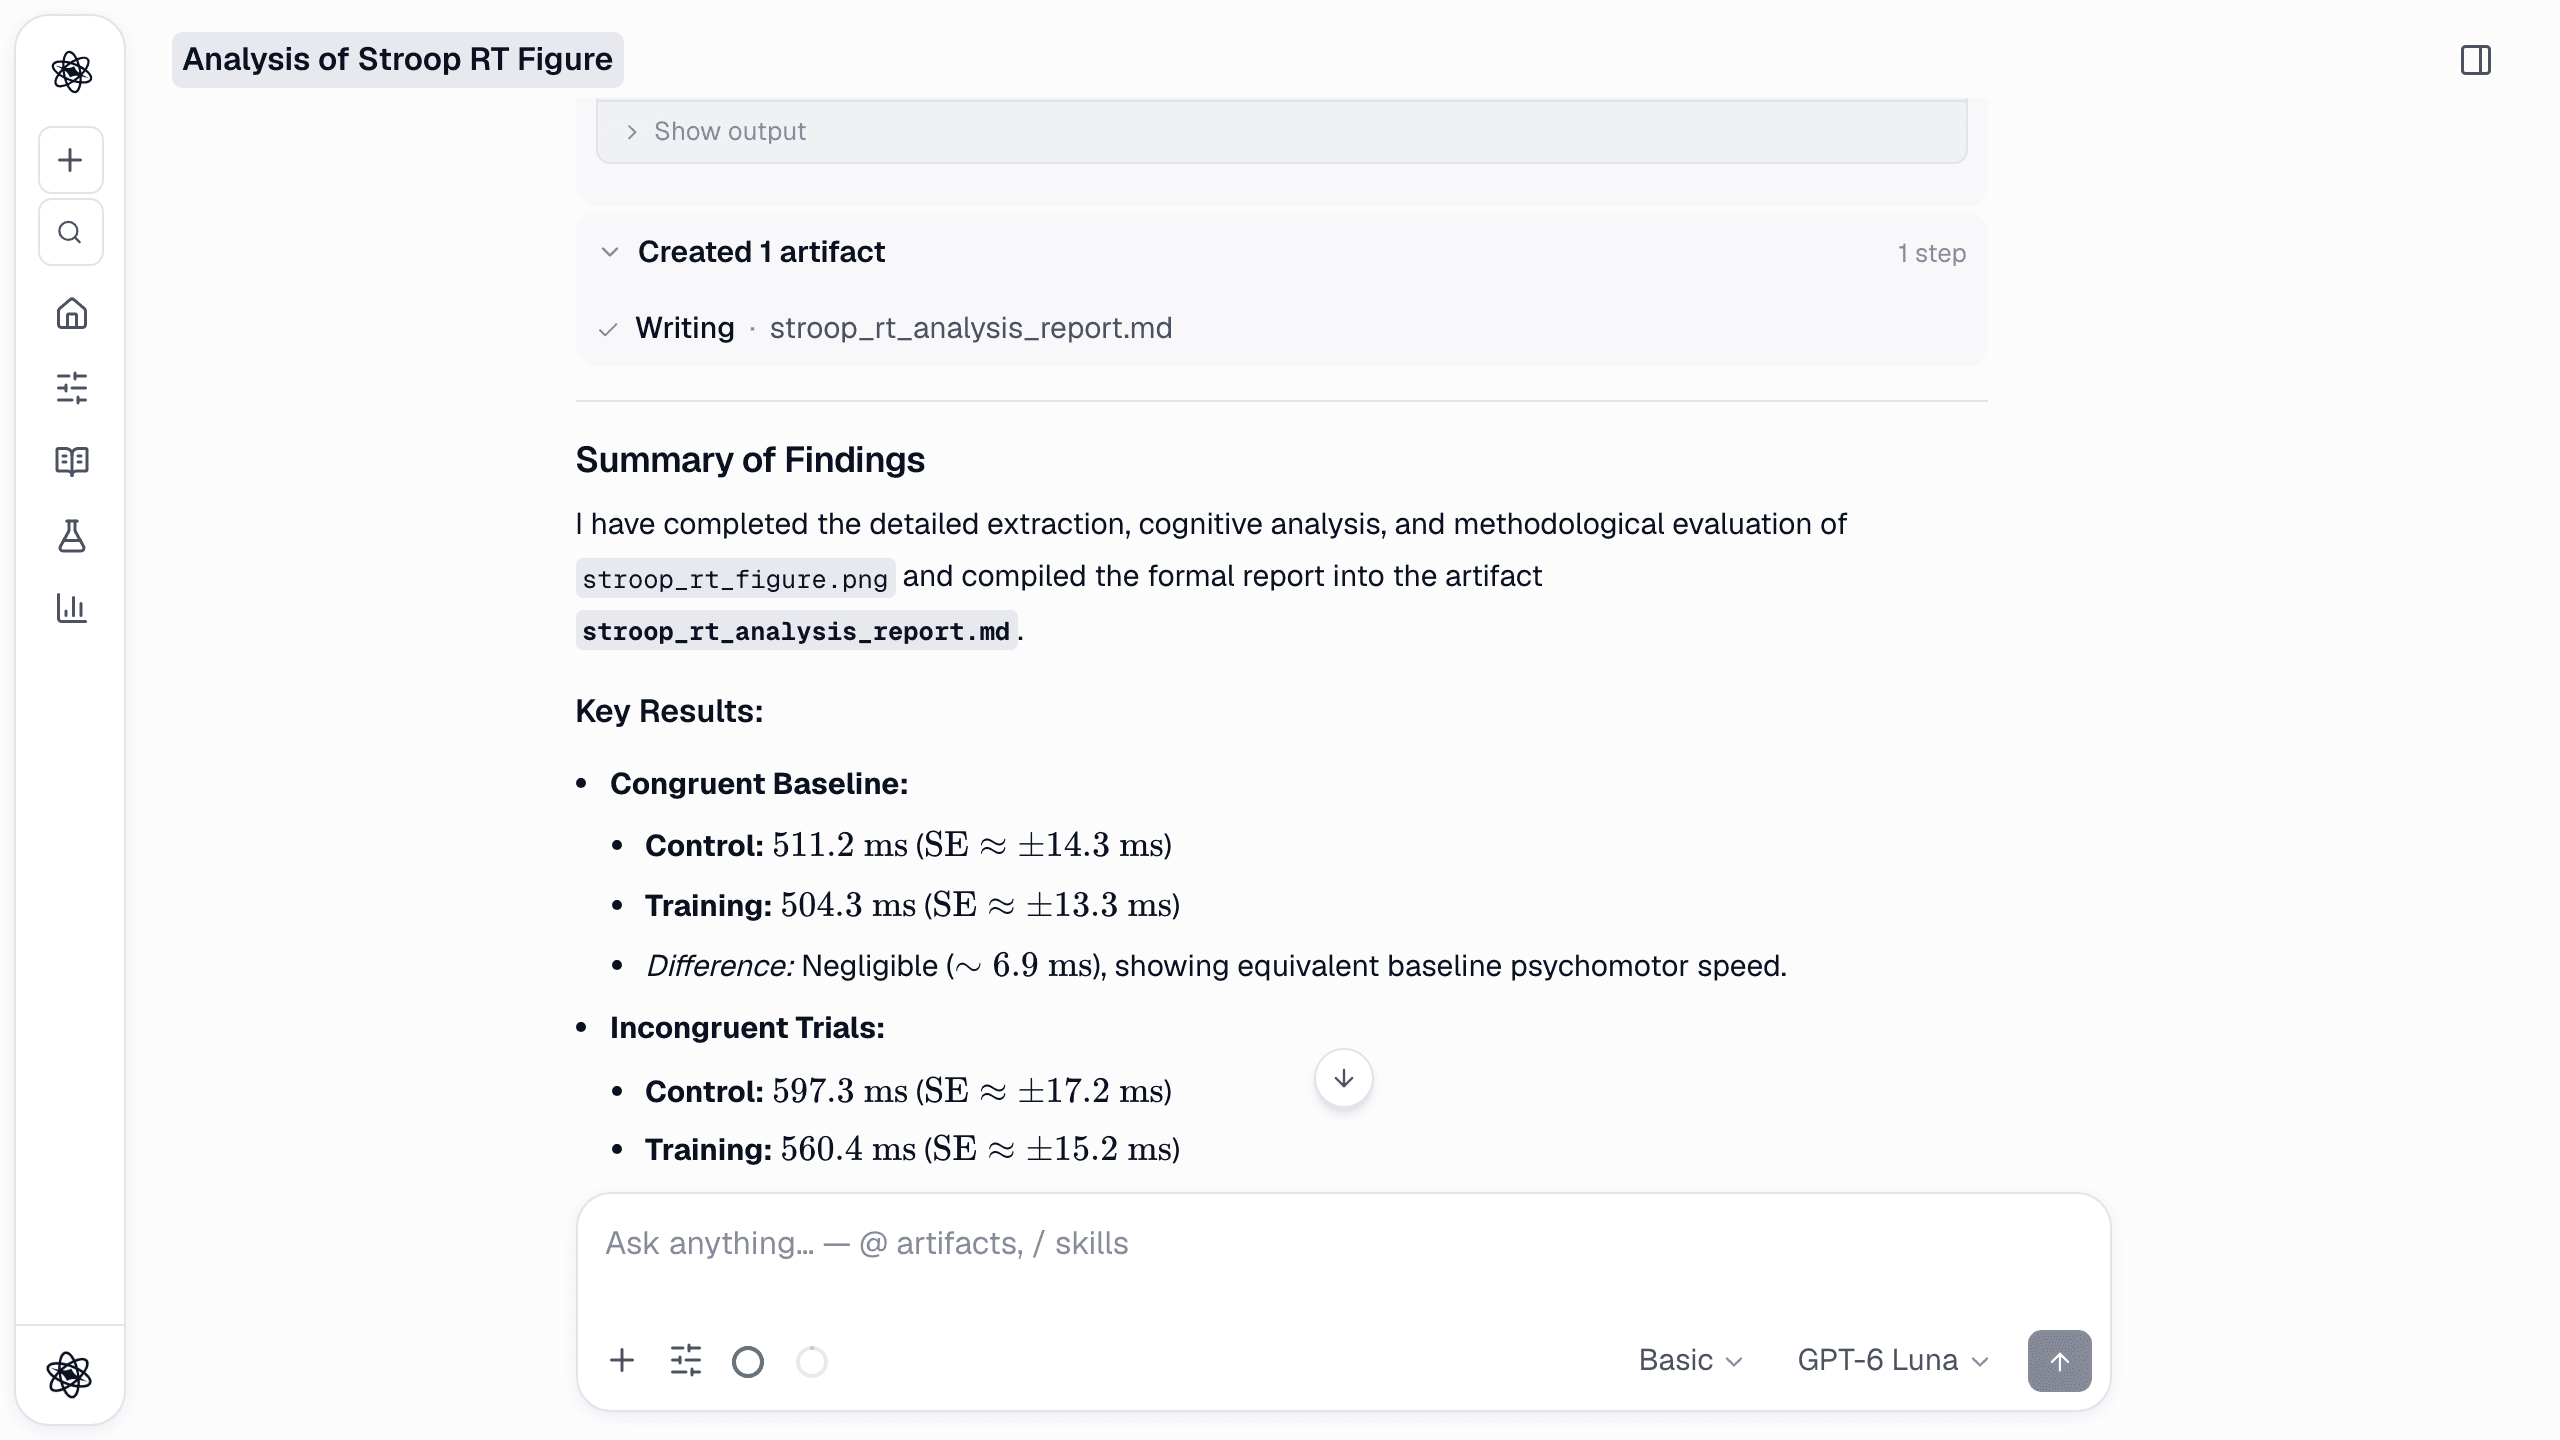
The more useful half of the answer is often what the figure cannot say:
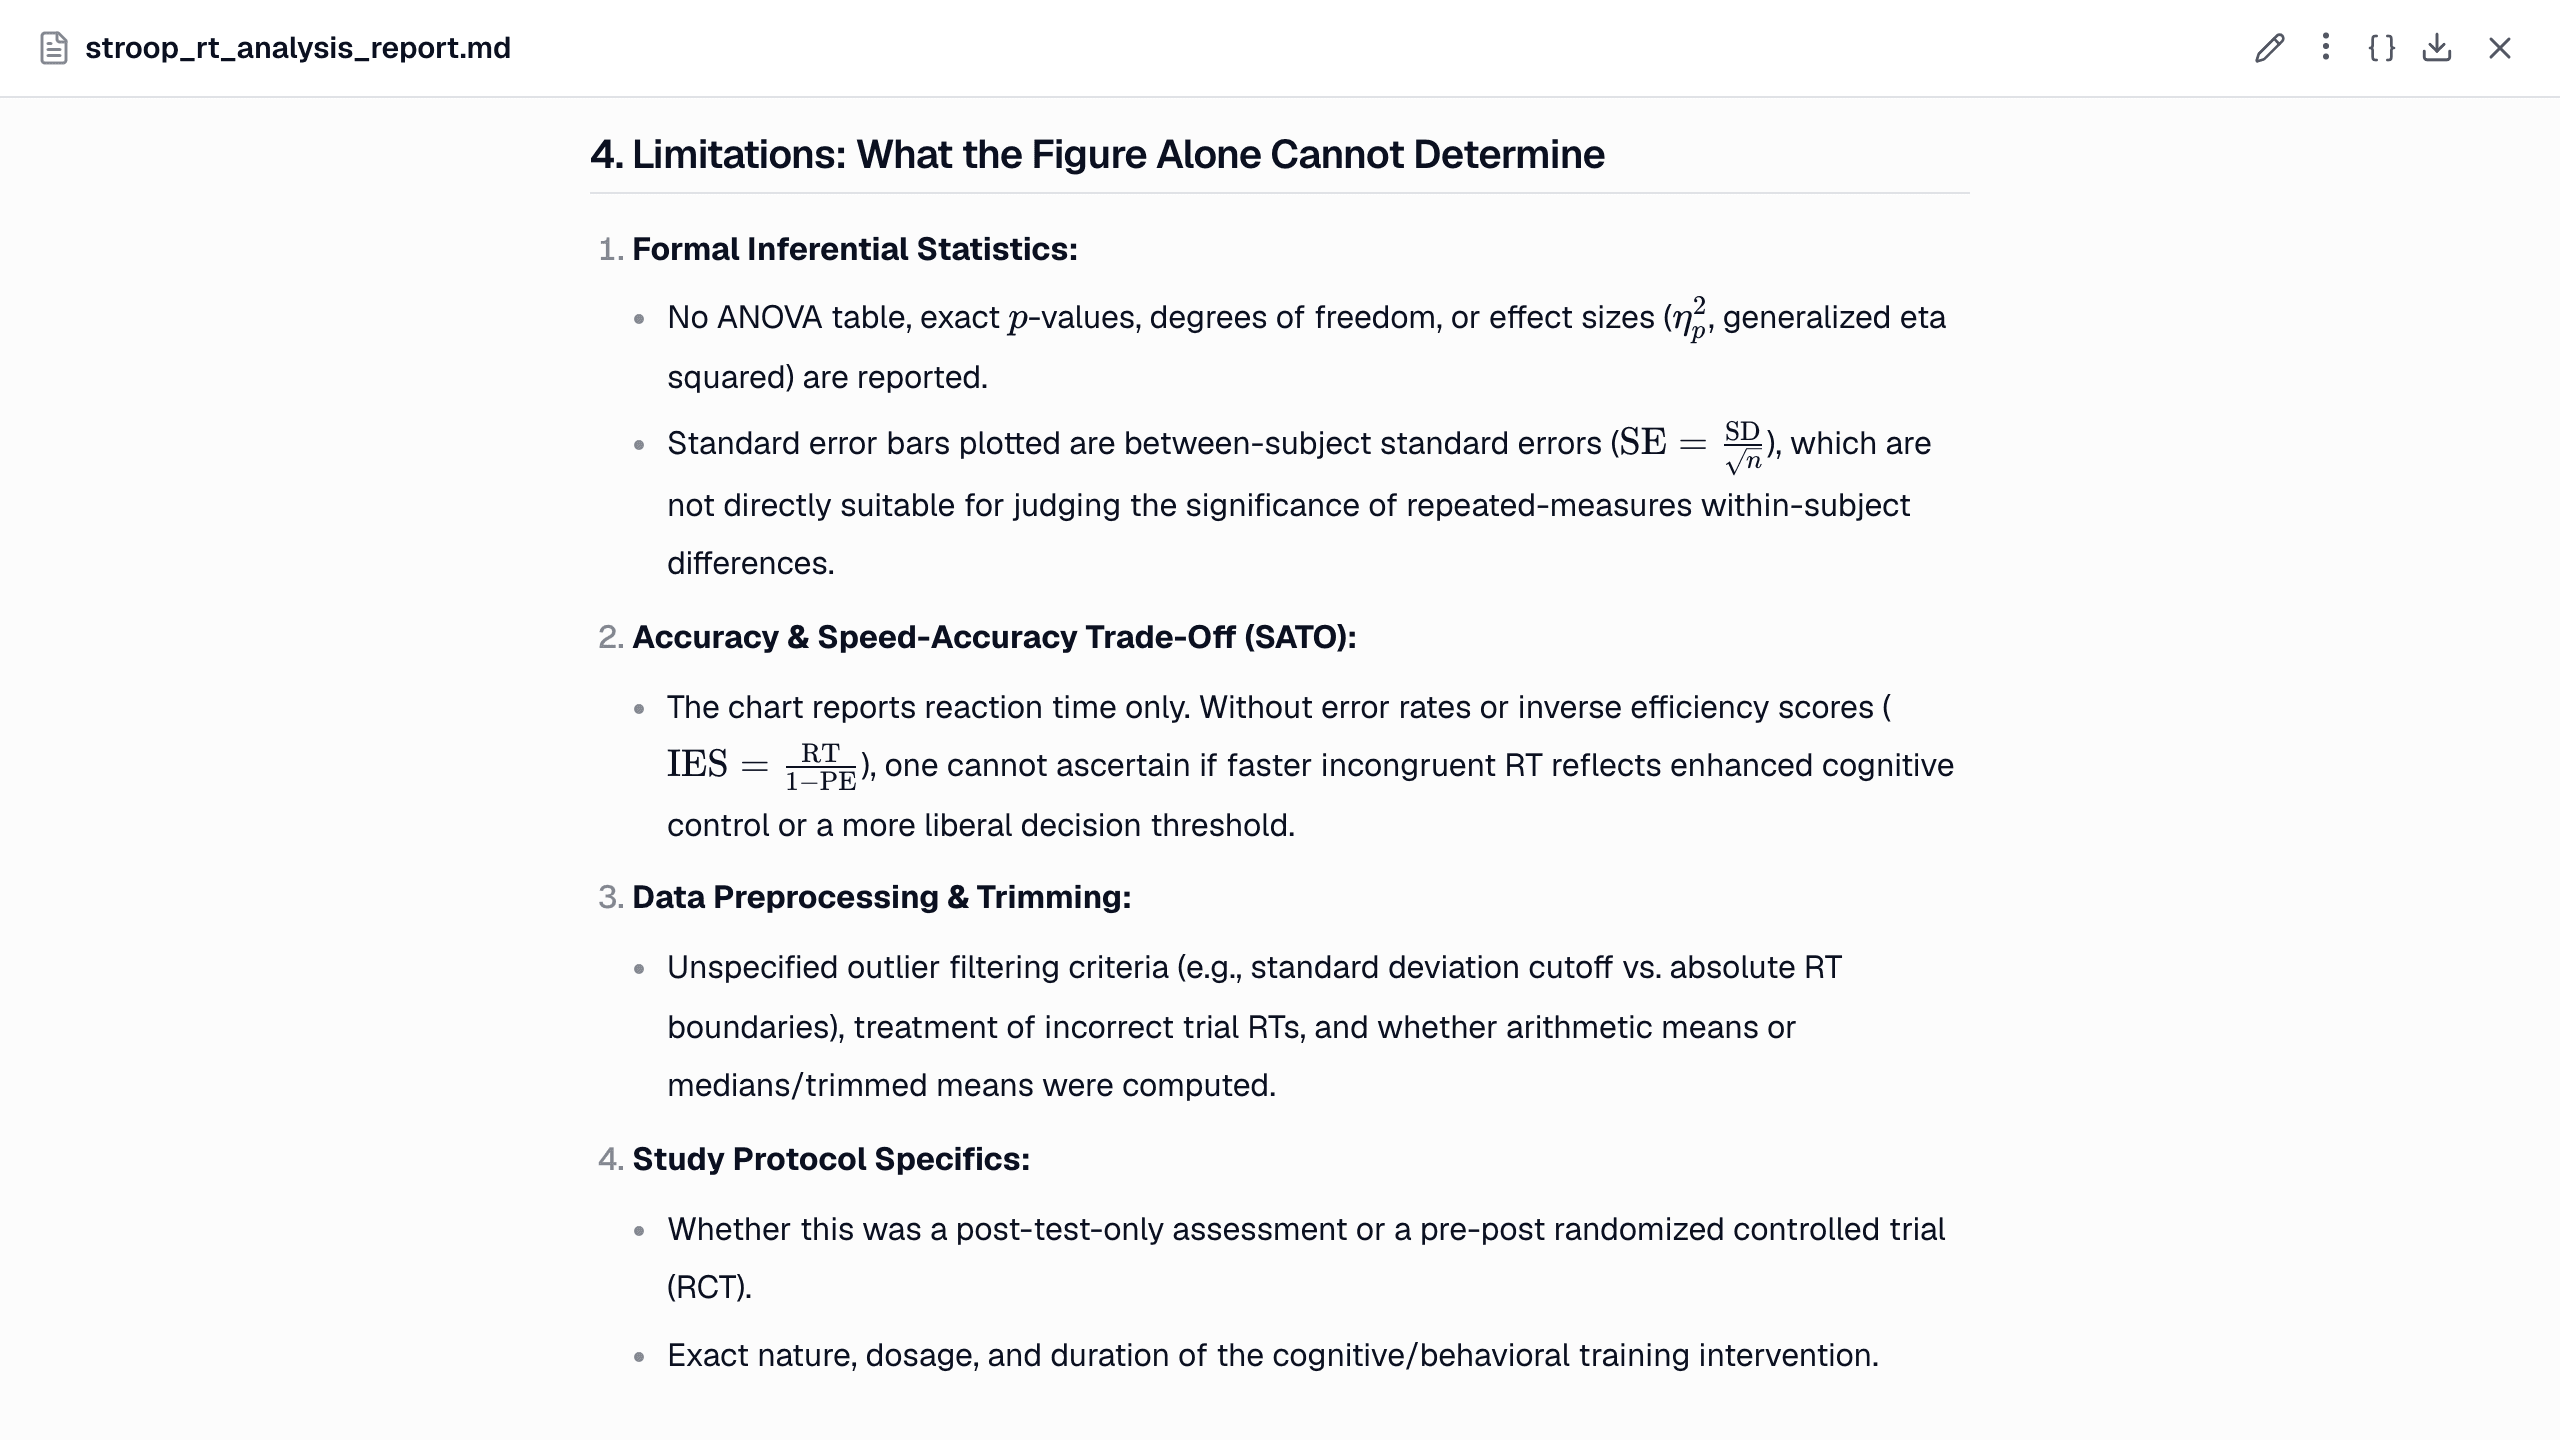
Two cautions apply. First, values read off a chart are estimates. They are good enough to sanity-check a paper, but not a substitute for the data. For a meta-analysis, extract with a dedicated digitiser and report that you did. Second, any "confidence" figure a model gives for a visual reading is not a calibrated measurement. Ask for the reasoning instead.
Measuring a photo
When you need numbers you can report, use the measurement tools. The same data-analysis request that handles video also works on still photos:
/analyze Measure the two attached photos. For pose_yoga.jpg, estimate the body pose: joint angles, posture and a landmark overlay. For face_smile.jpg, measure the facial expression: action units, emotion and head pose. Summarise the numbers briefly.
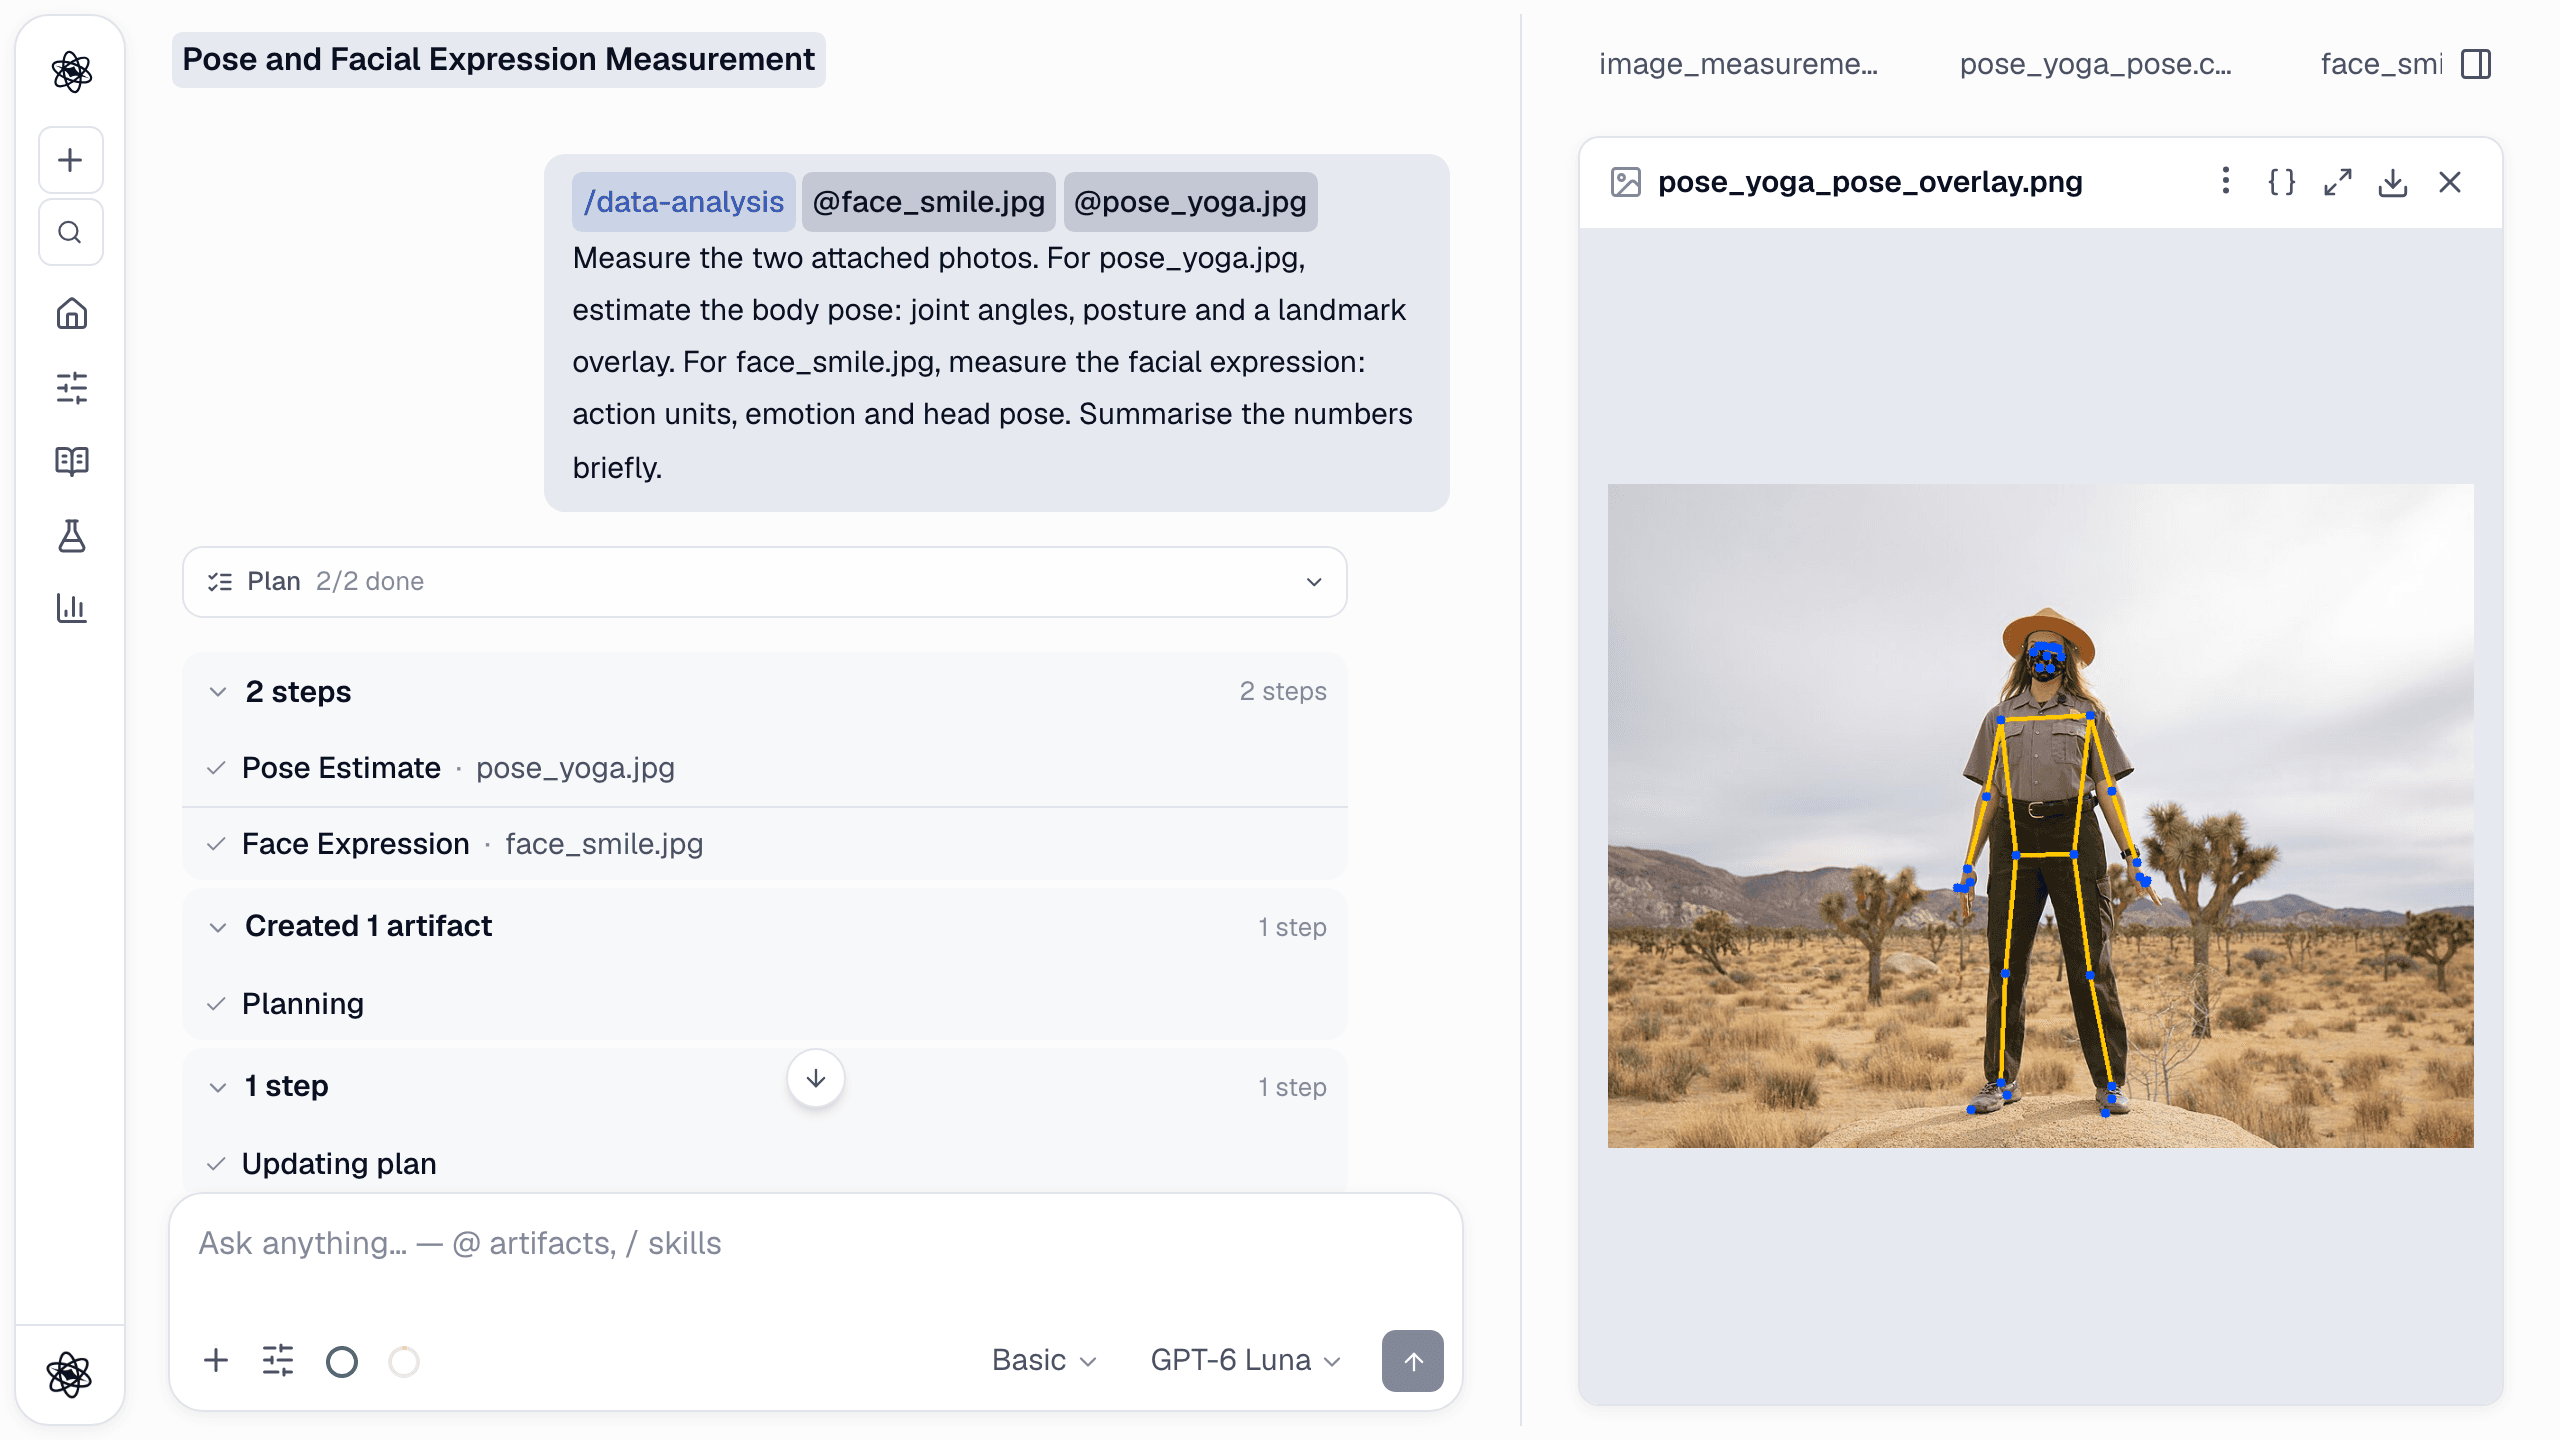
pose_estimatefinds 33 body landmarks and returns joint angles, posture, arm position, torso tilt, facing and an overlay image. See pose analysis.face_expressionreturns 17 facial action units on a 0–1 scale, emotion labels and head pose. See facial expression analysis.
Both tools compute the same numbers every time for the same image. They save a table per image, and the report's sentences carry [n] citations that point to the tool call behind each number:
![The report from the photo measurements, with [n] citations on its sentences pointing to the pose_estimate and face_expression steps.](/blog/image-analysis/cited-report.png)
Looking vs. measuring: which to use
- Use looking (vision) to describe, compare, spot problems, or read text and approximate values. Typical cases are figures, stimuli, screenshots of software output, slide drafts and interface screens in a UX study.
- Use measuring (tools) when the number goes into your results, such as AU intensities, joint angles or anything you will compare across participants.
- Combine them. Let the model check that the overlay landed on the right person, then report the tool's angles.
Our earlier internal check showed why this distinction matters. Before the measurement tools existed, a model reading the same two photos described them correctly (a smile, a person standing with arms down) but attached a "98 % confidence" that nothing had measured. Now the data-analysis skill tells the agent to quote tool values verbatim and treats any value that did not come from a tool as not a measurement.
Research uses
- Checking figures in papers you review or cite, and critiquing your own before submission.
- Stimulus sets. Consistent descriptions of image stimuli, or measured expression values for a face set.
- Screenshots. Reading a statistics table from software output when the export is gone, then re-checking it properly once the data is back.
- Participant photos. Posture or expression at a single moment, measured and tabled.
Limits, stated plainly
- Vision is not measurement. Model readings are estimates and can be wrong, especially for small text, dense plots and truncated axes.
- 4 images per message, 4 MB each, and only on models that support images.
- Measurement tools on photos have the same limits as on video: 2-D pose angles, AUs approximated from blendshapes, and one person or face per image.
- GIF is read by the model but is not accepted by the measurement tools. Use PNG, JPG or WebP for those.
Photos of people: consent and privacy
Before the first upload, Neutropic shows a Before you upload research data notice. You confirm that you have the rights, consents and approvals (such as an IRB or ethics committee) needed to process the data. Note where each kind of analysis runs. The measurement tools run on Neutropic's servers and pass numbers to the model. When the model looks at an image, the image itself is sent to the model provider you selected. Uploads stay in your private workspace until you delete them, and they are not used for training. The privacy policy has the details.