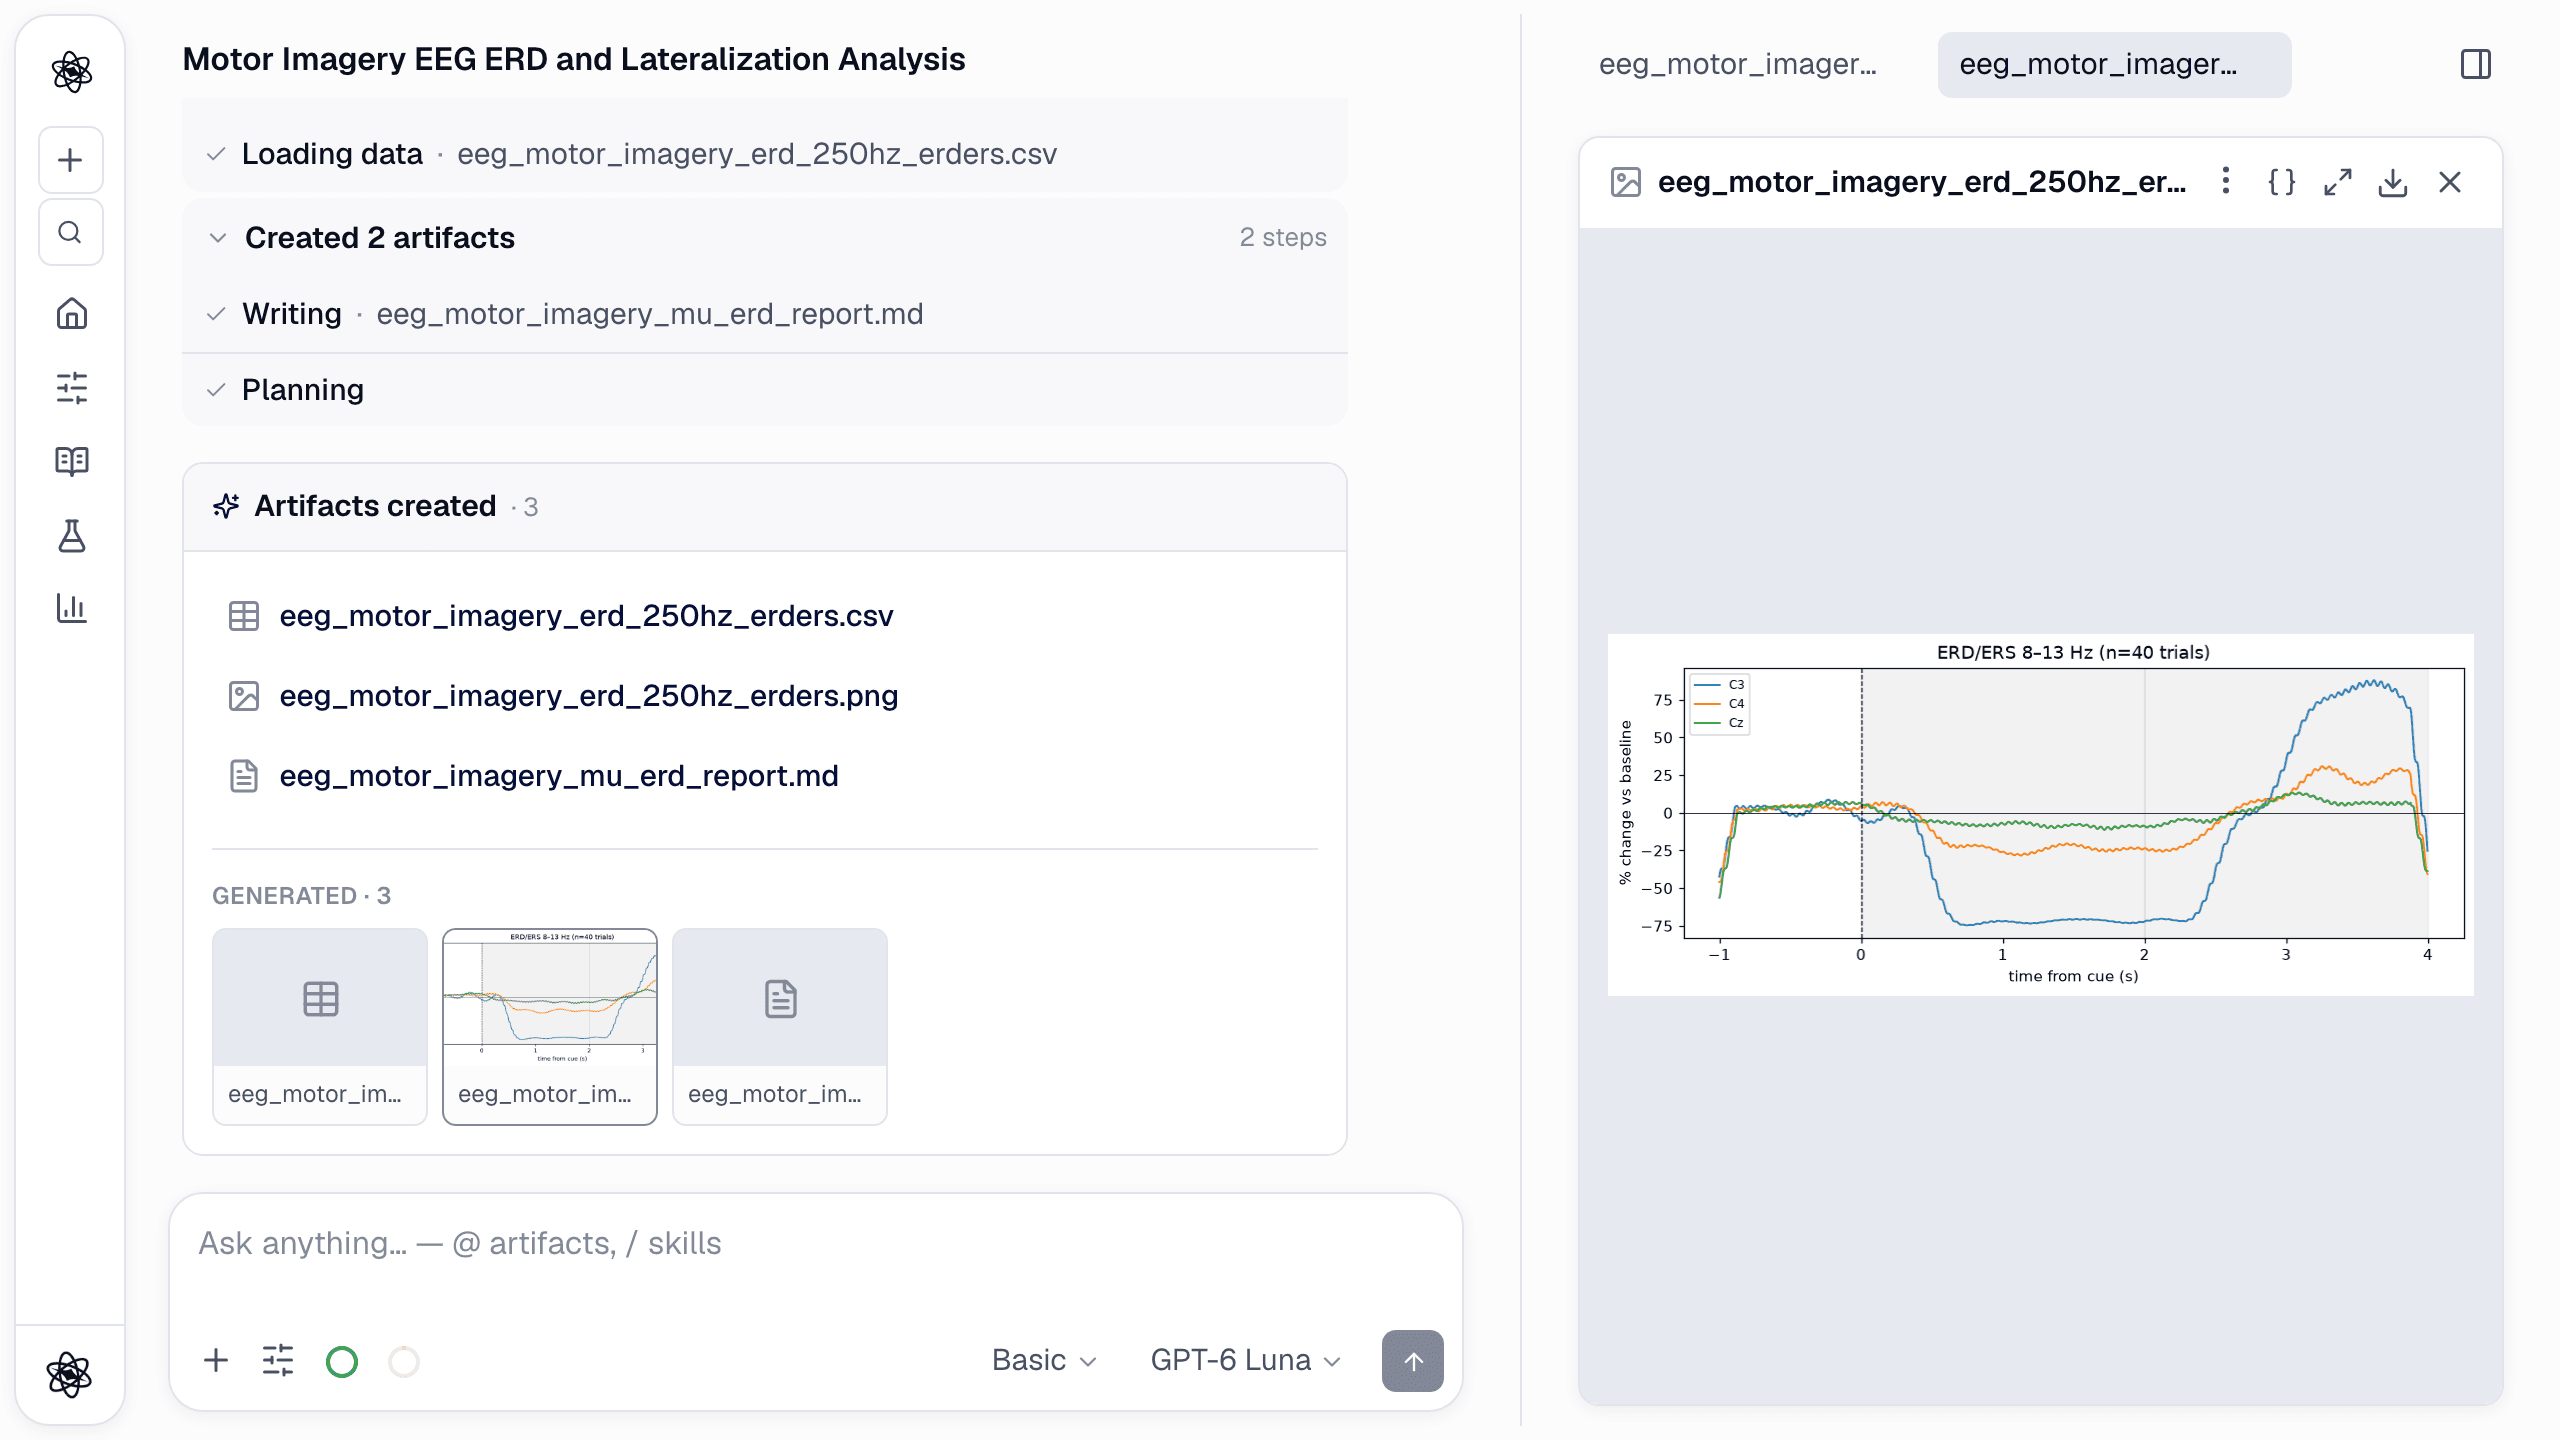
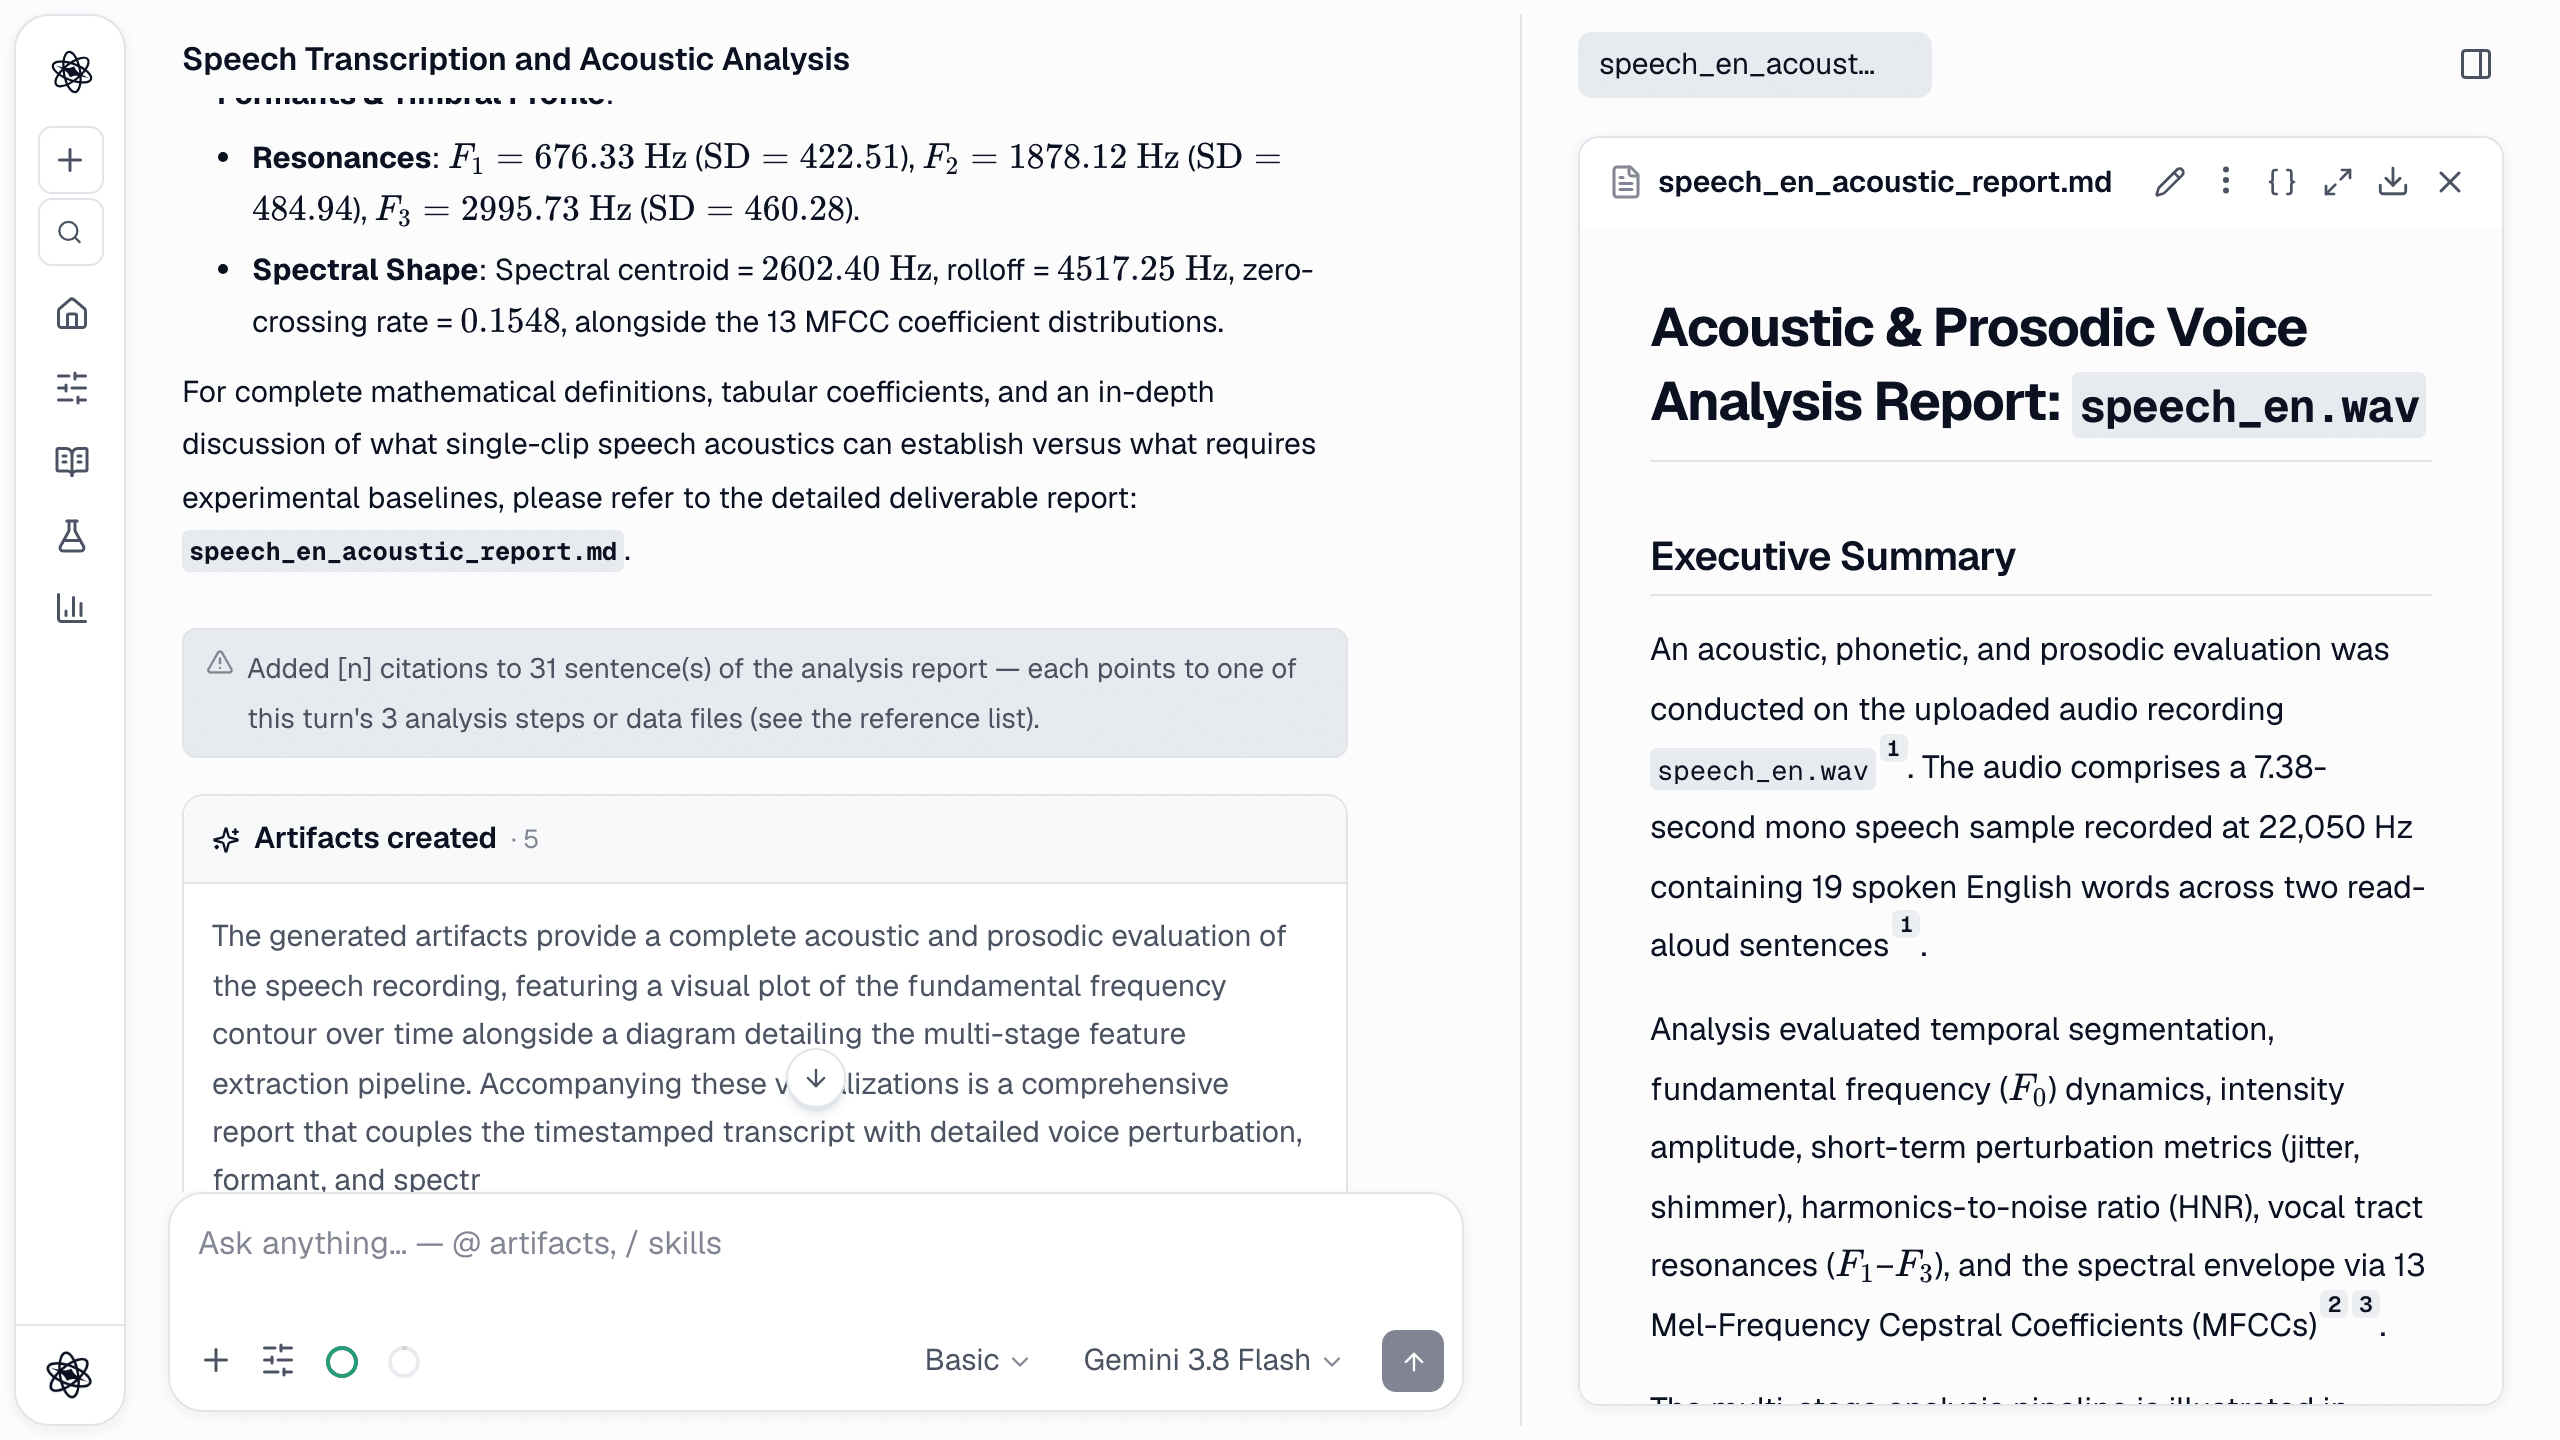
Most research tools cover one step. A reference manager holds the papers, a statistics package runs the tests, a drawing tool makes the figure, a word processor holds the draft, and the person doing the research carries the context between them. Every hand-off is a place where a number gets retyped, a citation drifts, or a figure stops matching the protocol.
This post follows one study through Neutropic without leaving the chat: literature review, hypotheses, experiment design, data analysis, statistics, figures and an illustration, the manuscript, an independent Report review, a journal-style Peer review, and a lab-meeting deck. It is a real session, not a storyboard. You can open it yourself: Example · Research workflow in My Library is a read-only example project that every account can browse, in the four site languages. The study asks whether a four-week heart-rate-variability (HRV) biofeedback program lowers perceived stress (PSS-10) in university students. The numbers quoted below come from the English run; the other languages produced their own designs and decisions, which is itself a reminder to read what you get.
Rather than repeat the prompt-by-prompt guide (that is Neutropic for graduate students), this post looks at what happens inside each turn and, more importantly, at what carries over from one turn to the next.
The session at a glance
- Eleven turns, one chat, inside one project.
- More than twenty artifacts: a screened literature table, a review report, three literature diagrams, a design report with a power curve and a protocol figure, an analysis report and a three-panel results figure, a statistical report, a study-flow diagram, a hypotheses proposal with its framework figure, a methods illustration, the manuscript, a review report, a peer-review report and a 17-slide deck.
- About 2.1 million managed tokens in total, on Basic effort. Each turn shows its own count at the bottom.
- Everything a later turn needs comes from an earlier artifact, not from the model's memory of the conversation. That is the design decision this post is about.
What a turn looks like
Every turn has the same anatomy, and it is worth learning to read it because it is where you verify the work.
- Plan. The agent writes a short plan and ticks it off as it goes (
Plan 4/4 done). When a plan item is skipped, the chat says so. - Steps. Grouped lines such as Ran 7 searches, Ran 5 code steps, Read 2 pages, Verifying, each expandable to the query, the code or the document it touched.
- Applied N decisions. A chip at the top of a turn that says how many facts settled earlier in the project were loaded before the turn started. Click it to see them.
- Artifacts created. The files the turn produced, which open in the panel on the right.
- Tokens. The managed tokens the turn used.
The step lists are not decoration. When the Report review turn later says it "re-derived the statistics", the step list shows the Python it ran, and the output is one click away.
Turn 1 — Literature review
/research Investigate the following topic across paper databases (OpenAlex, PubMed, Crossref, Semantic Scholar, Europe PMC) and the web, and organize the research timeline, key findings, milestone studies, and open directions: Does heart rate variability (HRV) biofeedback reduce perceived stress in adults? Focus on randomized controlled trials and report effect sizes.
The first turn is the one that stocks the session. The agent ran seven searches across the paper databases and the web, read the pages behind the best hits, re-read results it had already fetched to extract evidence, and only then wrote. The step list shows each query with its result count, so you can see the search strategy rather than trust it.
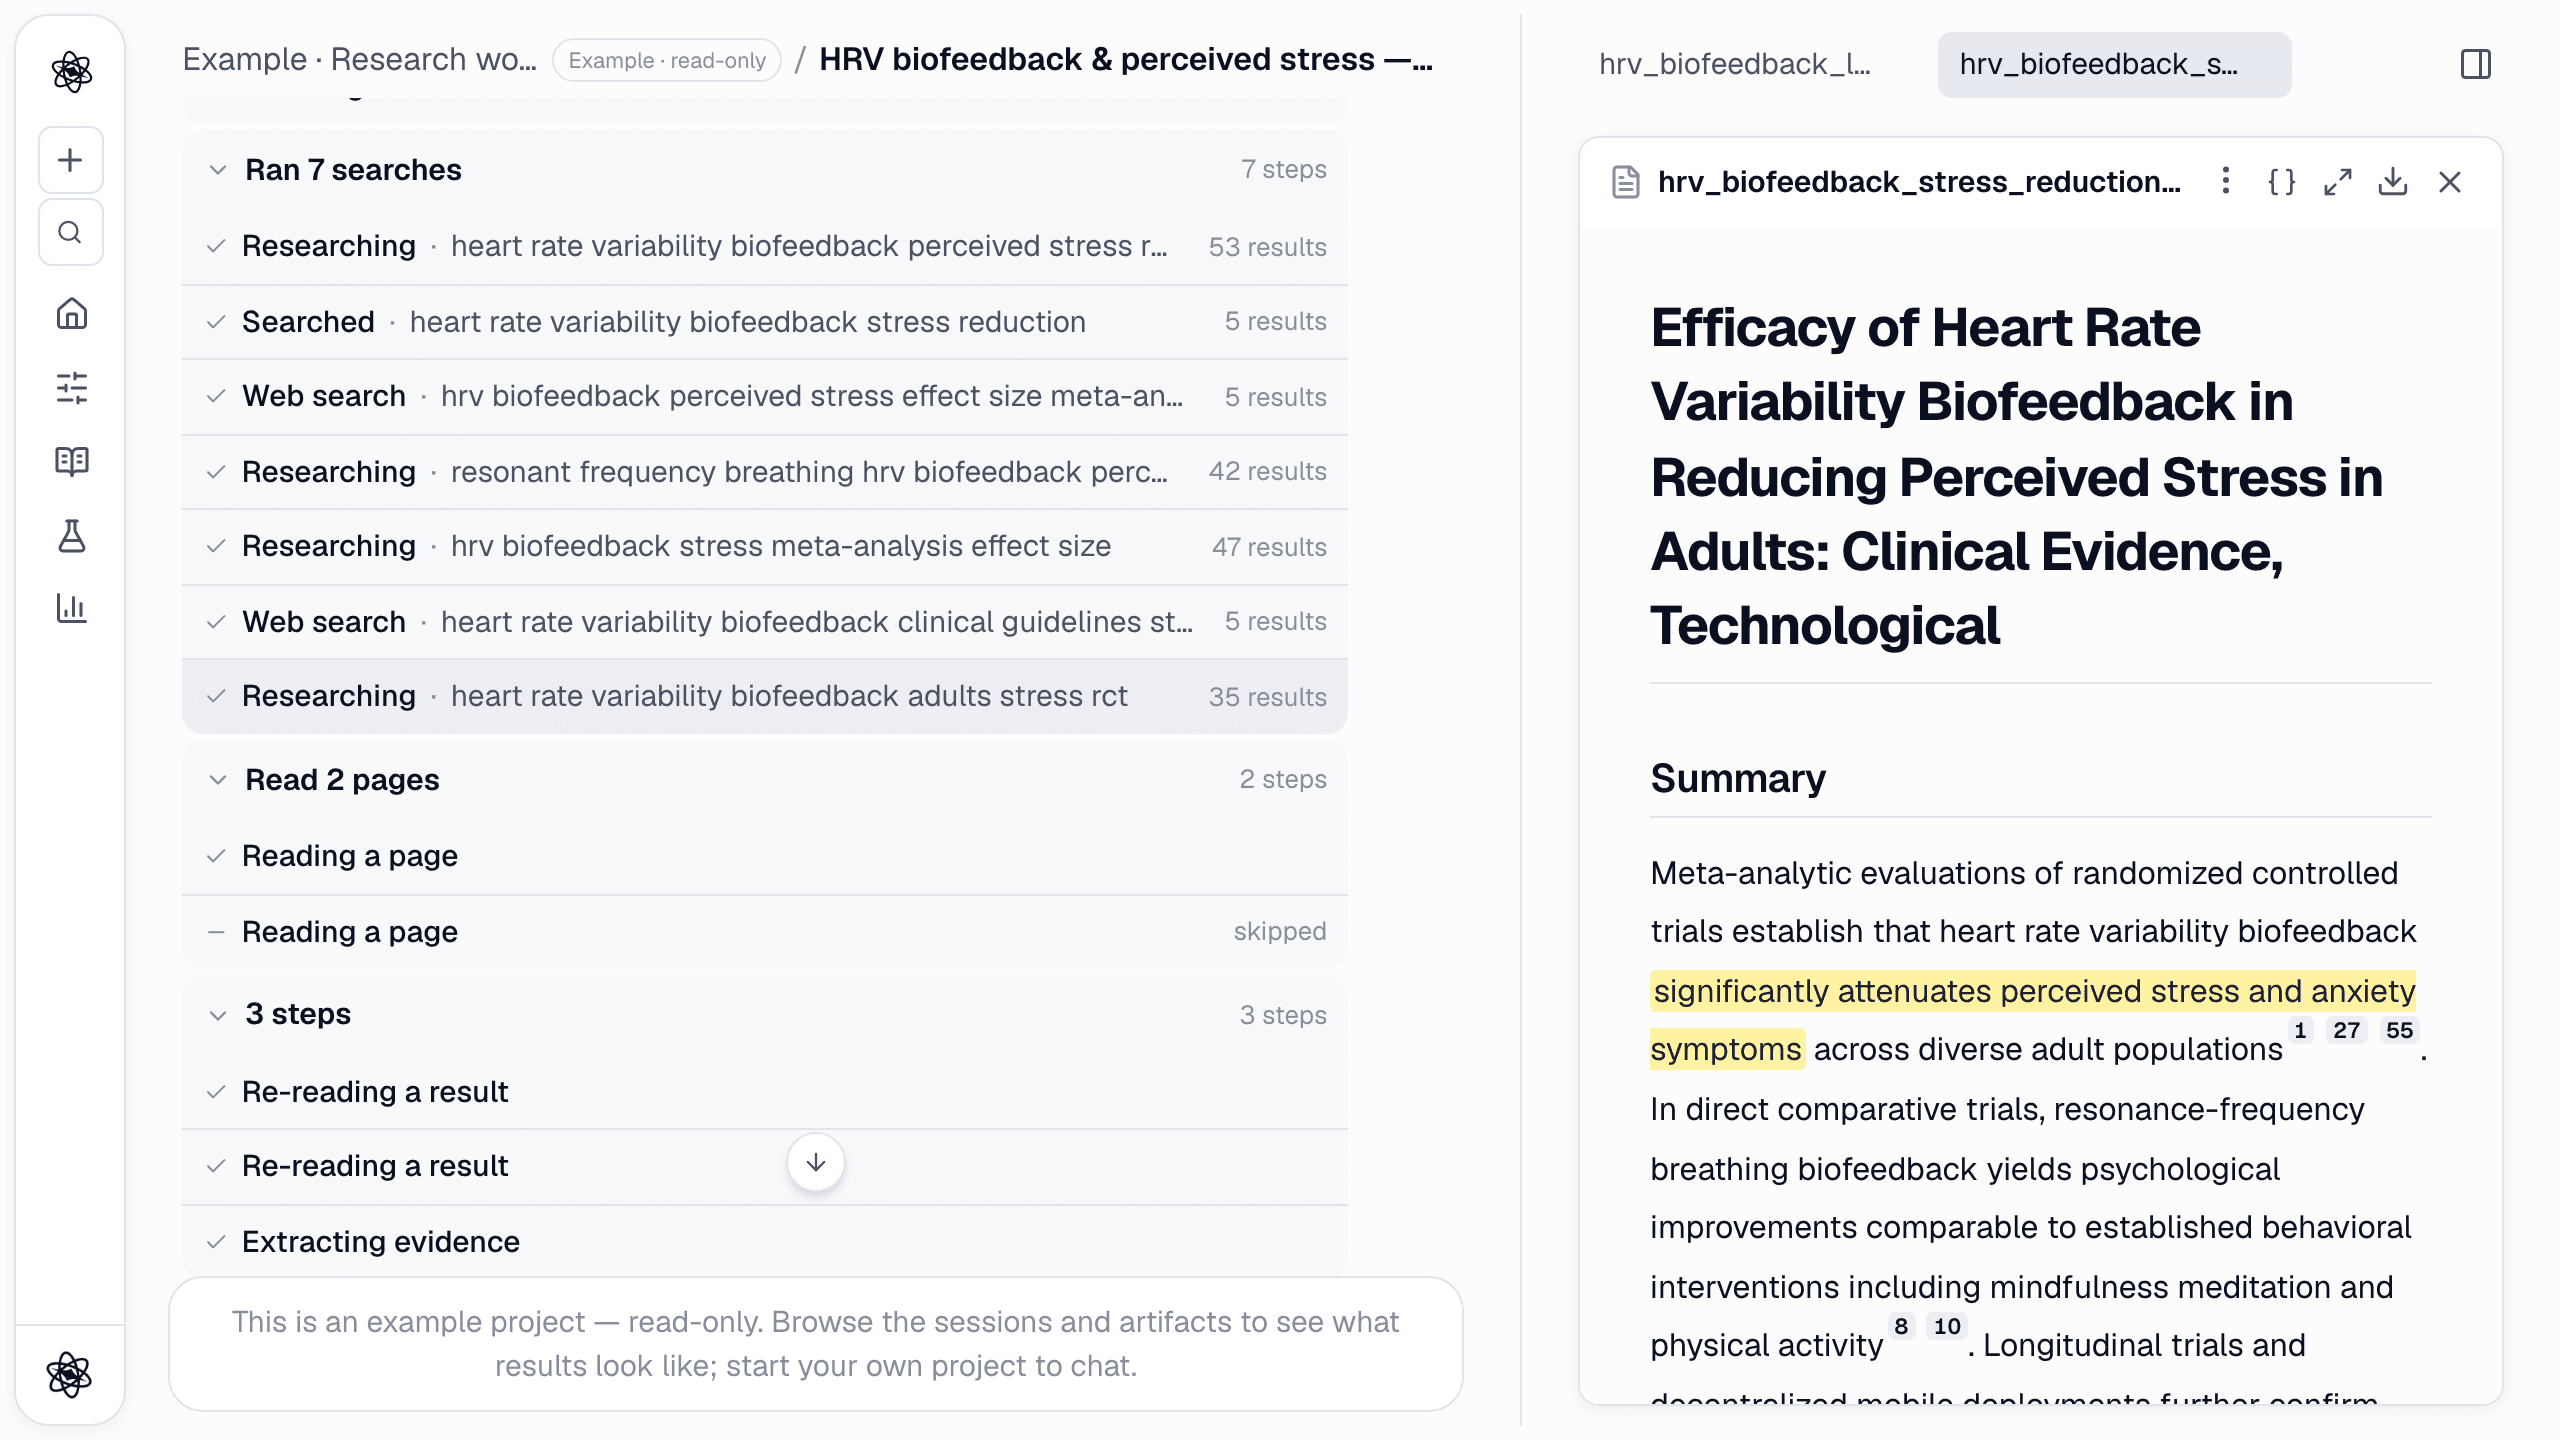
What it produced is a review report where sentences carry numbered citations to sources that were actually retrieved, plus a screening table of the papers it found (scored for relevance), a research timeline, a citation graph and a mind map. The meta-analyses it anchored on (Goessl et al., 2017 among them) and the multi-arm trials comparing biofeedback with exercise and mindfulness (van der Zwan et al., 2015; de Bruin et al., 2016) became the backbone of everything that followed. The sources themselves are stored with the session. That matters later: when the manuscript is written in turn eight, its reference list is rebuilt from this store so that every [n] in the text points to a real retrieved paper.
Walkthrough: literature review.
Turn 2 — Experiment design
/experiment-design Design a two-arm randomized experiment testing whether a 4-week HRV biofeedback program lowers perceived stress (PSS-10) in university students compared with an active control. Ground the design in how related studies did it and produce the design report with participants, measures, protocol flow, and a power analysis.
This turn opened with Applied 3 decisions settled in other chats of this project: the outcome measure, the population and the comparison had already been fixed by the first turn, and the design inherited them. It then searched three more times, searched for the van der Zwan trial's methods by name to see how a comparable study was run, and built the design from that.
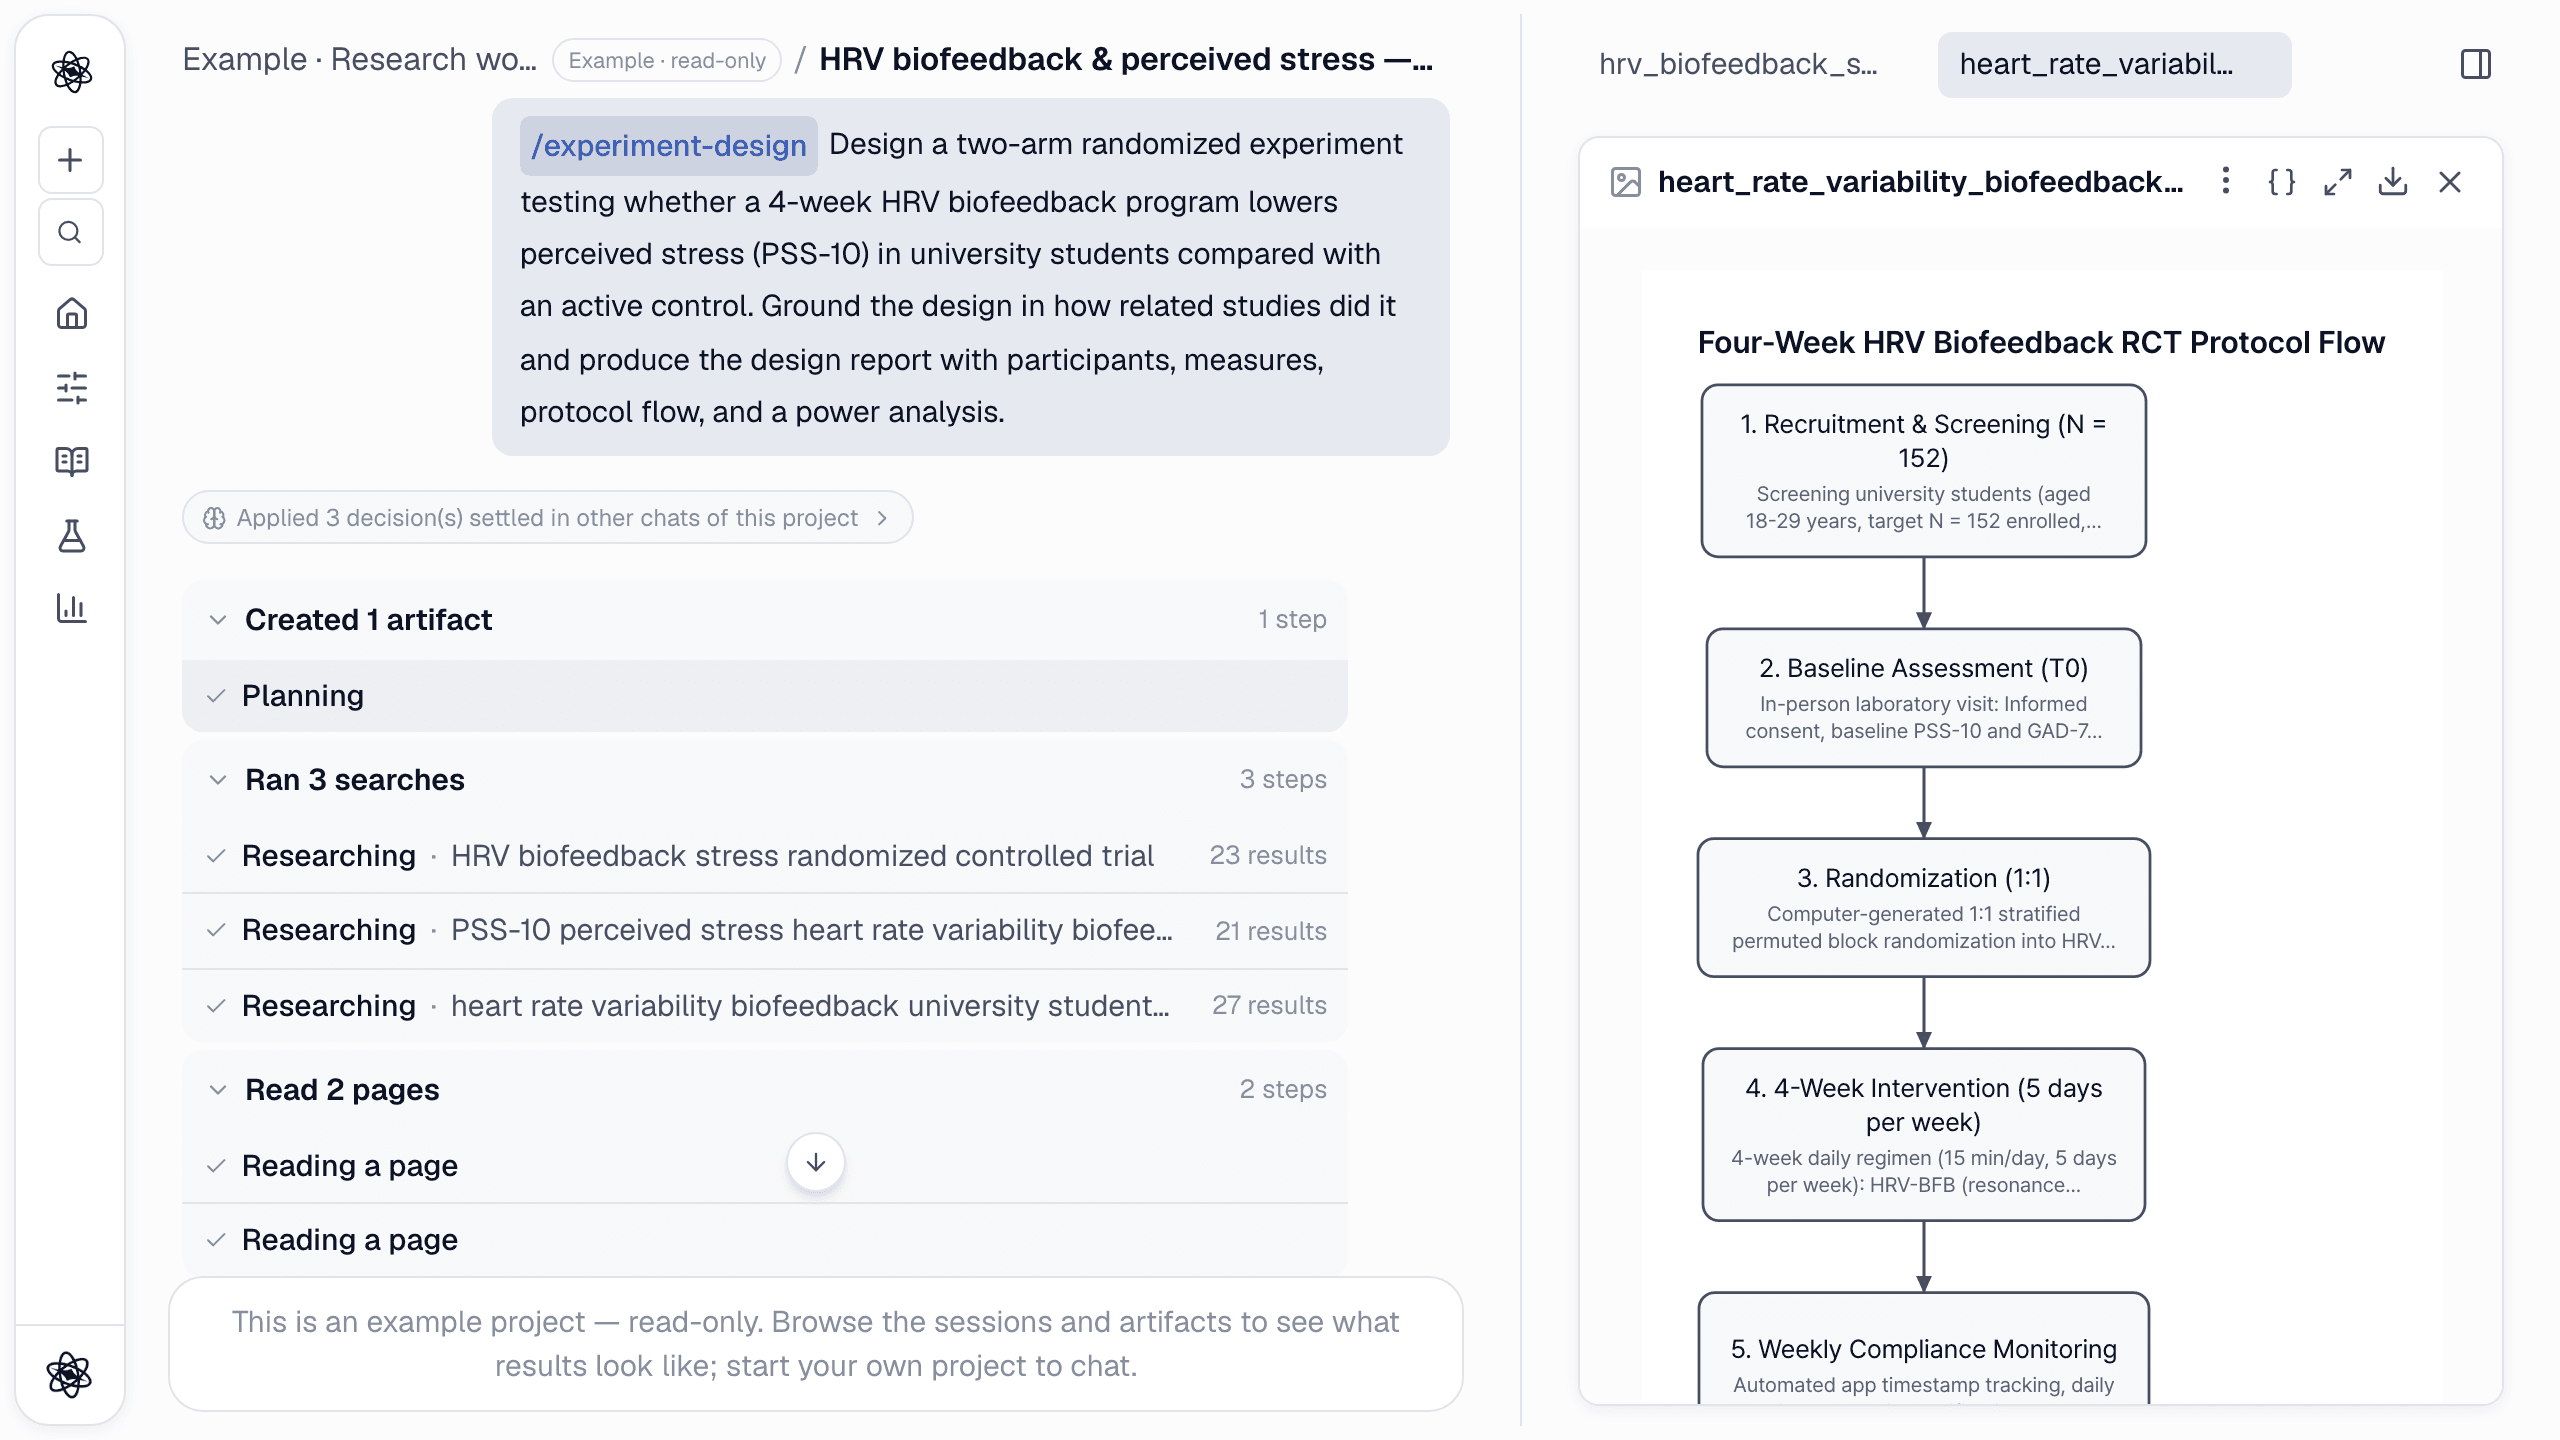
The design report is the most reused document in the session: a 2 × 2 mixed design with stratified block randomization, both arms specified down to minutes per day, the measures, eligibility criteria, a power analysis giving 64 per arm and 152 to recruit after 15% attrition, and a rationale for each choice with its source. It came with a power curve, a protocol-flow figure, an expected-results chart labelled as not measured data, and a comparison table of how the reference studies were designed. Later turns read this file by name: the manuscript's Methods, the study-flow figure and the deck all draw on it.
Walkthrough: experiment design.
Turns 3 and 4 — Data analysis, then statistics
The data file pss_trial.xlsx (a demo dataset of 80 participants, 40 per arm) was uploaded with the + button, and two turns worked on it.
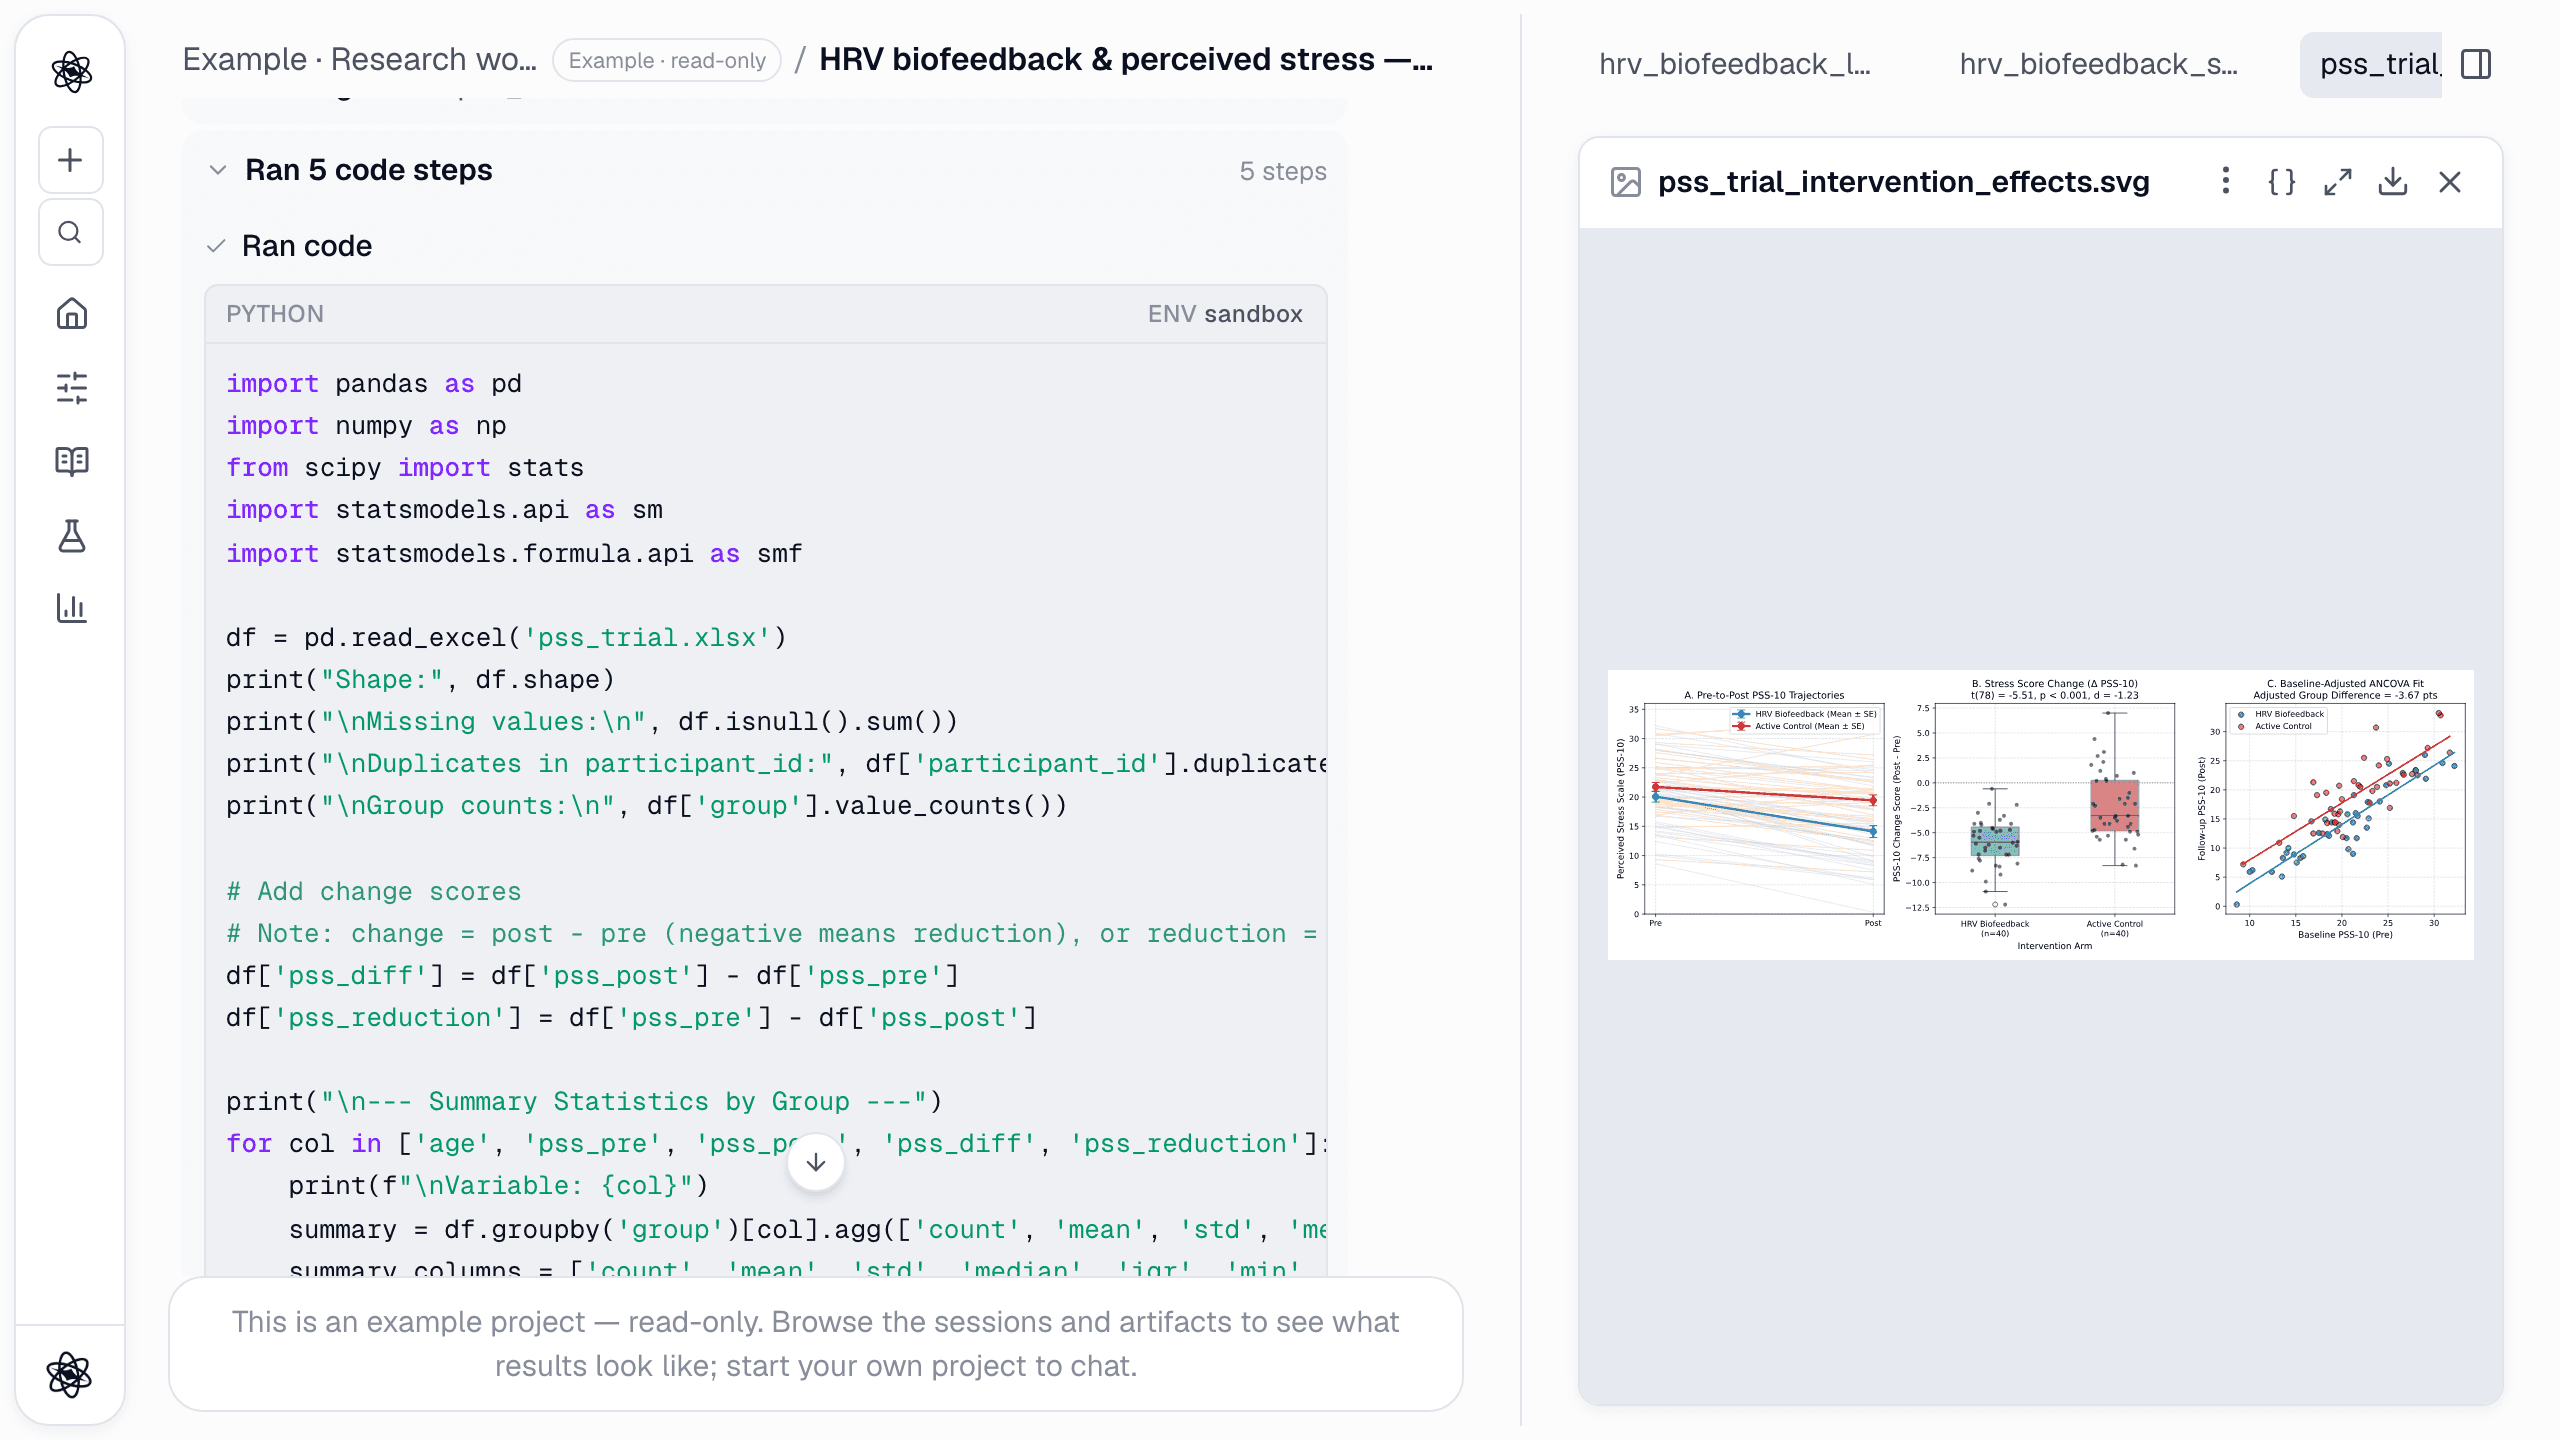
/analyze Inspect the uploaded pss_trial.xlsx (two groups, PSS-10 pre/post). Check data quality and baseline balance, compute change scores, and deliver a reproducible analysis report with plots.
The analysis turn ran five code steps in the sandbox: a quality audit (no missing values, no duplicate IDs, scores within range), baseline balance tests on age and baseline PSS-10, normality and variance checks, change scores with paired and independent tests, a baseline-adjusted ANCOVA, a mixed model with participant as a random intercept, and finally a three-panel figure: individual trajectories, change-score distributions, and the ANCOVA fit. Every one of those code blocks is in the chat, and the figure's Reproducibility button in the panel shows the exact code, inputs and environment that produced it.
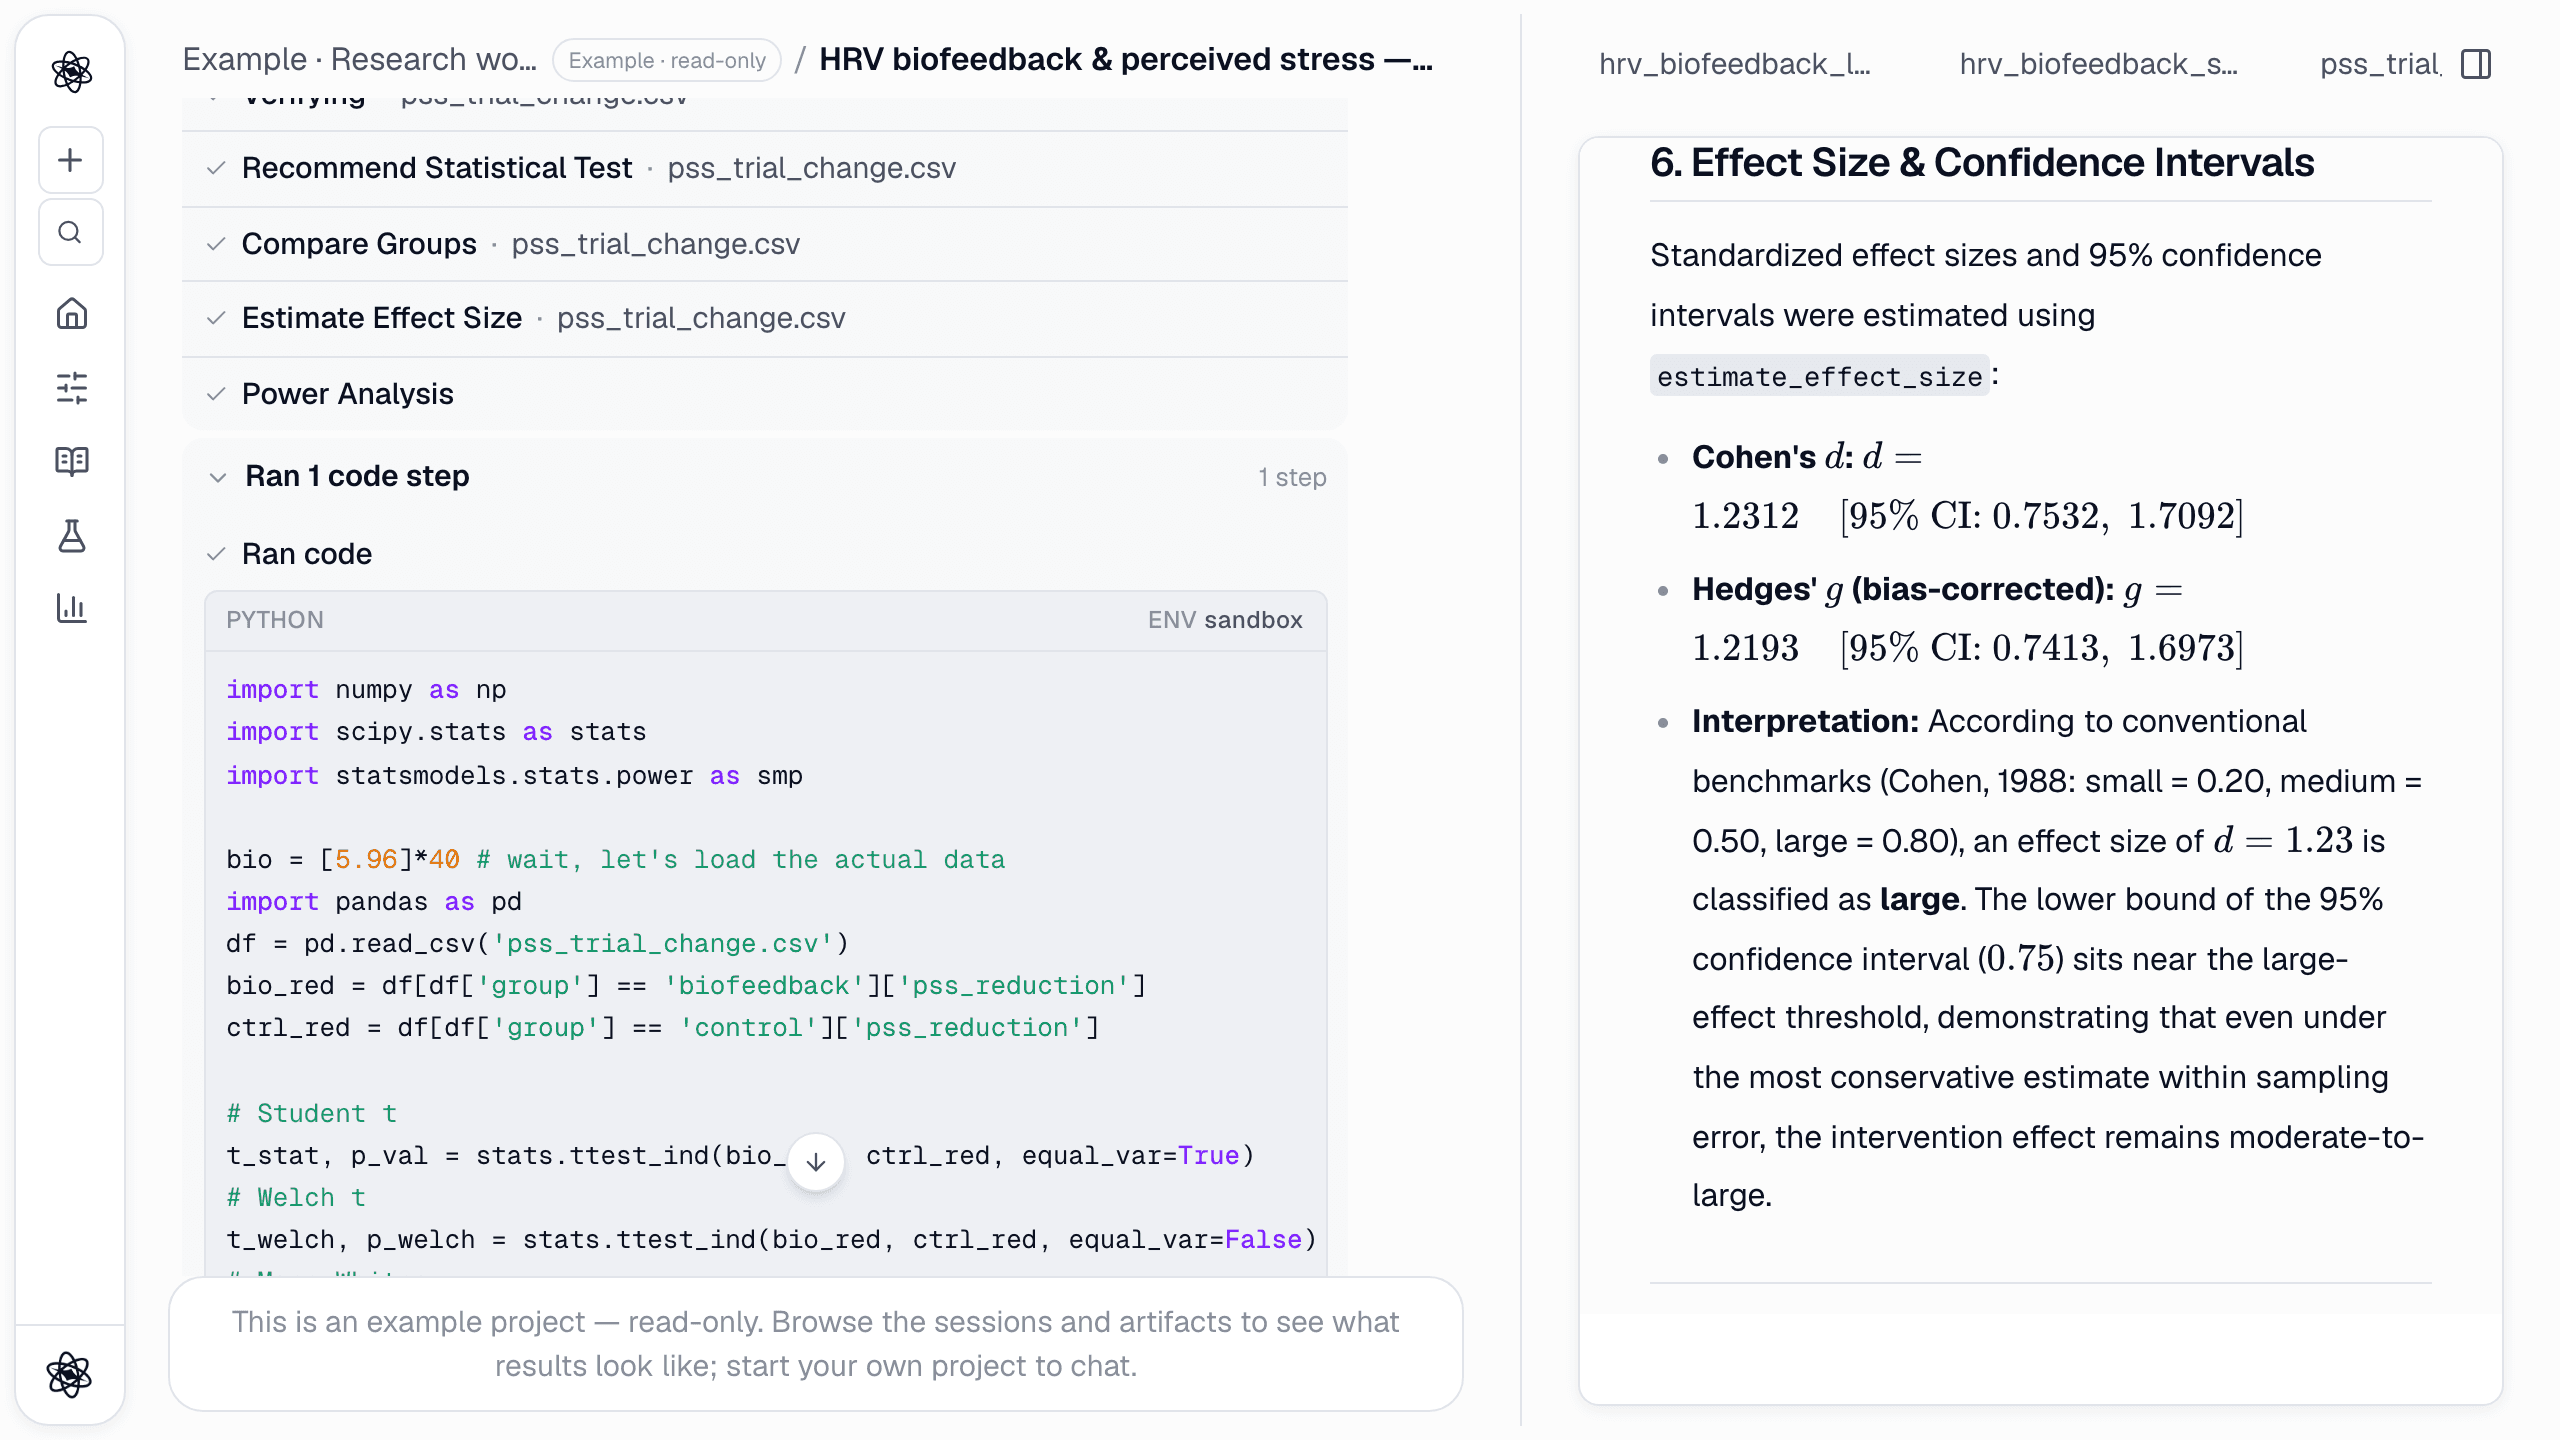
/stats Using pss_trial.xlsx, test whether the biofeedback group shows a larger PSS-10 reduction than control. Identify the design, check assumptions, choose and justify the test, and report the effect size with a 95% CI and achieved power.
The statistics turn is different in kind. Instead of free-form code it chained the statistics tools, and the step list reads like a decision tree: Verifying the data file, Recommend Statistical Test, Compare Groups, Estimate Effect Size, Power Analysis. The report quotes the decision trace that led to an independent-samples t-test ("normality not rejected in every group → parametric family; Levene p = .057 → equal variances"), runs Welch and Mann–Whitney as sensitivity checks, and reports d = 1.23 with a 95% CI of 0.75 to 1.71. It also says plainly that the "achieved power" of 1.000 is a consequence of the small p-value rather than an independent fact, and reports the sensitivity analysis (the smallest effect this N could detect at 80% power, d = 0.63) instead.
Walkthroughs: data analysis, statistics, and why the reports cite their own steps: every sentence cited.
Turns 5 and 7 — A figure and an illustration
/figure Draw an editable vector study flow diagram for the experiment designed in this session: recruitment → screening → randomization → HRV biofeedback (4 weeks) vs active control → post-test (PSS-10) → 3-month follow-up. Use a journal template.
/illustrate Draw a scientific illustration of the HRV biofeedback setup for a methods figure: a seated participant wearing a chest-strap ECG sensor and a fingertip PPG sensor, breathing along with a pacing display on a laptop. Semi-flat style, white background.
Both are single-step turns, and both are cheap (about 30K tokens each). The study-flow diagram was laid out on the double-column journal preset and is a real vector figure: Edit in workspace lets you move boxes and rename labels, and it exports to SVG, PNG, PDF or PPTX with the shapes still editable. The illustration is vector too, so the colours of the sensor strap or the clothing can be changed in the panel.
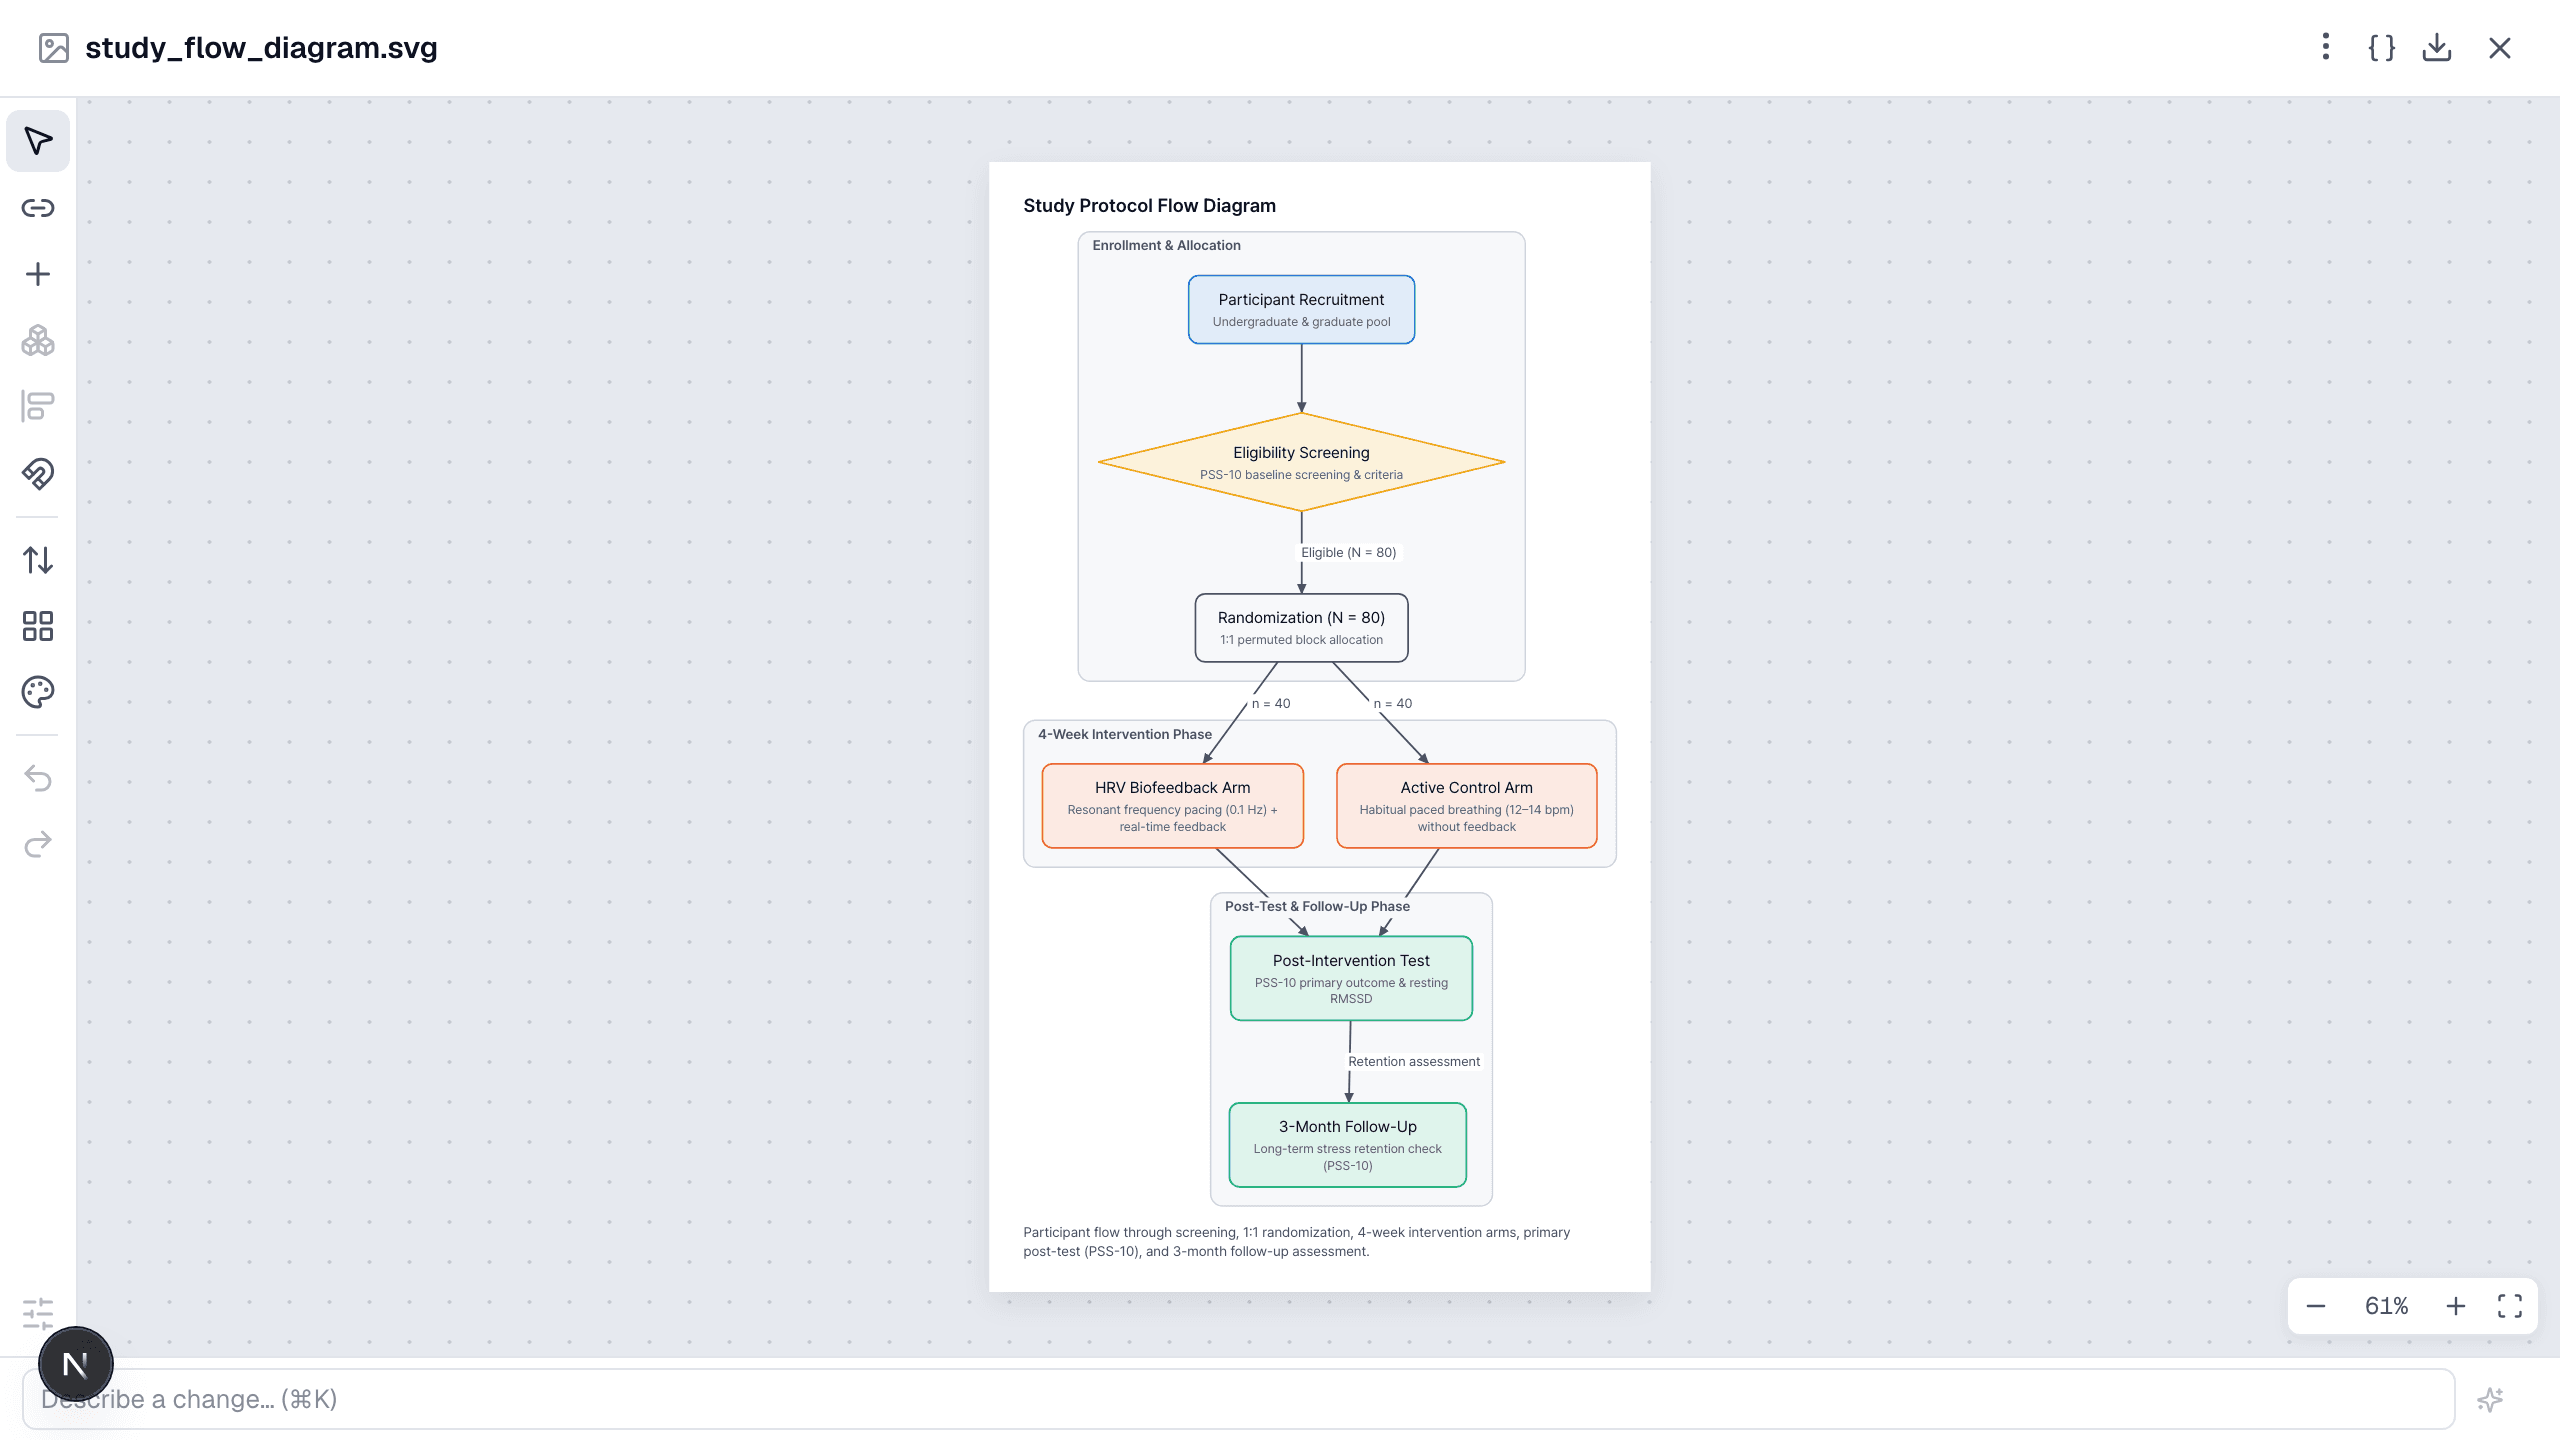
One thing to notice: the figure prompt asks for a three-month follow-up, and the diagram dutifully draws it, but the English design report has only baseline and post-test. The session keeps artifacts consistent with each other when it reads them; it cannot stop you from asking for something the protocol never said. Read the figure against the design.
Walkthrough: figures.
Turn 6 — Hypotheses
/hypothesis From the literature collected in this session on HRV biofeedback and perceived stress, map the research space, list the gaps and contradictory findings, and generate testable hypotheses ranked by novelty, plausibility, and testability, each with its rationale and sources.
In this session the hypotheses came sixth, after the analyses; in your own study you would run this right after the review. The turn re-read the stored literature, ran two more searches on mechanisms, built a prior-work table, checked for contradictions and ran a power analysis for each of five candidate hypotheses before writing the proposal and its framework figure.
The top-ranked hypothesis is worth remembering because it reappears: it asks whether closed-loop biofeedback adds anything over open-loop slow-paced breathing at the same 0.1 Hz. The trial in this session cannot answer that, since its control arm is psychoeducation rather than paced breathing. The manuscript, the Report review and the Peer review all notice.
Walkthrough: hypotheses.
Turn 8 — The manuscript
/write Write the Methods and Results sections of a manuscript from the literature, design, and analyses in this session, with every claim bound to a citation or to a session result.
This is the turn where the session pays off. It opened with Applied 11 decisions. Its step list shows it loading the review report and the statistical report by name, then six Verifying steps before it wrote a word, then several rounds of Writing, Revising a document and Checking the manuscript.
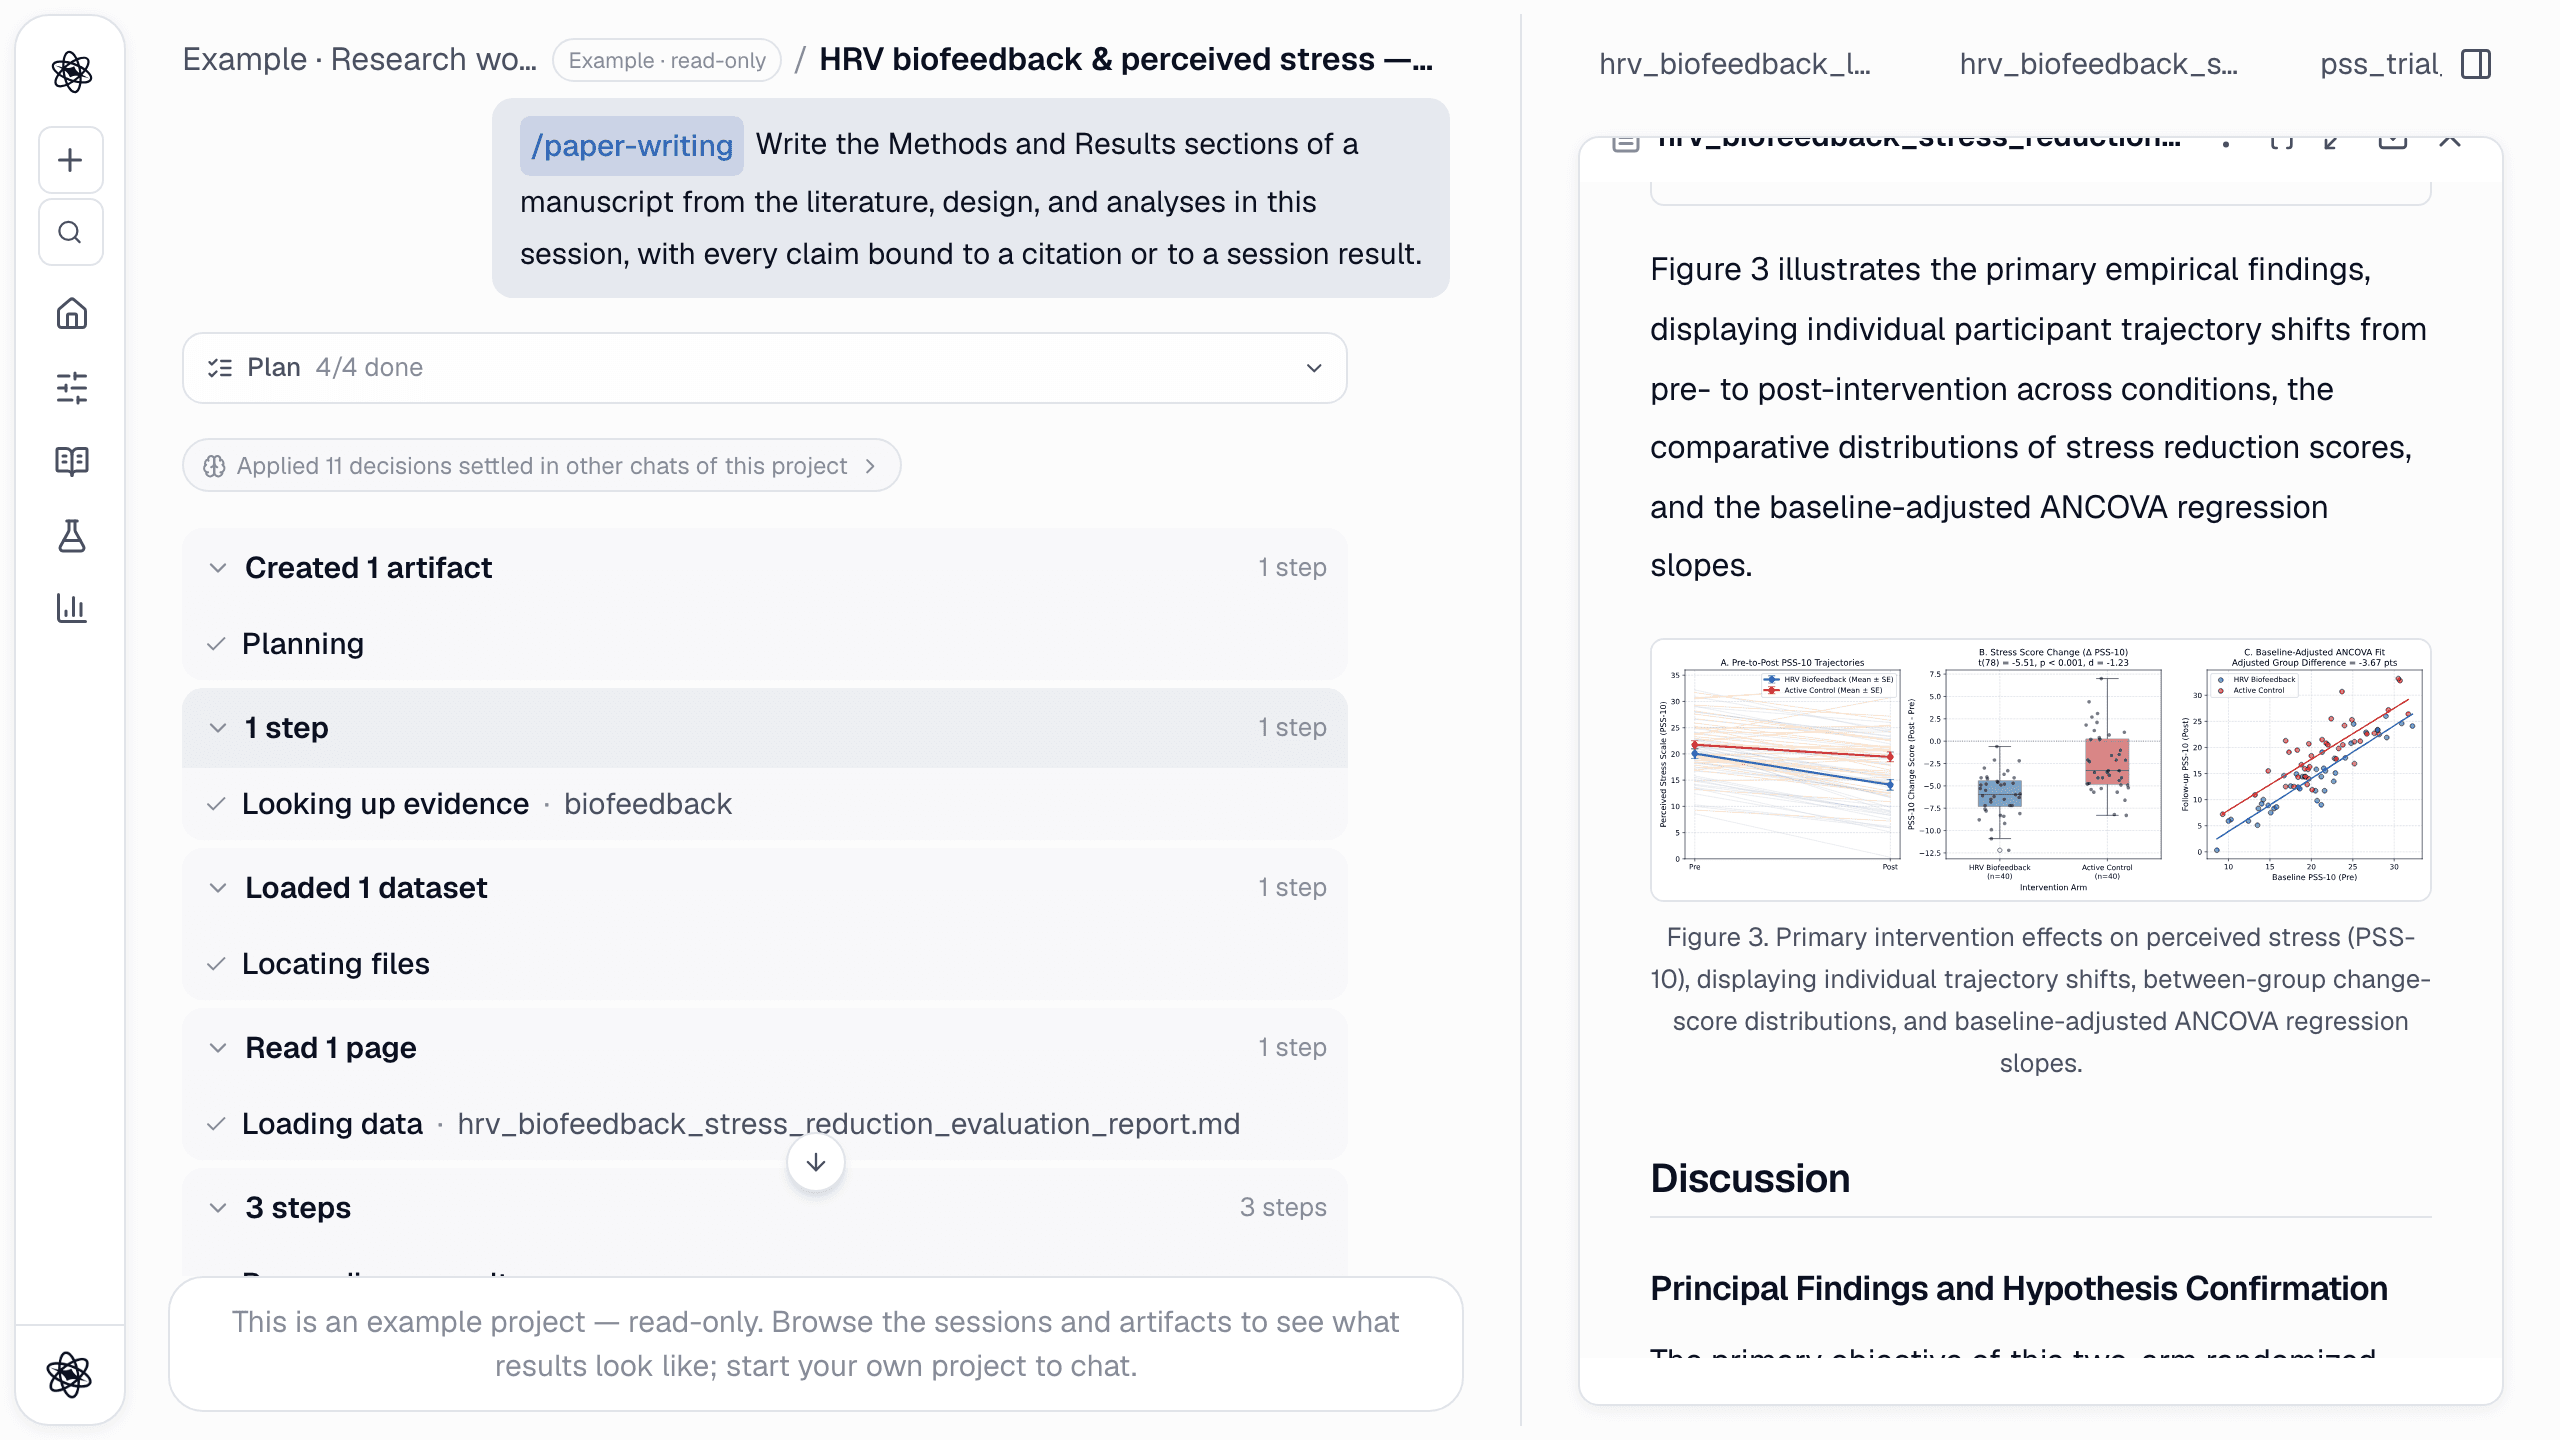
The result is Methods and Results sections whose numbers come from the statistical report and whose citations come from the screened literature. Three things in the chat transcript show how the binding works:
- "The reference list was rebuilt from this session's stored sources (6 entries) so it matches every [n] cited in the text." The references are not generated; they are looked up.
- "The manuscript was saved without its standard figures — making Figure 1 (overview) and Figure 2 (protocol) in a short extra pass." The manuscript check noticed the figures were missing and ran an extra pass to place them after their first mention.
- The manuscript ends with a claim–evidence map and a list of claims the data cannot support: tonic vagal remodelling, superiority over open-loop paced breathing, and three-month maintenance are all catalogued as untested rather than asserted.
Export is from the panel's download button: DOCX, LaTeX, PDF or Markdown. Walkthrough: writing.
Turn 9 — Report review
/report-review Independently review the manuscript written in this session — claims, methods, statistics, cited evidence, and reproducibility — and write a prioritized review report.
Report review is the session reading its own work as a stranger would. The step list shows what "independently" means in practice: the turn searched earlier chats for the manuscript and the call that created it, loaded the data file again, and re-ran the baseline tests, paired tests, the between-group comparison, the effect size and the ANCOVA from scratch. The re-analysis matched the manuscript (t(78) = 5.51, d = 1.23, ANCOVA F(1,77) = 29.22), and the report says so.
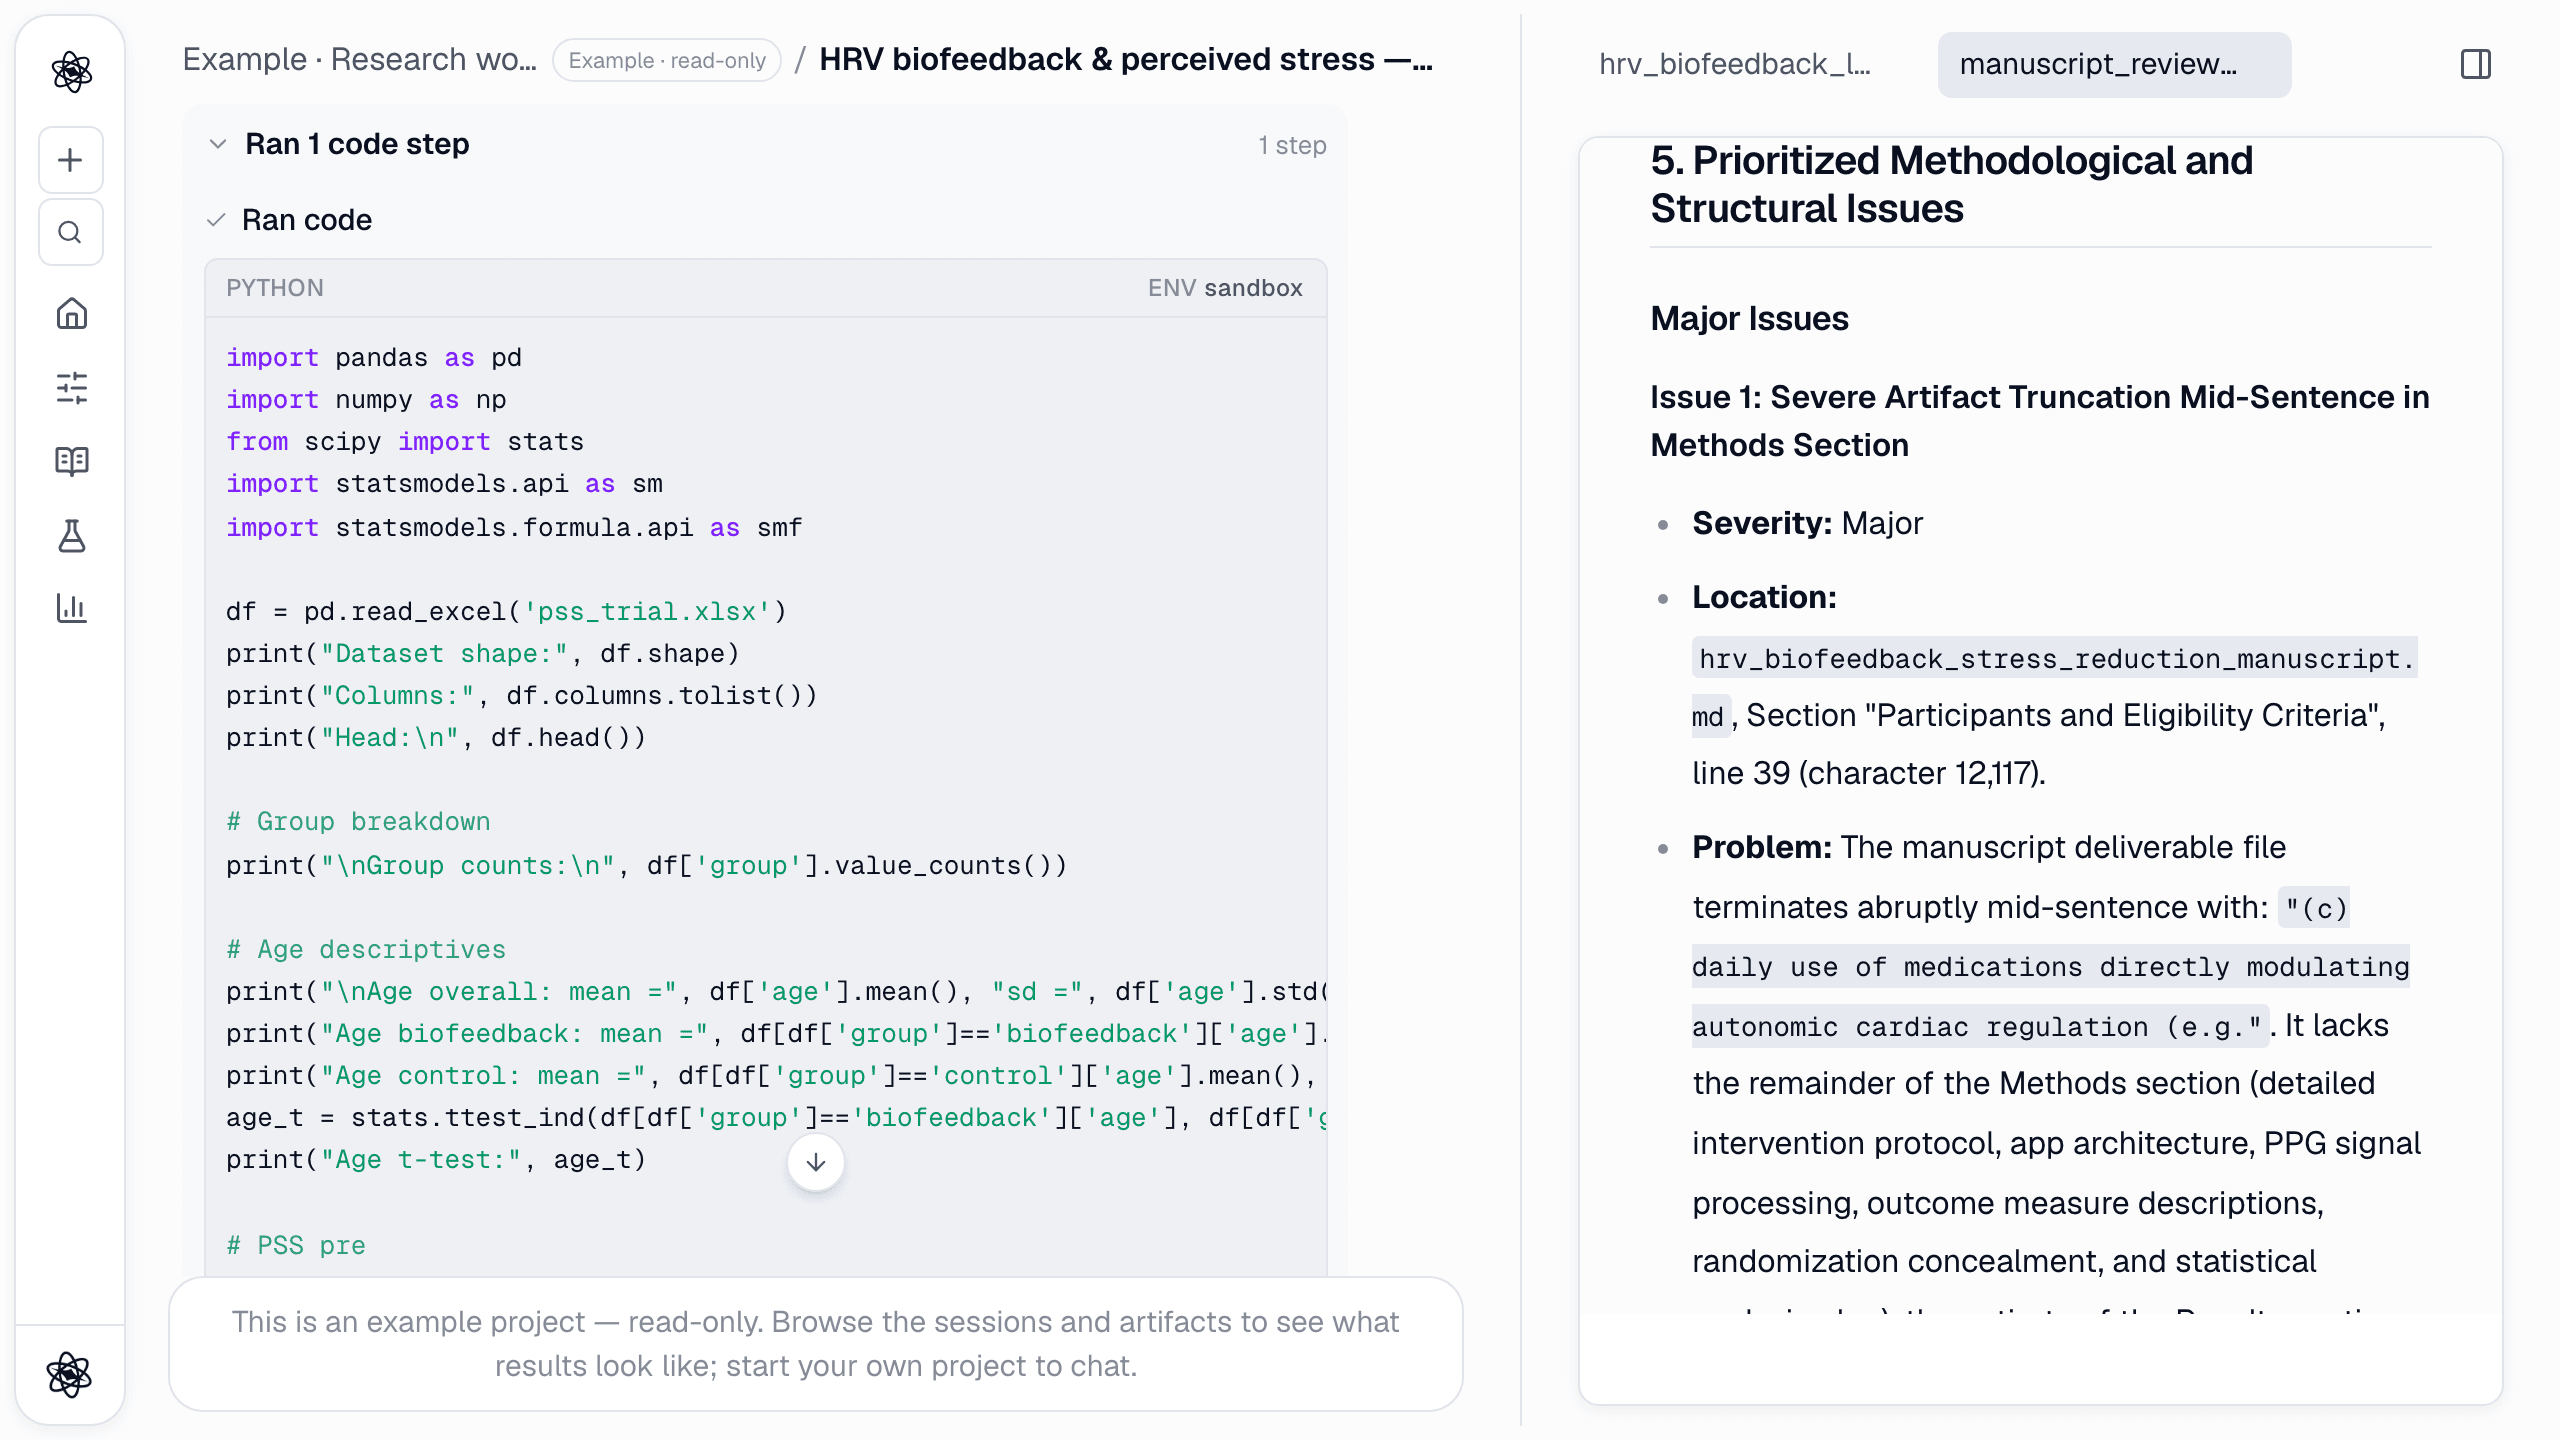
It then found two things worth fixing. The saved manuscript was truncated mid-sentence in the Methods section (a real defect in the artifact, which the author would otherwise have found at submission), and the Discussion needed to separate the effect of slow paced breathing from the effect of feedback, exactly the gap the hypotheses turn had flagged. The turn also hit its step limit and said so: "Reached the step limit for this task — the saved results above are usable; the remaining planned steps were not run." That honesty is part of the design. A review that stopped early tells you it stopped early.
Walkthrough: report review.
Turn 10 — Peer review
/peer-review Run a peer review of the manuscript written in this session for the journal Applied Psychophysiology and Biofeedback: journal profile and submission rules, comparable papers, five reviewers with scores, the editorial decision, a revision guide and recommended journals.
Peer review simulates a journal rather than a reader. The turn built a profile of the target journal and extracted its submission rules, found eight comparable papers the journal had published, convened five reviewers with different briefs (journal fit, methodology, domain expertise, broader perspectives, devil's advocate) and had an editor rule on their disagreements.
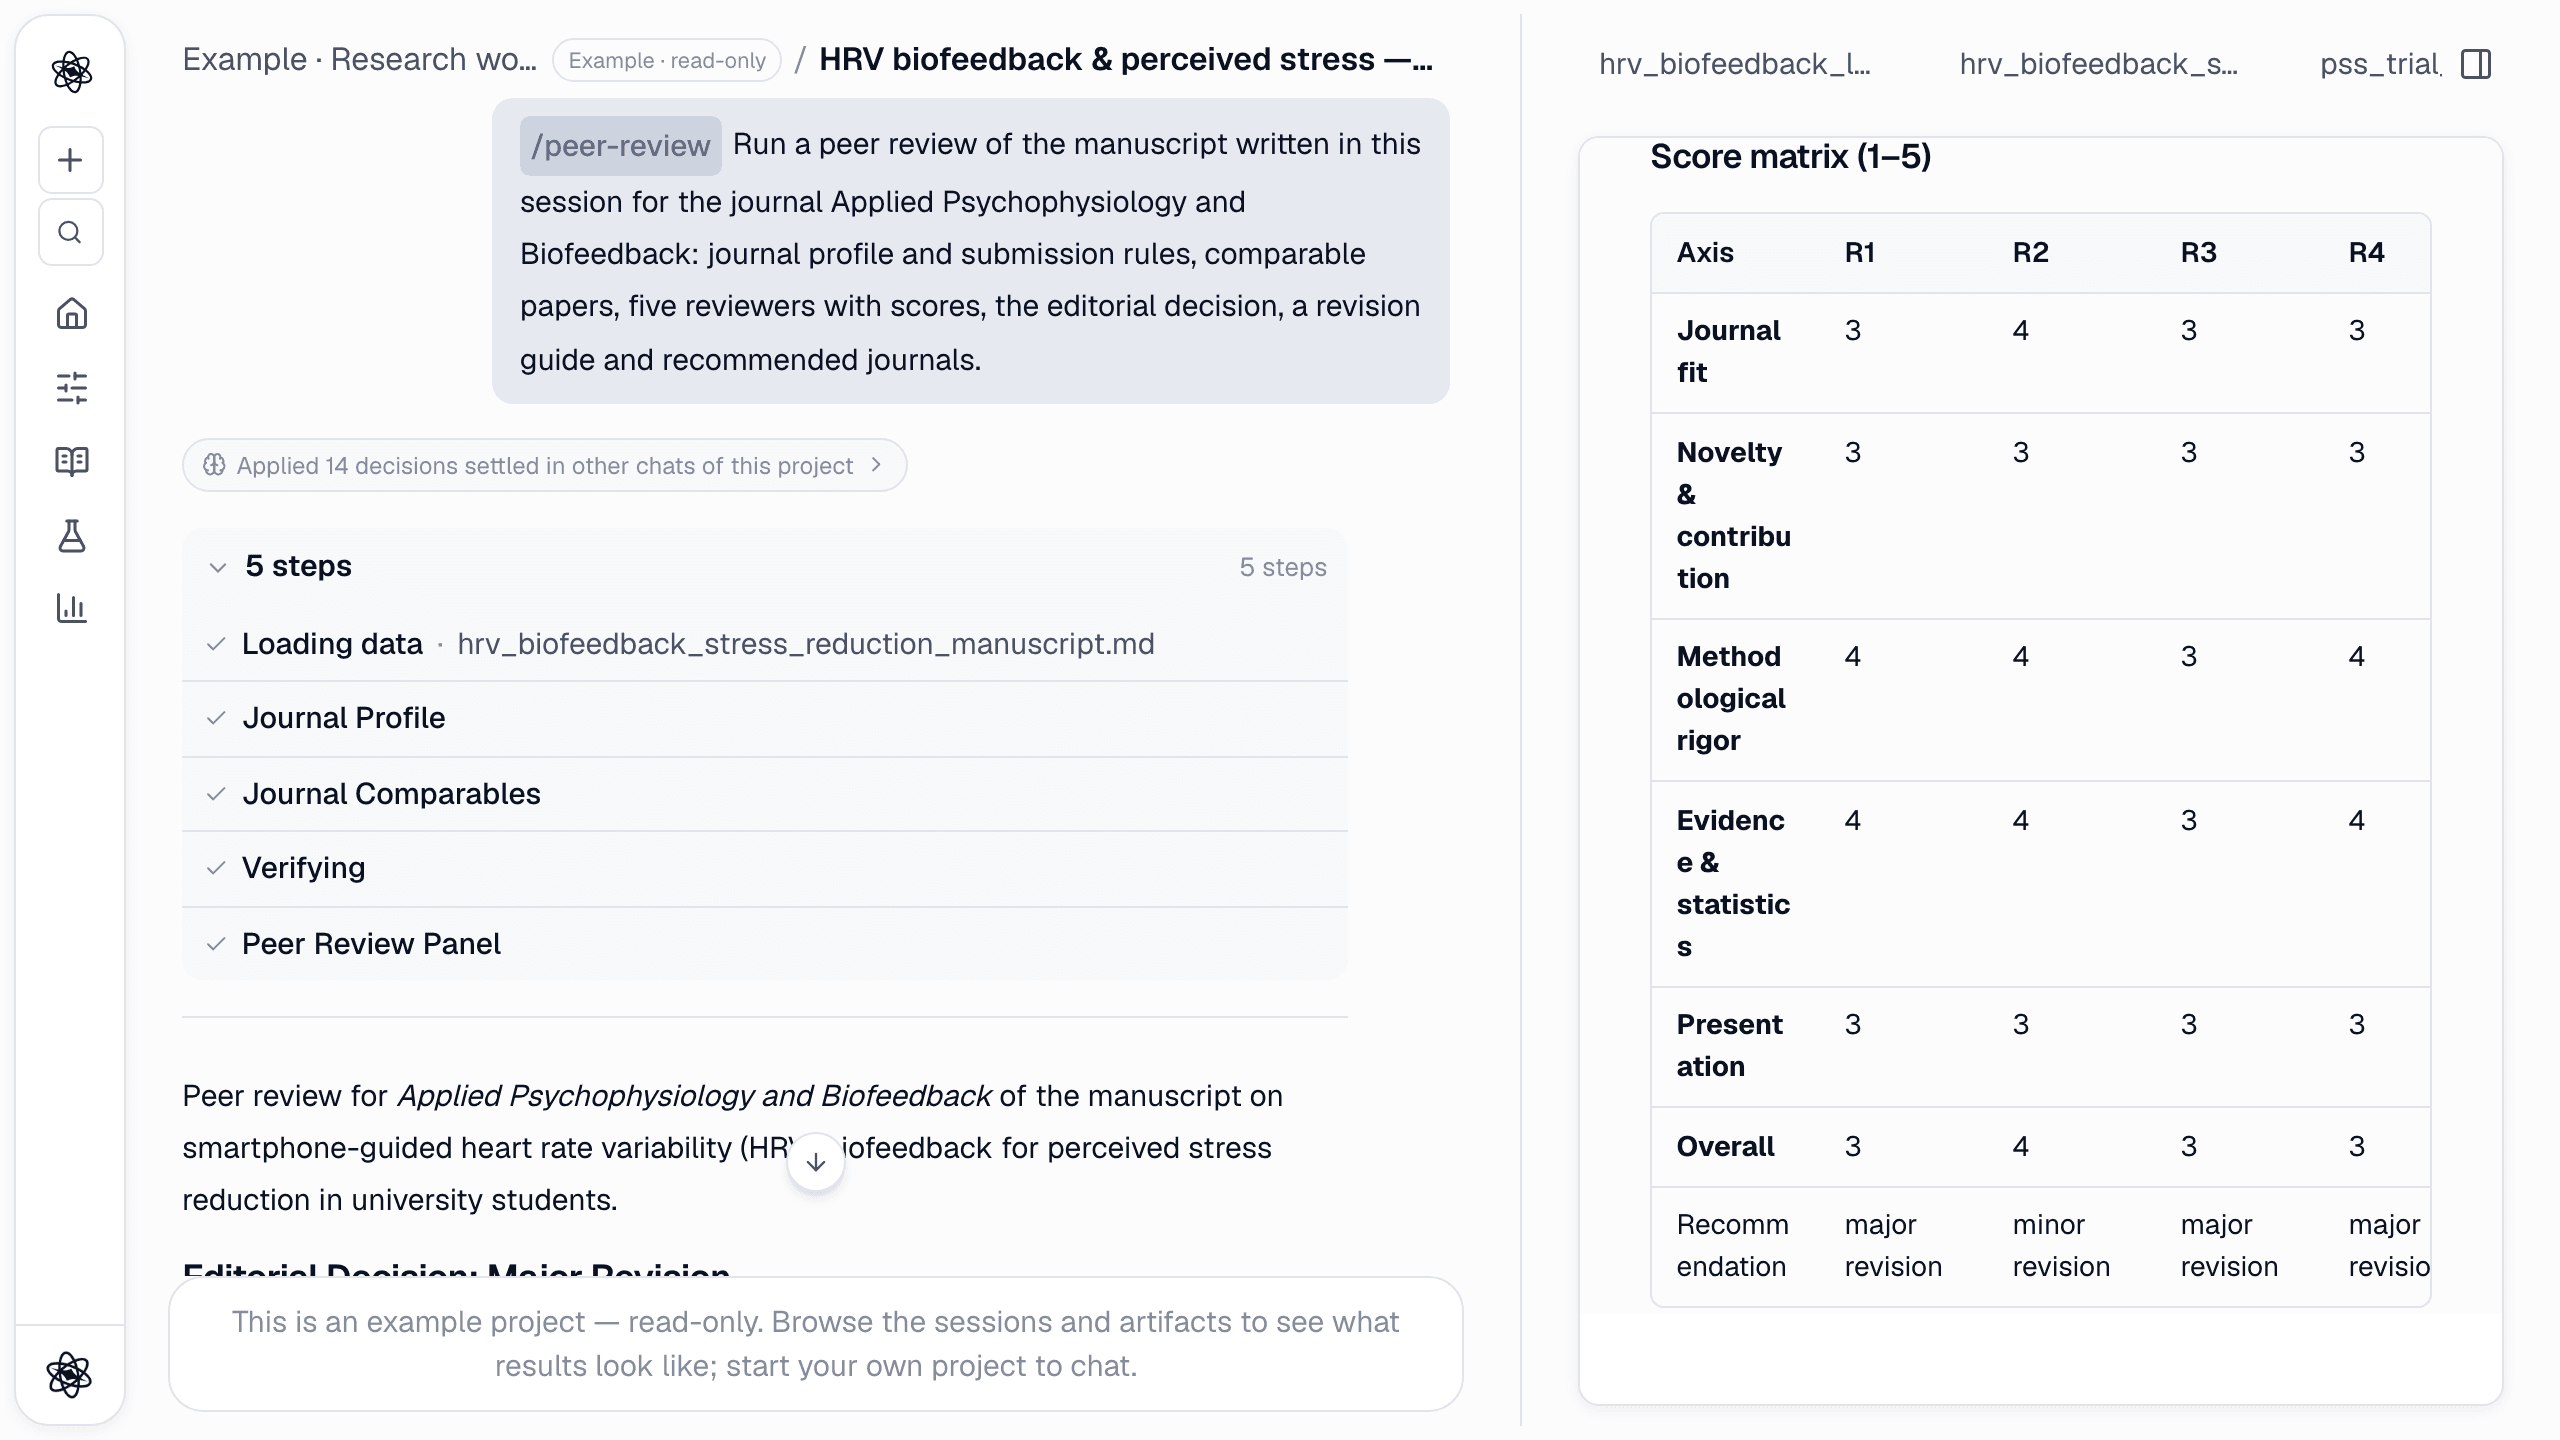
For the English manuscript the decision was Major Revision, and the reasons are specific. The abstract was 265 words against a 250-word limit. The citations were numeric where the journal wants APA 7th. The declarations page was missing. The domain reviewer pointed out that a fixed six-breaths-per-minute protocol is paced breathing with feedback, not individualized resonance-frequency training, and that the app logged pulse data the manuscript never reported. The report ends with a revision guide ordered P0 to P2 with effort estimates, a submission-rule checklist marked pass/fail, deterministic checks (all six references verified, ten statistics consistent) and four alternative journals. The other language runs reached their own decisions, which is what you would expect from five reviewers reading a different manuscript.
Walkthroughs: peer review and how the reviewers' scores were calibrated: calibrating peer review.
Turn 11 — The lab-meeting deck
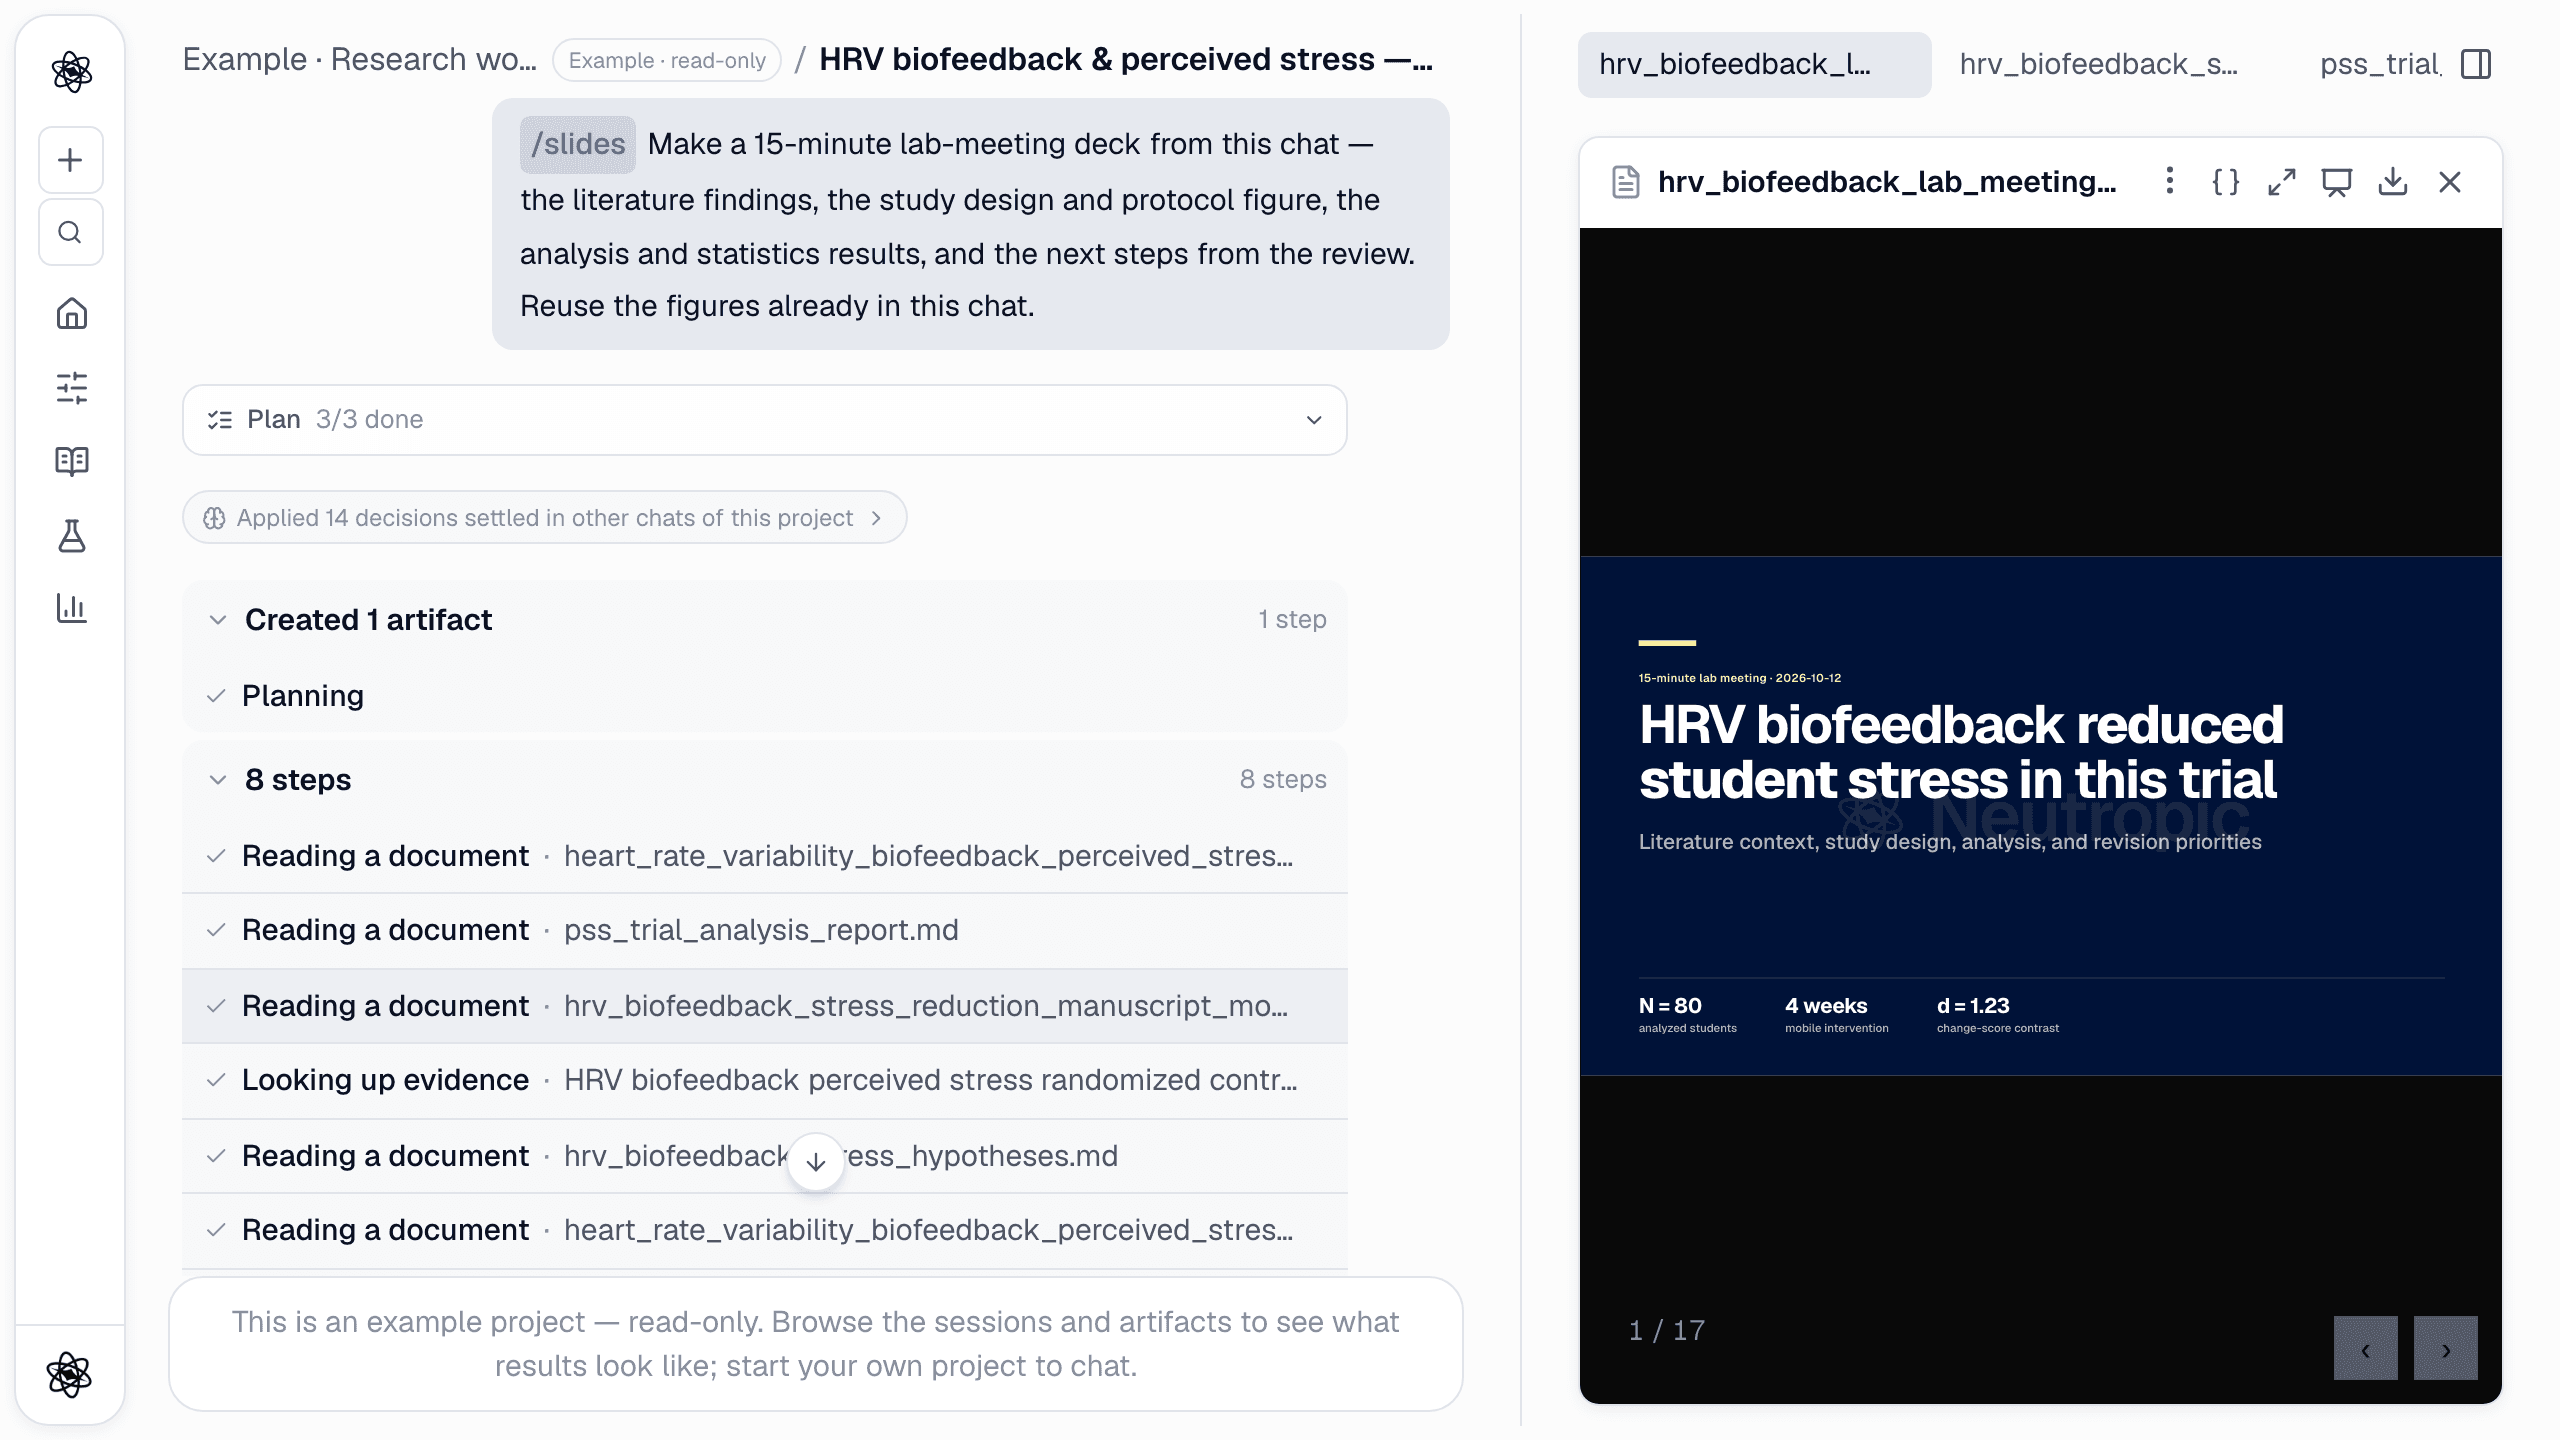
/slides Make a 15-minute lab-meeting deck from this chat — the literature findings, the study design and protocol figure, the analysis and statistics results, and the next steps from the review. Reuse the figures already in this chat.
The last turn is the clearest demonstration of what a session holds. With Applied 14 decisions, the agent read the design report, the analysis and statistical reports, the hypotheses, the review and the peer-review reports, then built a 17-slide deck that reuses the protocol-flow and results figures. Its own summary draws the line that matters: the deck "distinguishes planned design details from the analyzed dataset and does not present physiological changes or 3-month outcomes as findings". It also said which artifacts it had left out and why. Press Present in the panel to run it full screen, or download PPTX, PDF or HTML.
Walkthrough: slides.
What held it together
Looking back over the eleven turns, four mechanisms did the work that a person usually does between tools.
- Artifacts are the memory. Each turn reads the earlier files it needs, by name, and the step list shows which ones. The manuscript did not remember the statistics; it loaded the statistical report.
- Settled decisions accumulate. The Applied N decisions chip went from 3 to 6, 7, 11 and 14 as the project learned what had been fixed: outcome, arms, sample, test, journal. Stating a decision in the chat is the surest way to make later turns honour it.
- Sources are stored, not remembered. The literature turn's sources stay with the session, so the manuscript's references and the peer review's comparisons point to real papers. The session ended with 61 stored sources, 9 of them cited in the manuscript.
- Checks are turns too. The manuscript check, the Report review's re-analysis and the Peer review's rule checklist are all part of the same chat, reading the same files. The one scientific gap in this study, feedback versus paced breathing, surfaced in the hypotheses turn, was disclosed in the manuscript, and was raised again by both reviews.
Two practical notes. A session this long is fine for the model: context is managed automatically, and /compact summarizes the conversation if you want to trim it by hand. And tokens: the full run used about 2.1 million managed tokens, most of it in the writing, review and slides turns. The Free plan's daily cap means spreading a workflow like this over a few days; paid plans raise the cap and add premium models. See Plans & tokens and the tokens guide.
Where you come in
Neutropic drafts and checks; the research is still yours. The places where the session stopped and waited for judgement are the places to spend your time:
- Choose the hypothesis, and make it one the design can actually test.
- Upload real data, and check the N against your enrolment log.
- Read the three or four papers the argument rests on.
- Fix what the Report review found before anyone else reads the draft.
- Treat the Peer review's revision guide as a to-do list, not a verdict.
When the session is done, share it rather than exporting it: a read-only link opens the same screen for your advisor or co-author, artifacts and all.
Open Example · Research workflow from My Library, expand the step lists, and follow one number, say d = 1.23, from the statistics turn through the manuscript, the review and the deck.