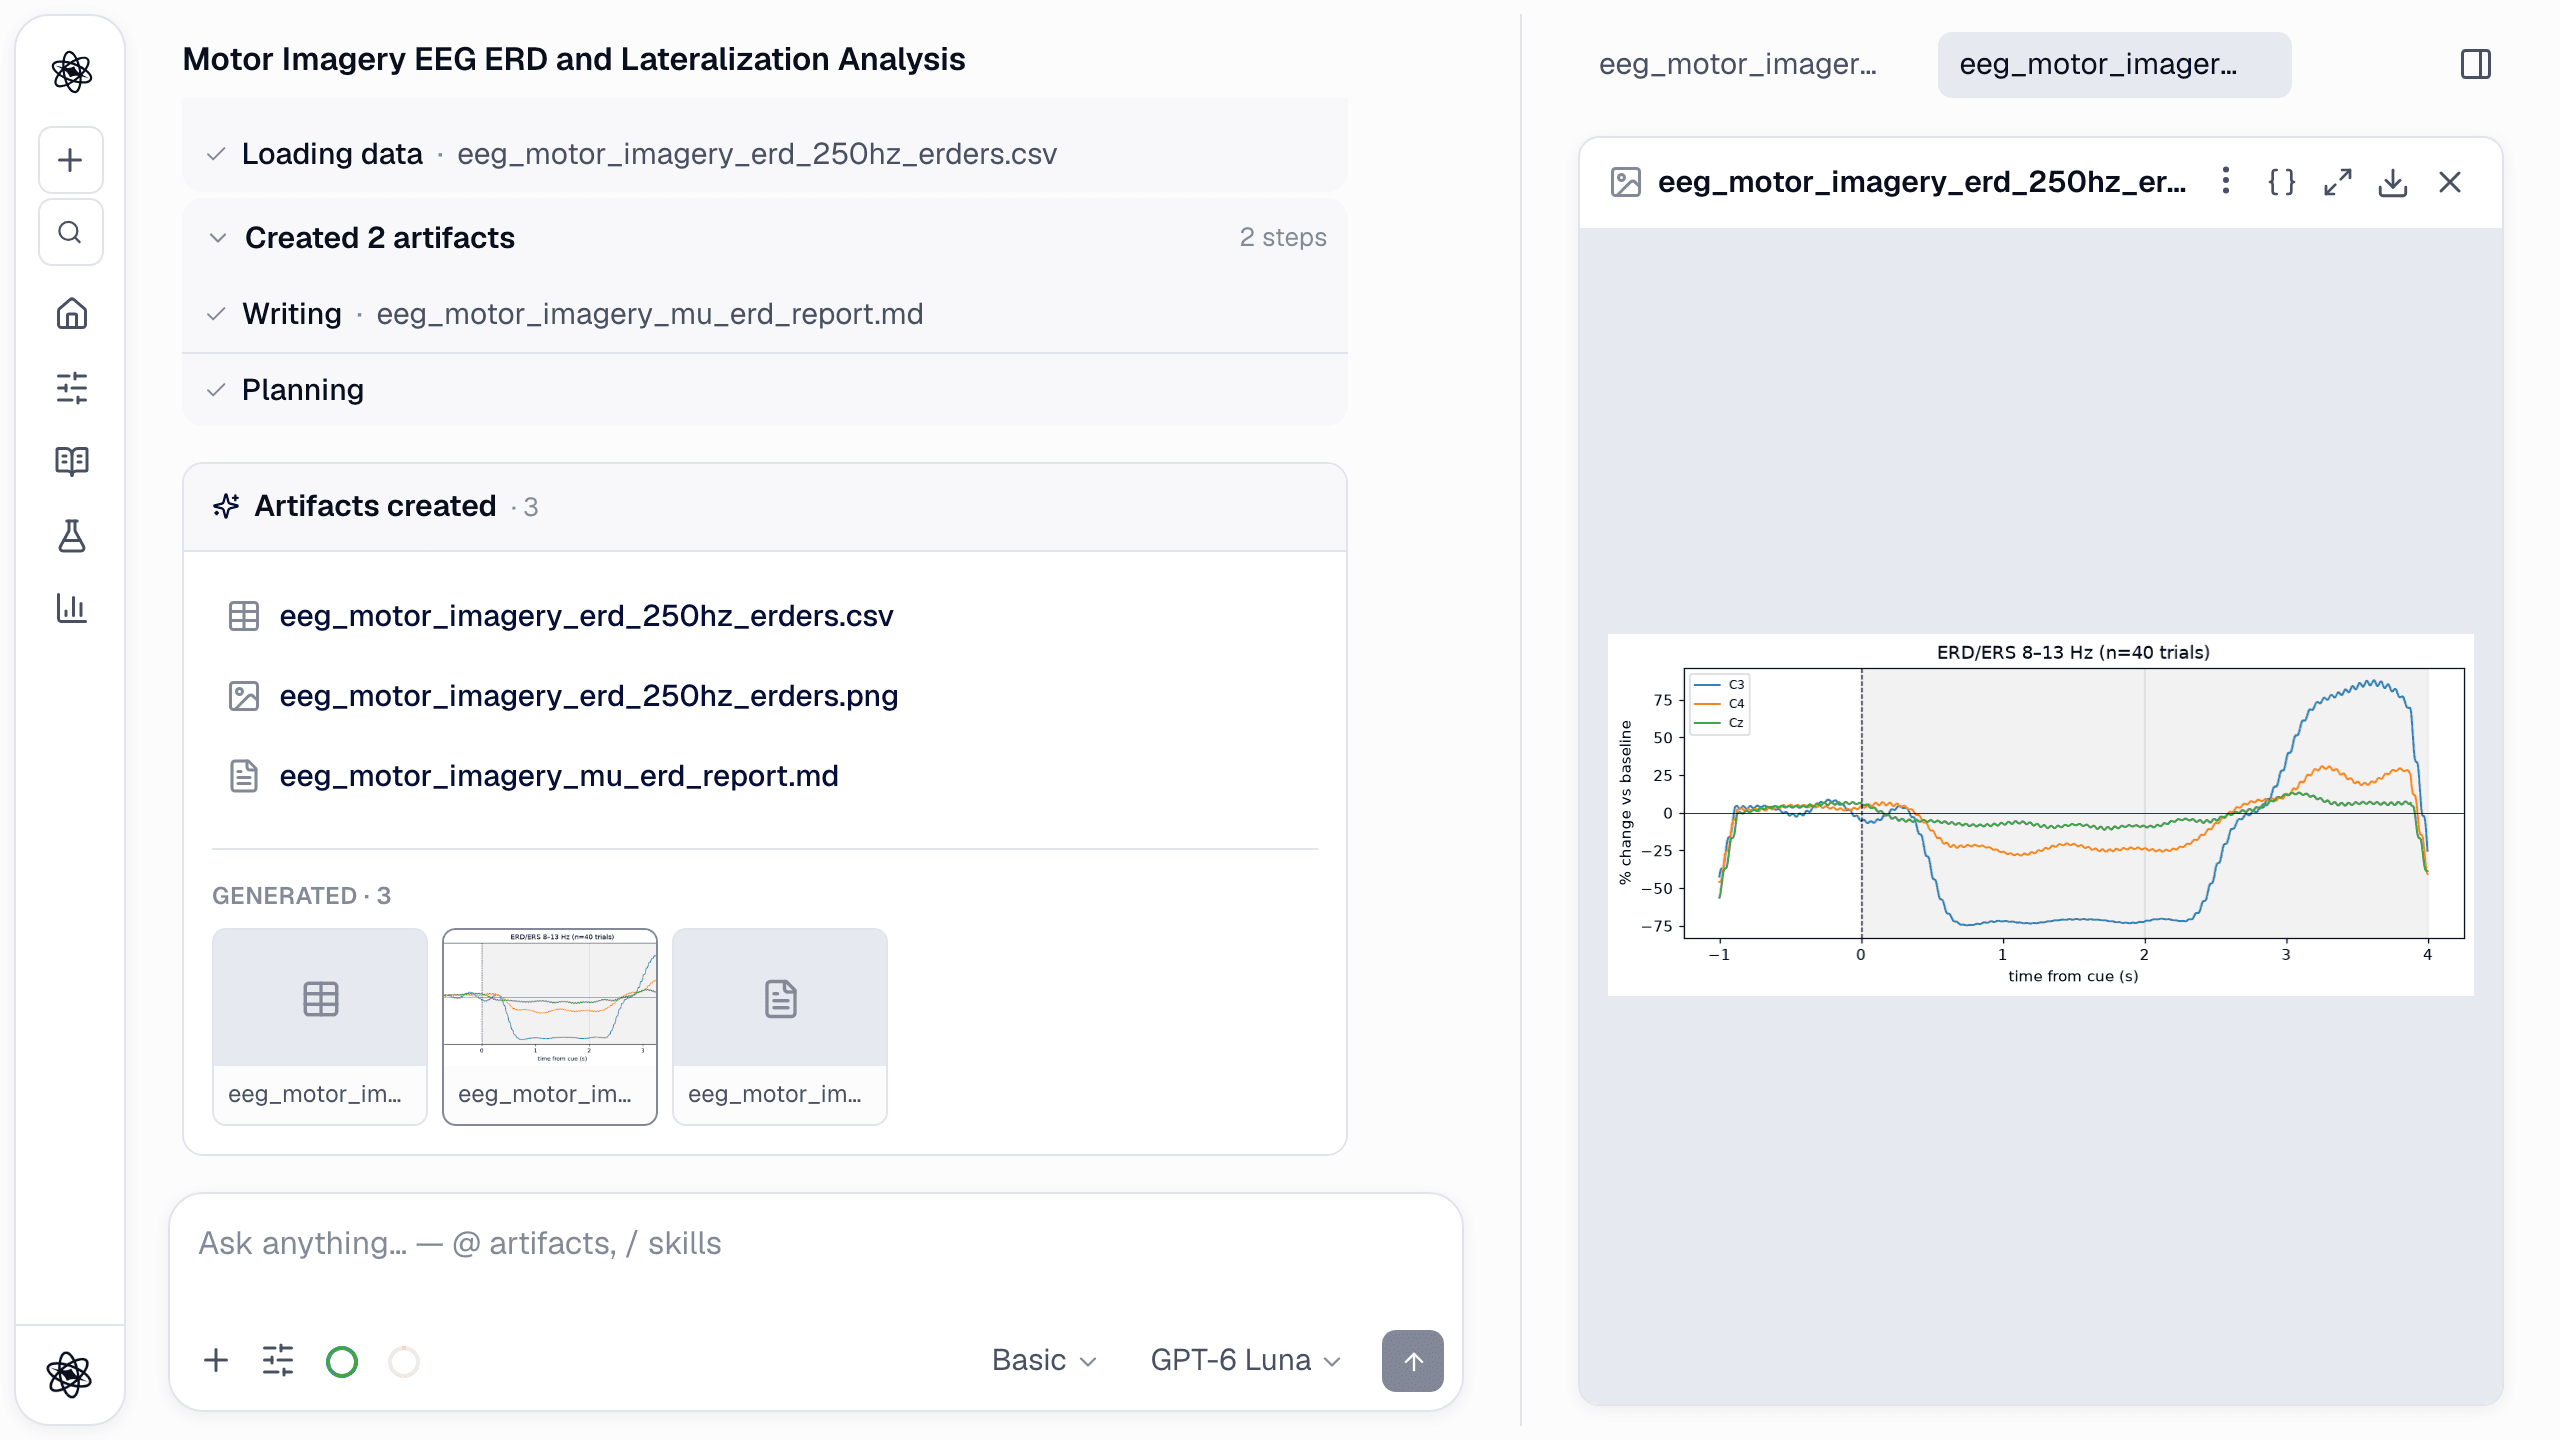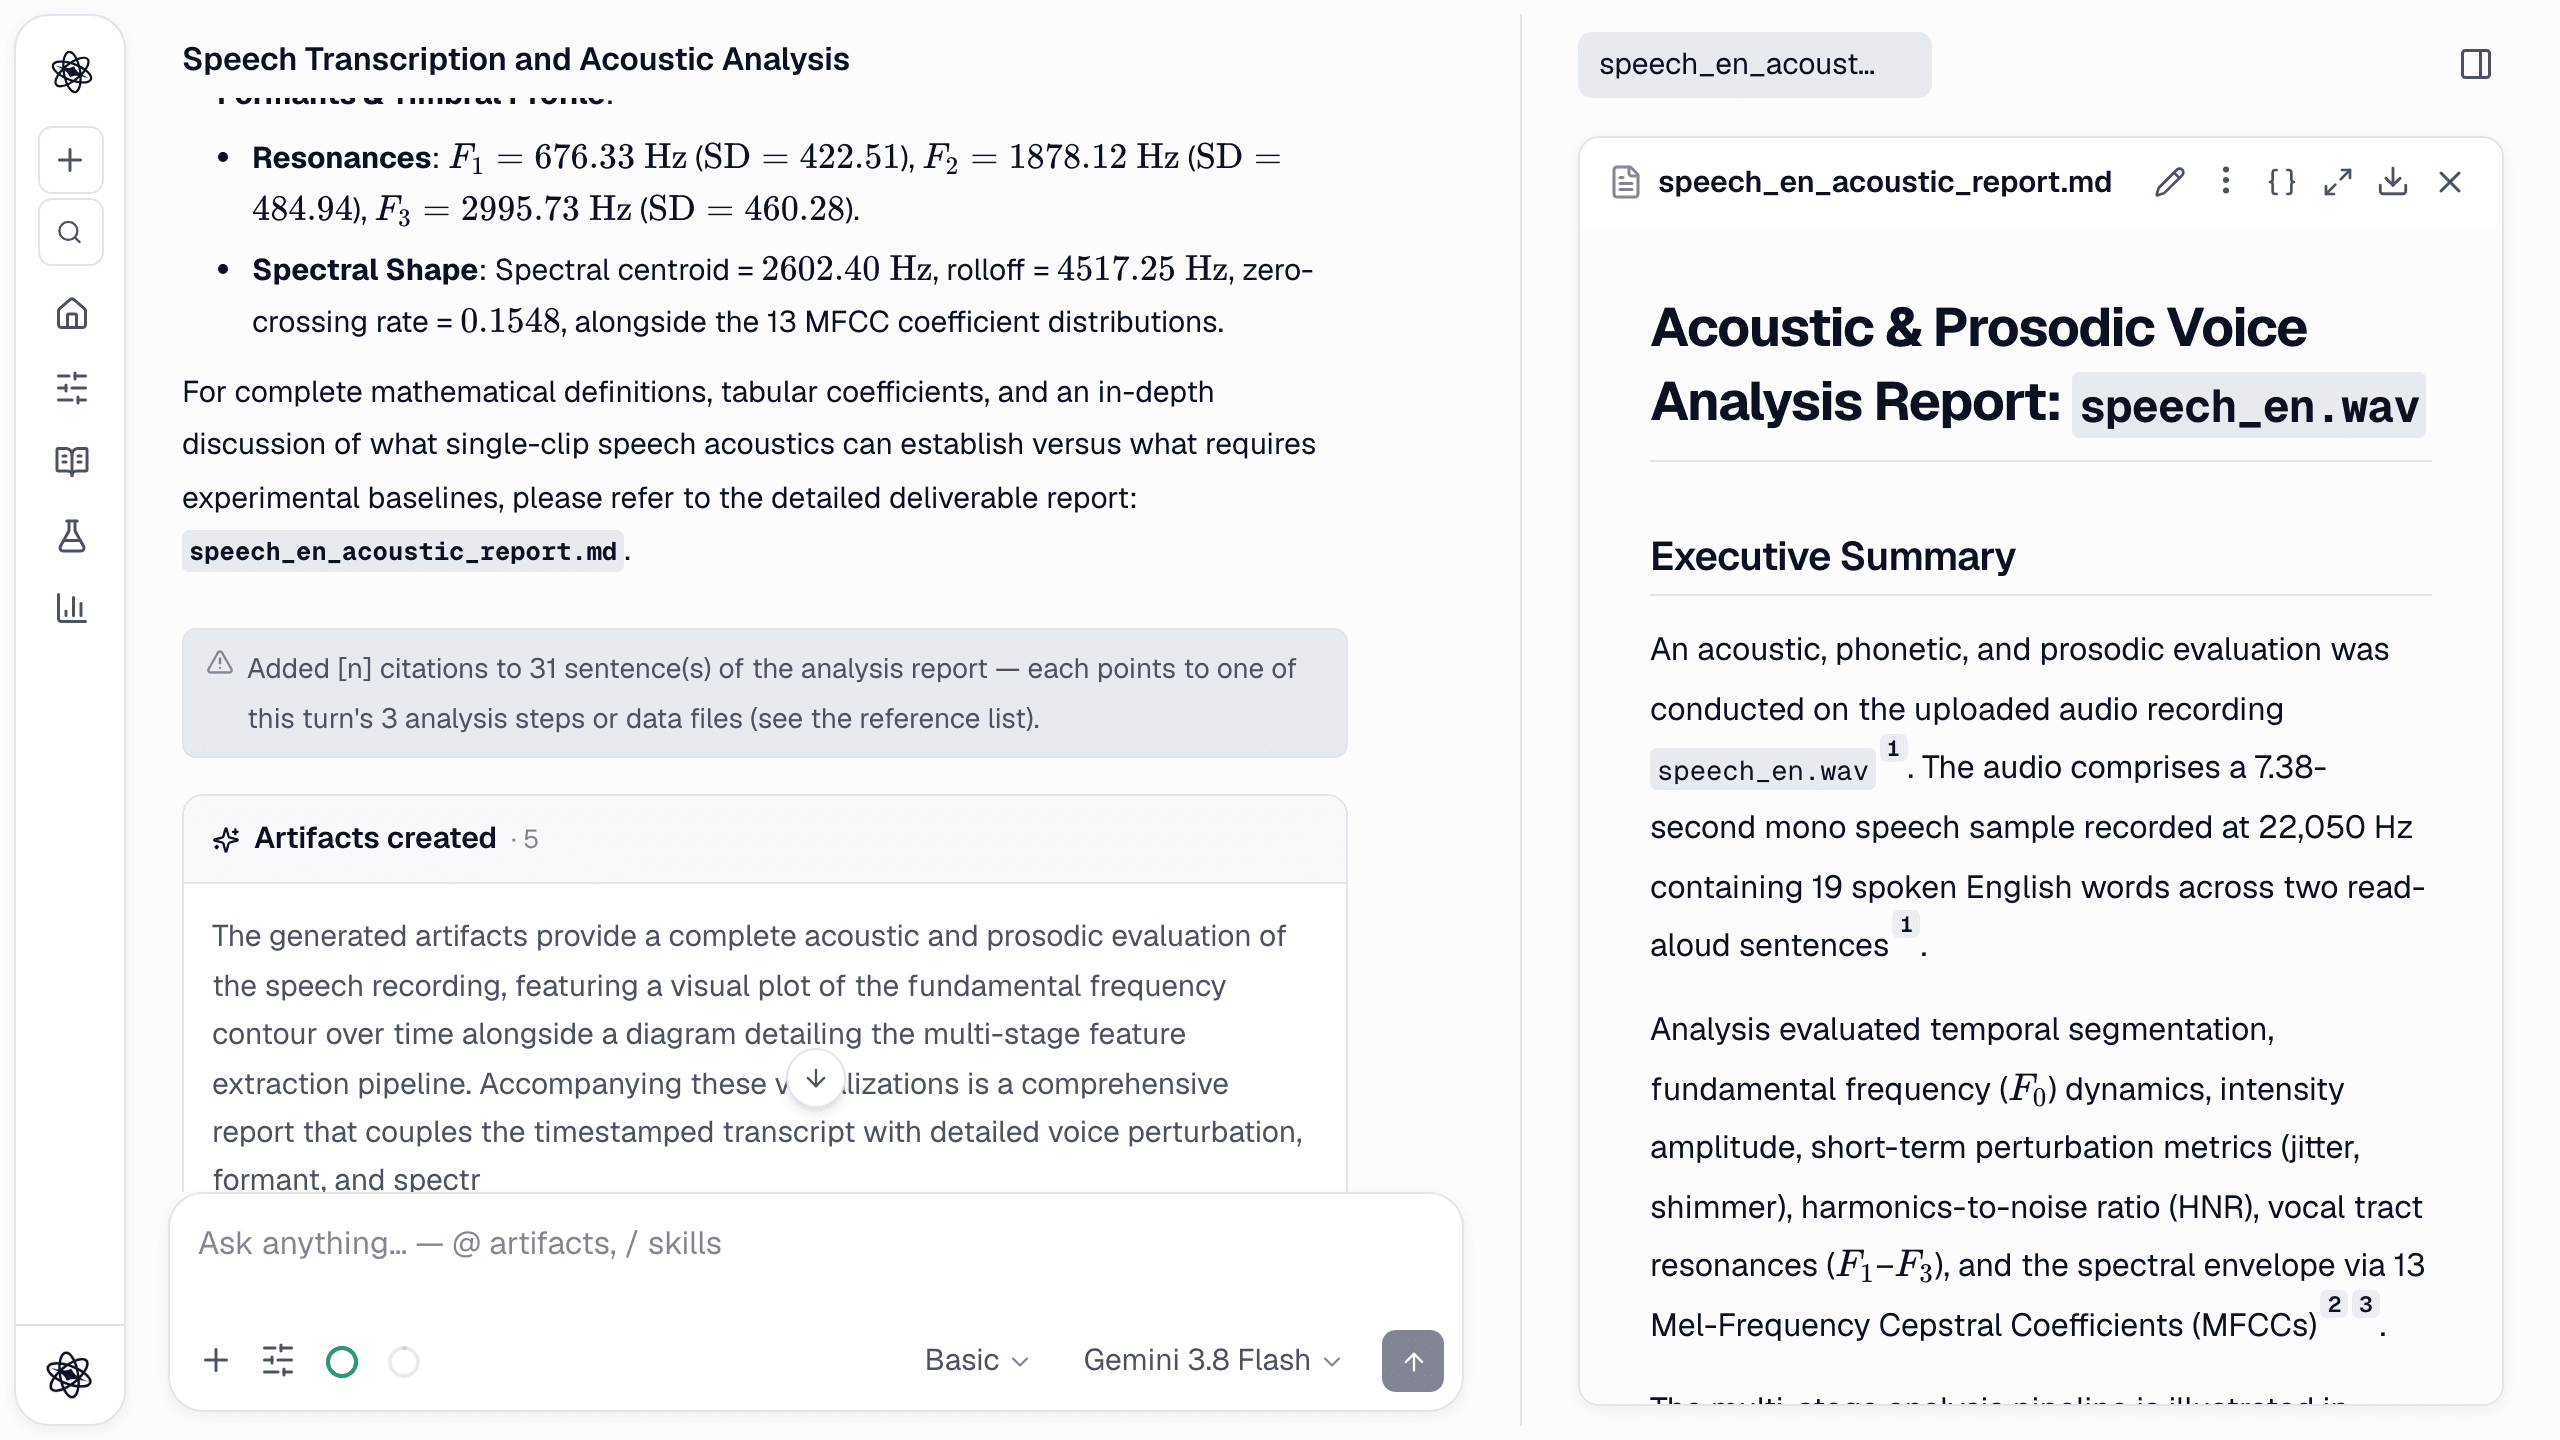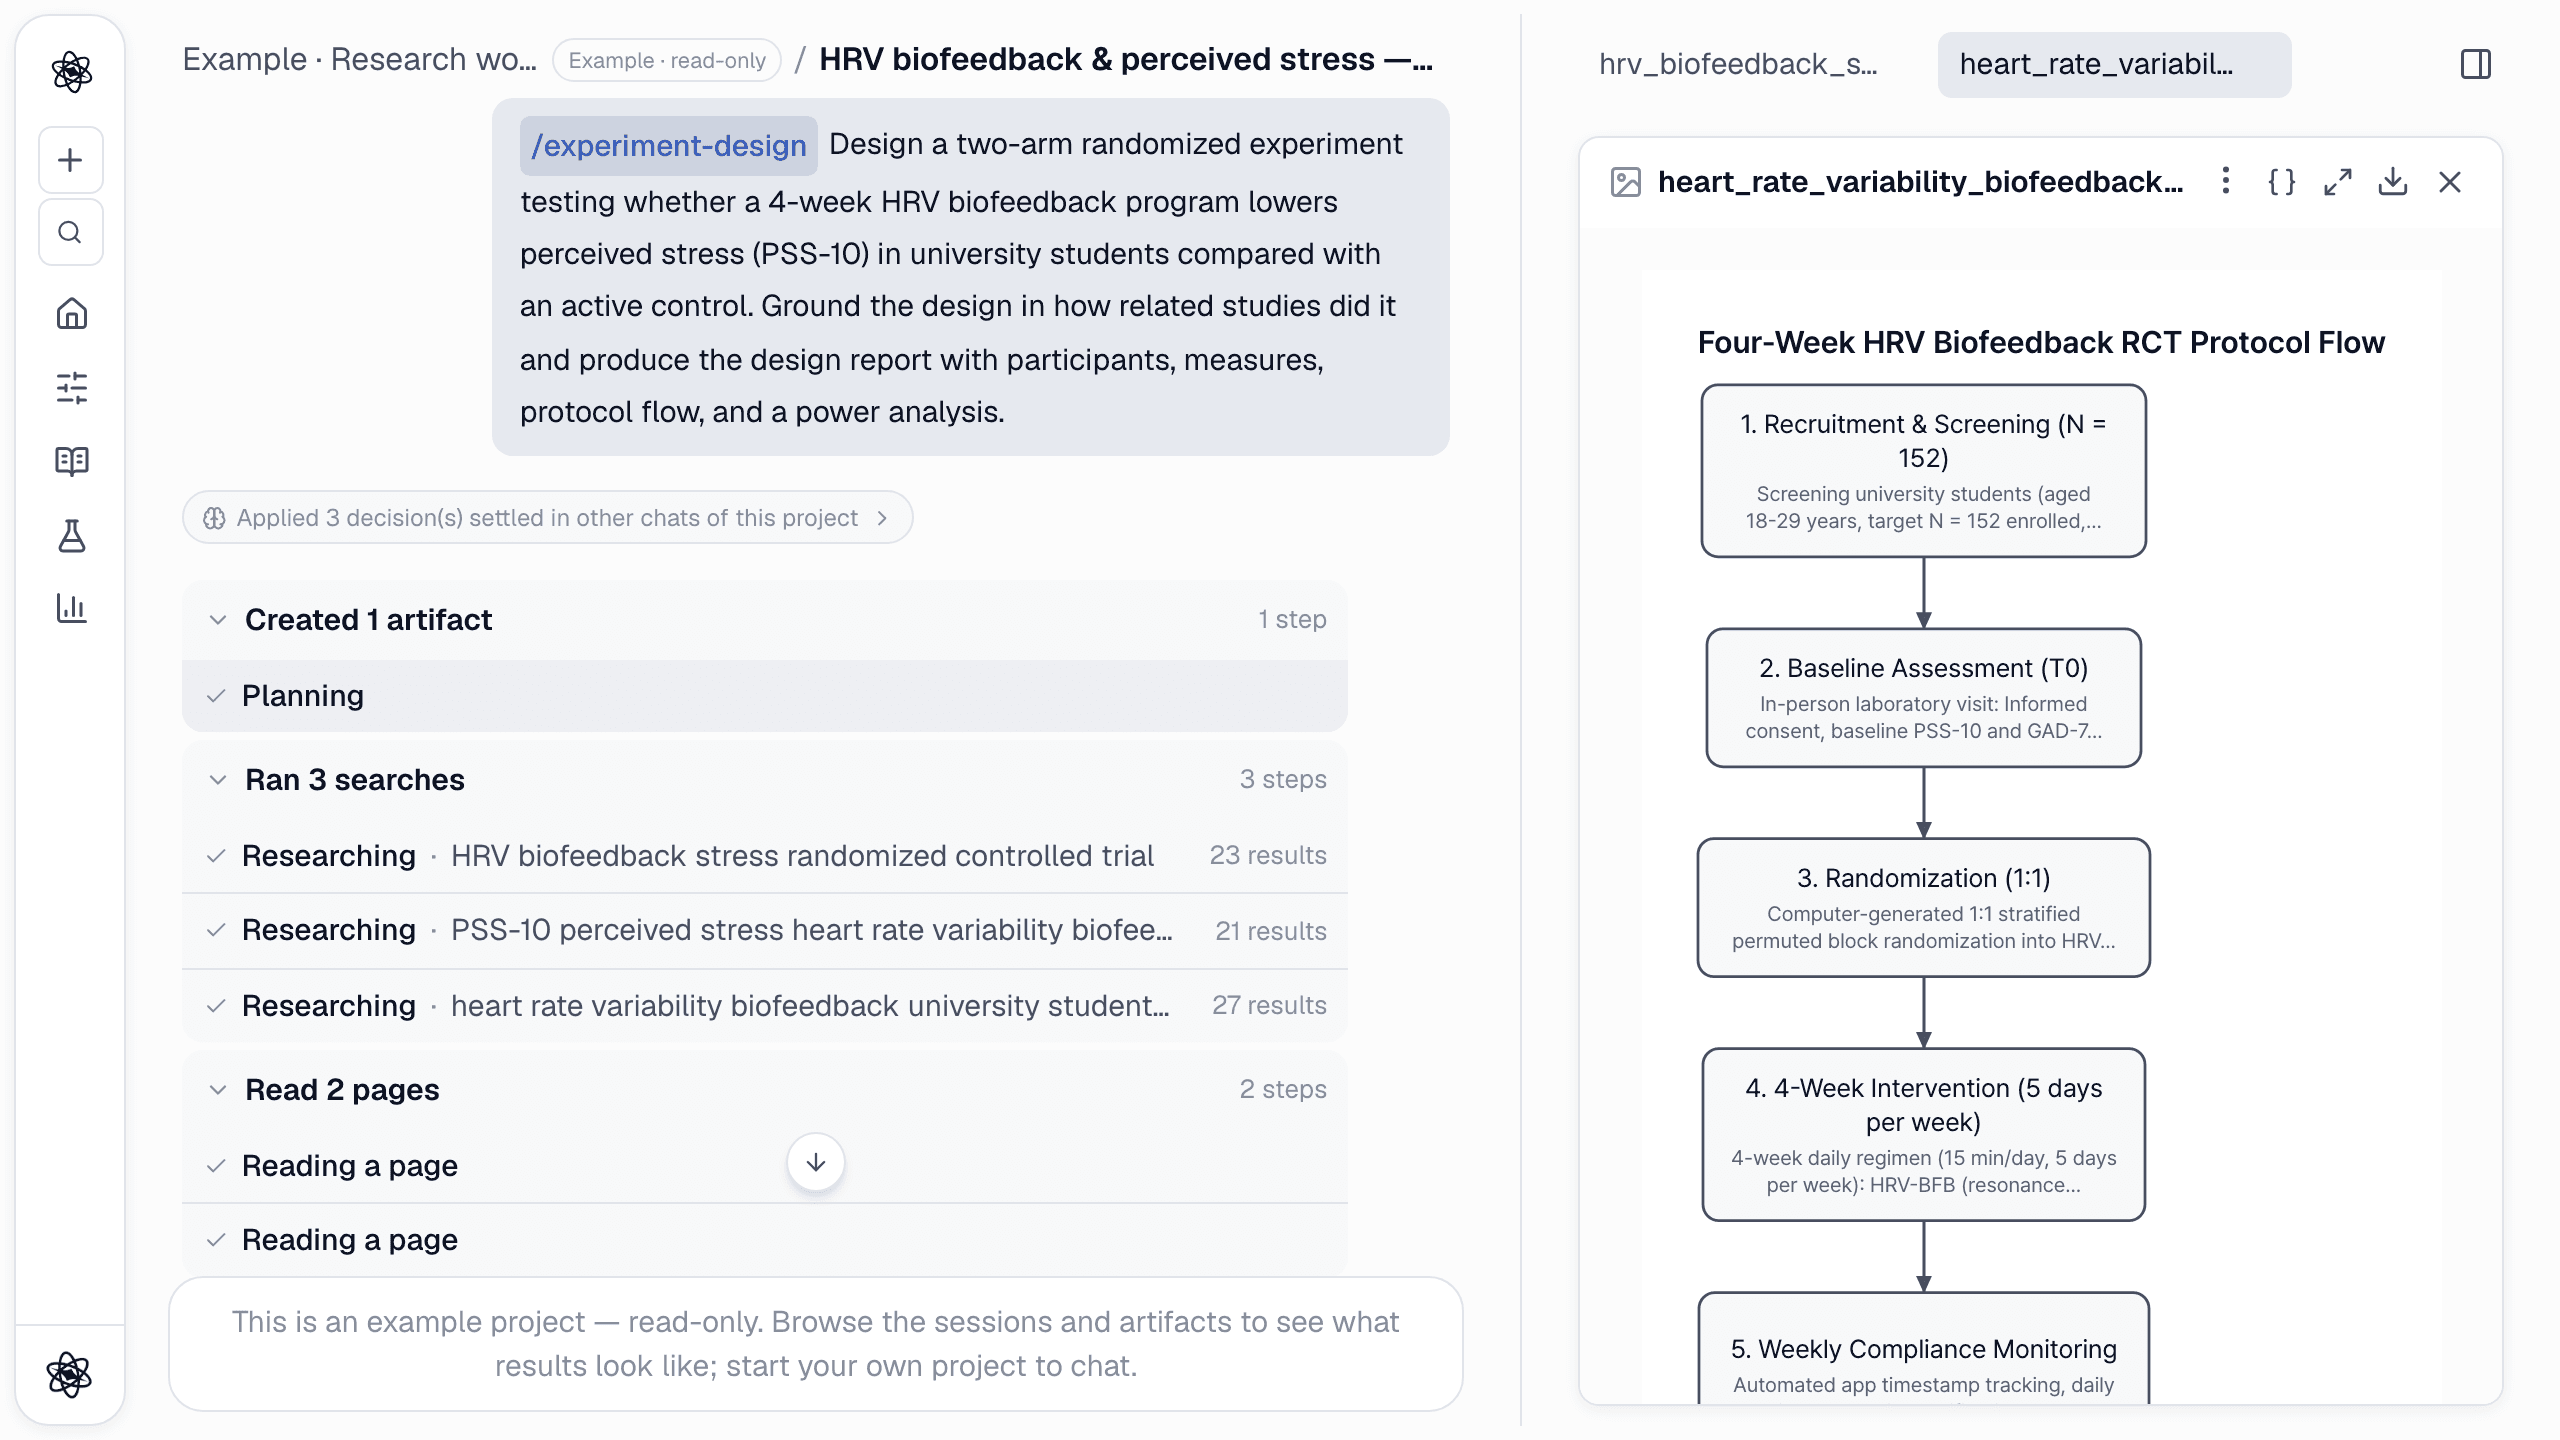
A thesis is not one task. It is a literature review, a study design, an ethics application, an analysis, a set of figures and a few chapters, and each part has to agree with the rest. That is what trips students up: the power analysis in the proposal doesn't match the test in the results chapter, or a figure shows a follow-up the protocol never mentions. This guide follows one realistic thesis study through Neutropic, stage by stage. For each stage you get the prompt the student typed, what came back, and what to check before you show it to your advisor.
The study asks whether a 4-week heart-rate-variability (HRV) biofeedback program lowers perceived stress (PSS-10) in university students. All of it lives in Example · Research workflow, a read-only example project that every account can open from My Library. It is one chat with ten turns, run in the four site languages. The quotes and numbers below come from the English run. The other language versions came out with slightly different designs, which is a good reminder that you still have to read what you get.
Before you start: one project per study
Make a project for each study or chapter (the folder button next to My Library) and run the stages inside it. A project holds three things:
- Every artifact its chats produce. Reports, figures, tables and manuscripts stay in one place, and you can @-mention any of them in a later message.
- Project memory. Once something is settled ("the primary outcome is PSS-10", "the control is paced breathing at a normal rate"), later chats start with it. In the example, the writing turn opened with Applied 11 decision(s) settled in other chats of this project. Click that line to see exactly which decisions were used.
- Your uploads: data files, PDFs and your advisor's comments.
The rest of this guide goes turn by turn. Each stage links to its own detailed walkthrough, so the steps aren't repeated here.
Stage 1 — Literature review
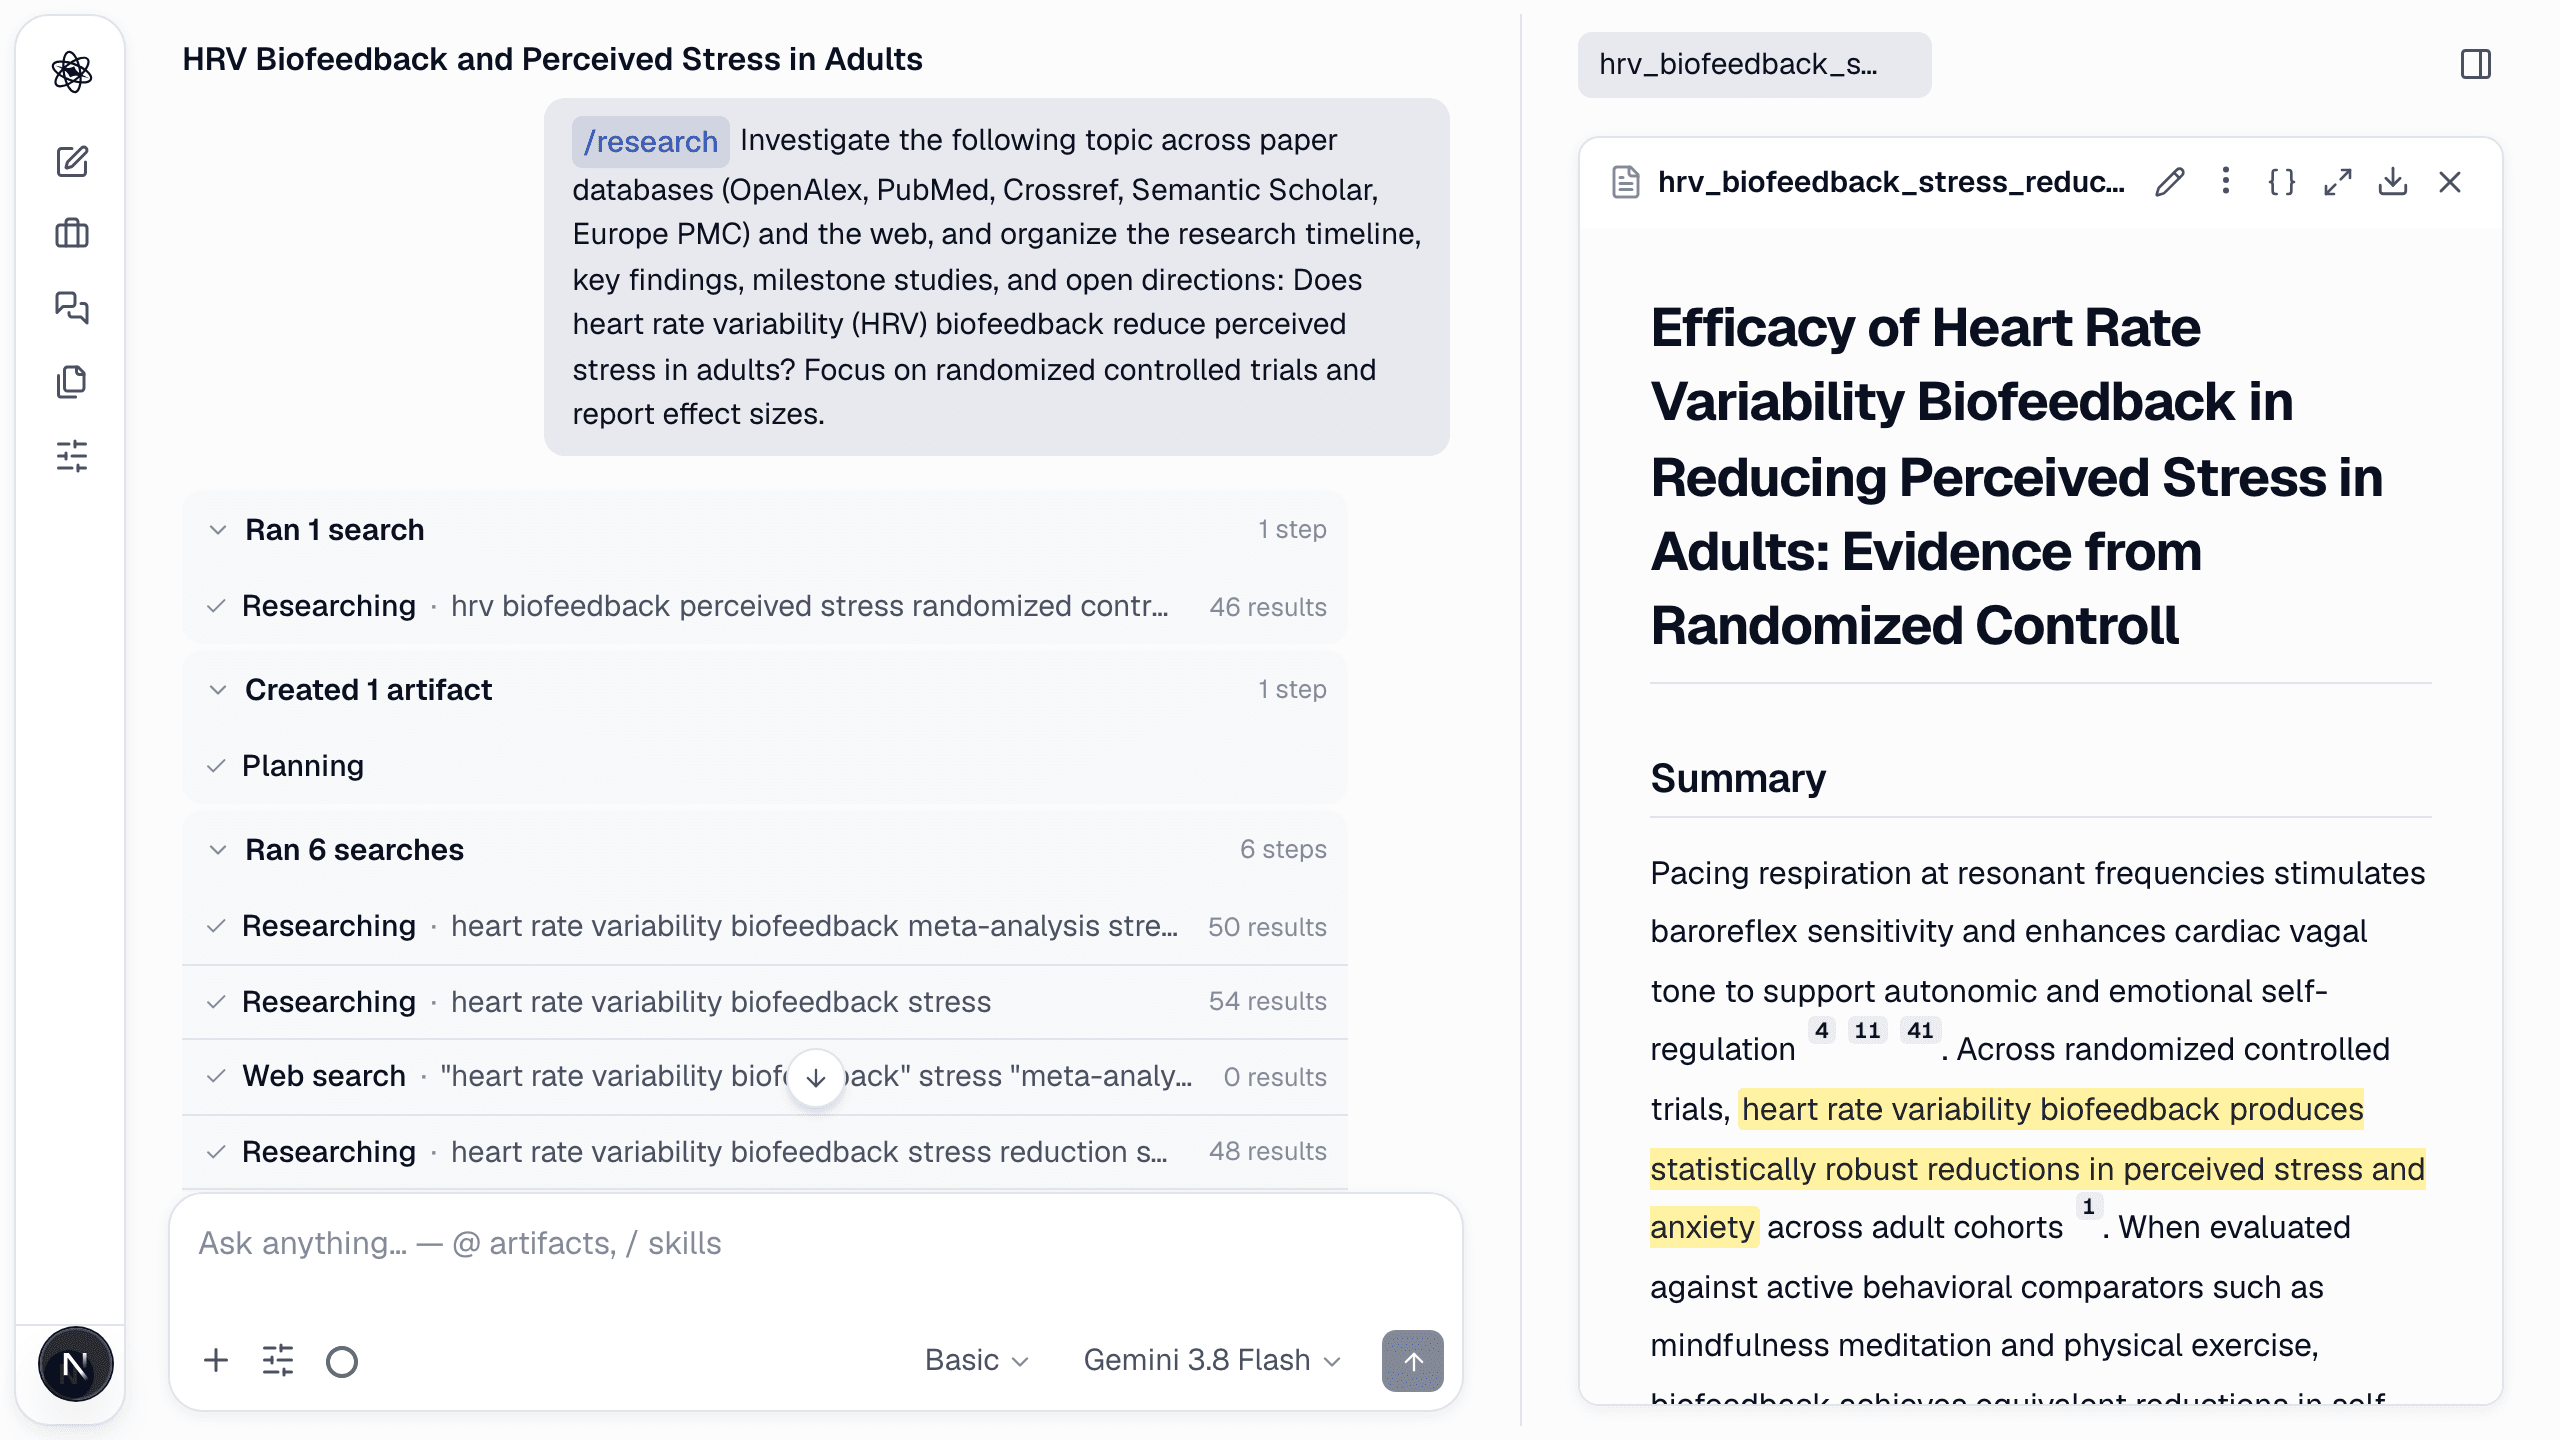
/research Investigate the following topic across paper databases (OpenAlex, PubMed, Crossref, Semantic Scholar, Europe PMC) and the web, and organize the research timeline, key findings, milestone studies, and open directions: Does heart rate variability (HRV) biofeedback reduce perceived stress in adults? Focus on randomized controlled trials and report effect sizes.
What comes back is a review report where each sentence carries numbered citations to sources that were actually retrieved. With it you get a screening table of the papers found, a research timeline, a citation graph and a mind map. The meta-analyses (Goessl et al., 2017, among them) and the multi-arm RCTs it identified became the anchors for everything that followed.
Before your advisor sees it: open the three or four papers your argument rests on and check that each claim says what the paper says. The report is a map of the literature. It doesn't replace reading it. Full walkthrough: literature review.
Stage 2 — Hypotheses
/hypothesis From the literature collected in this session on HRV biofeedback and perceived stress, map the research space, list the gaps and contradictory findings, and generate testable hypotheses ranked by novelty, plausibility, and testability, each with its rationale and sources.
This returns a map of the research space, the gaps and contradictions in the literature, and a ranked list of testable hypotheses, each with its rationale and sources. In the example this ran sixth, after the analyses. In a real thesis, run it right after the review, because the hypothesis you adopt becomes the primary outcome of your design. Check that the hypothesis you pick names a measure you can actually collect. Walkthrough: hypotheses.
Stage 3 — Experiment design
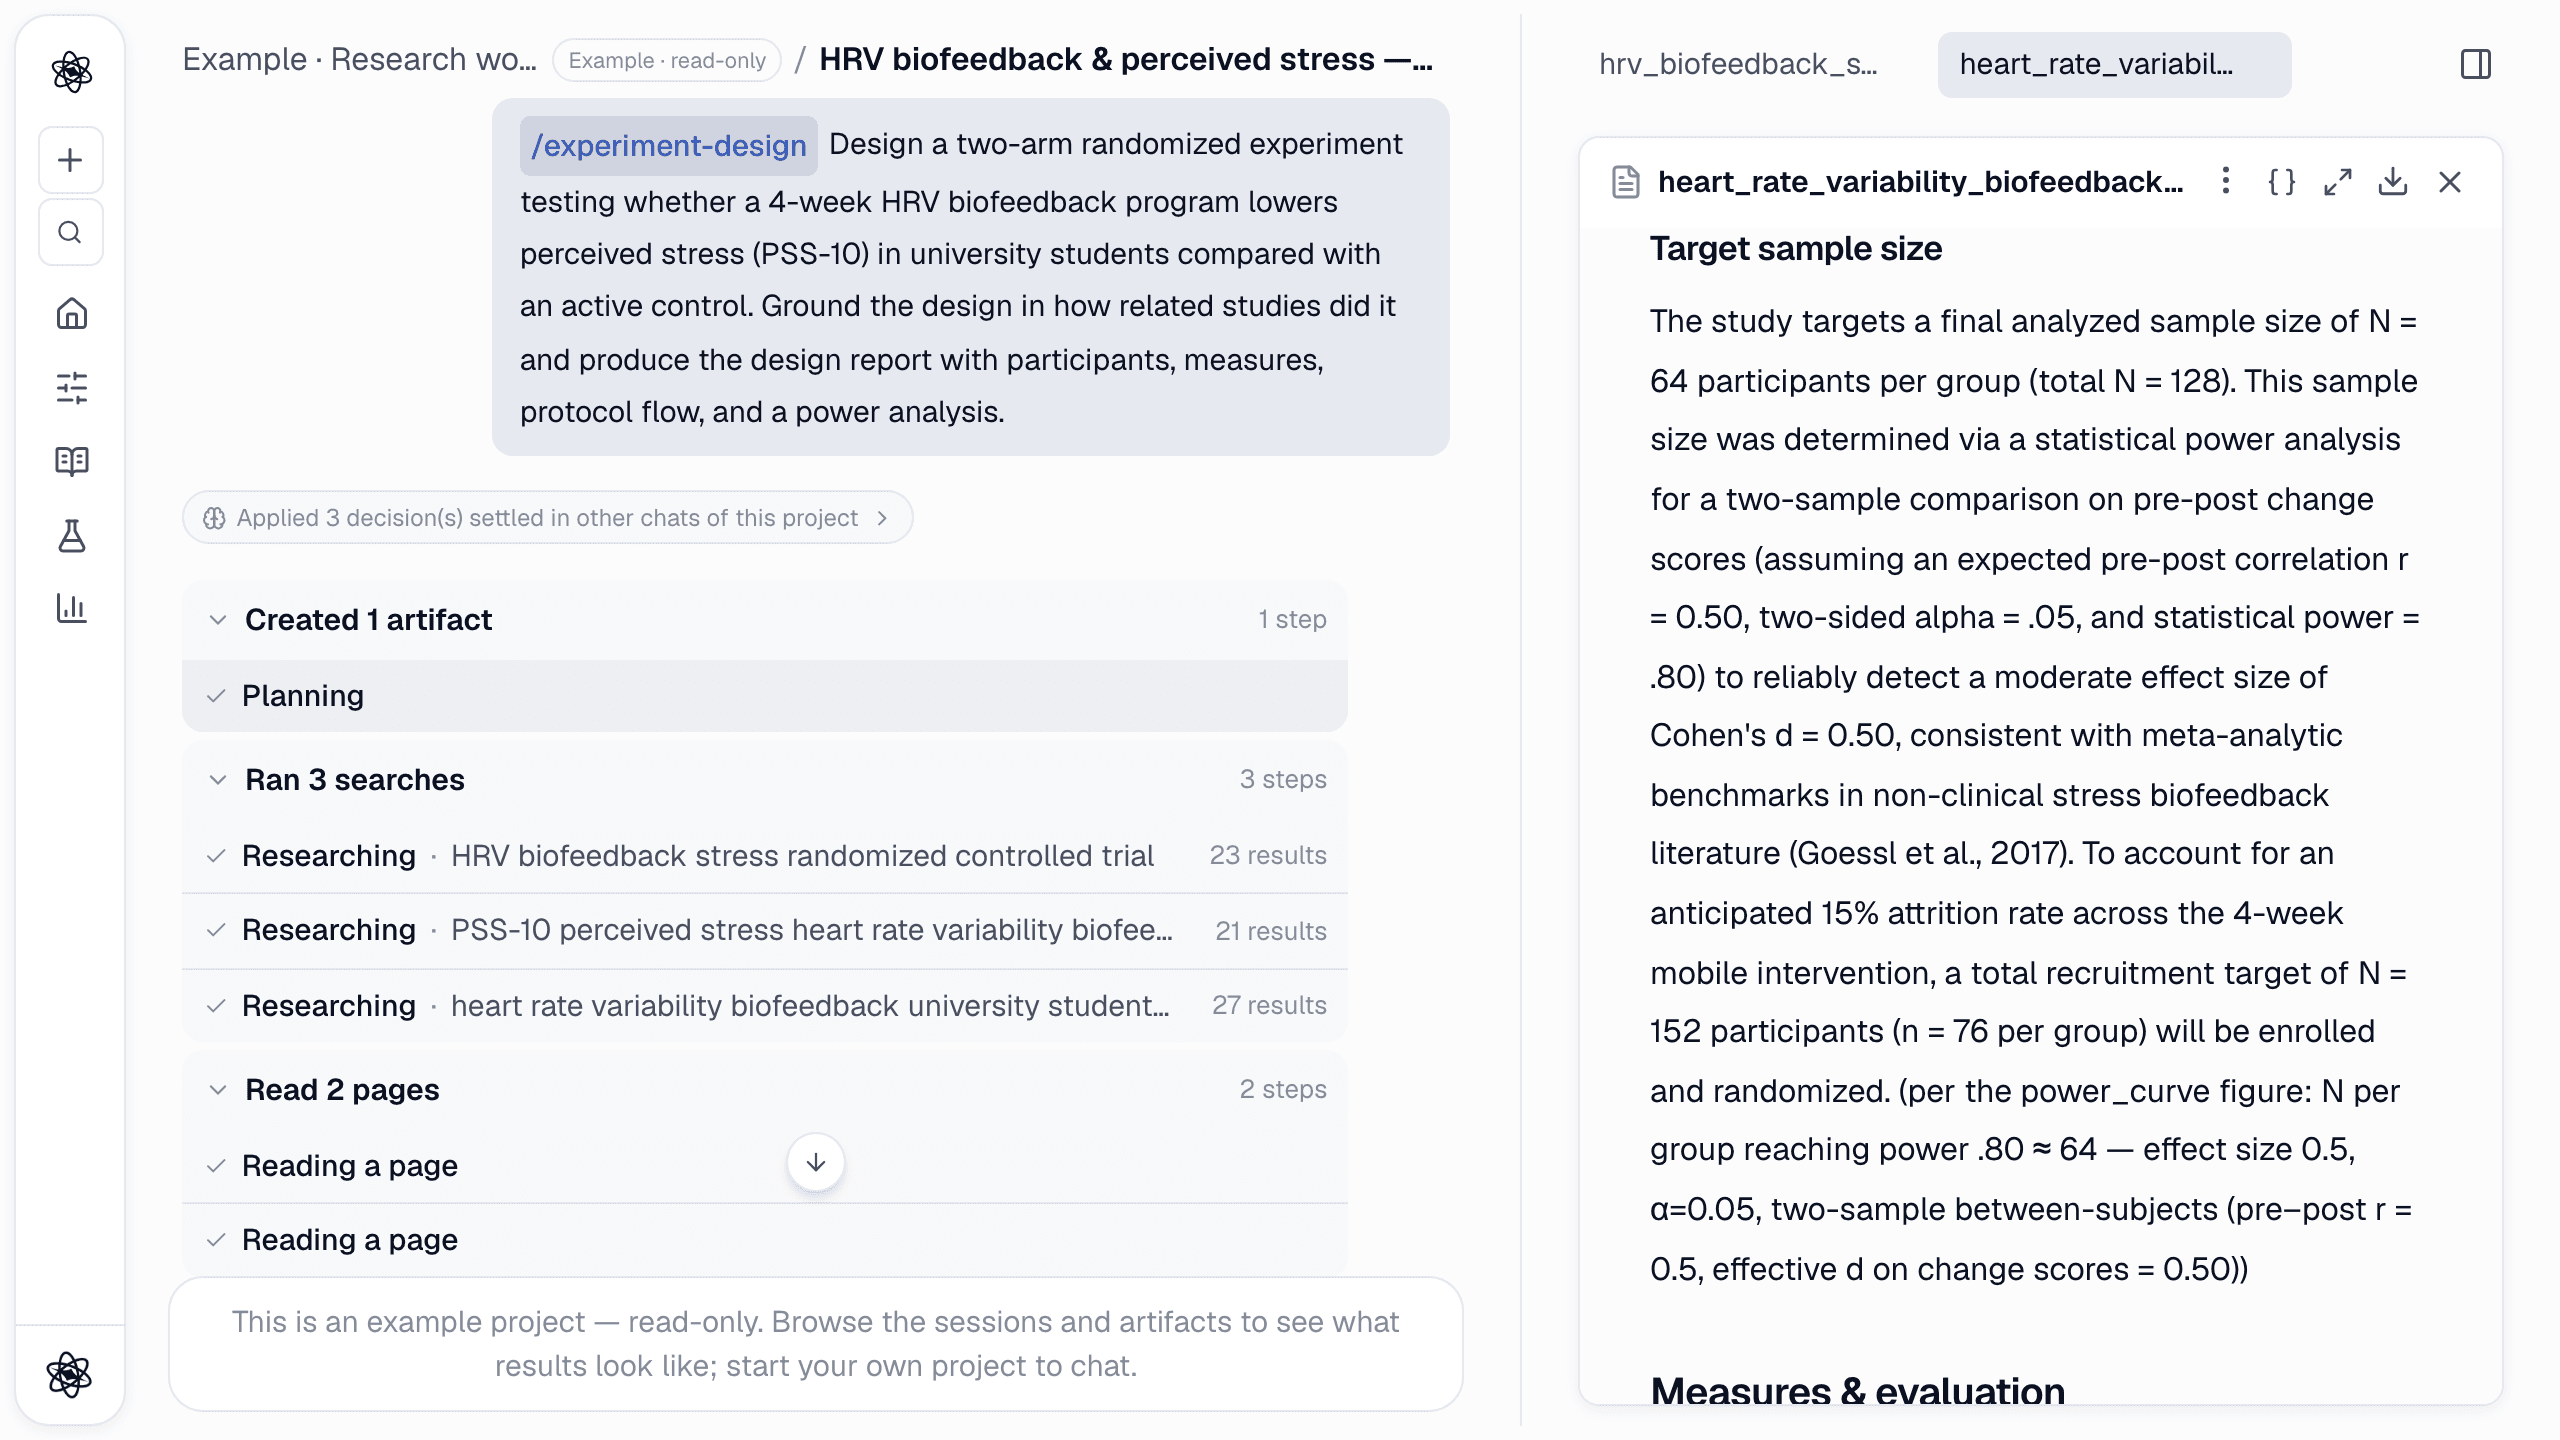
/experiment-design Design a two-arm randomized experiment testing whether a 4-week HRV biofeedback program lowers perceived stress (PSS-10) in university students compared with an active control. Ground the design in how related studies did it and produce the design report with participants, measures, protocol flow, and a power analysis.
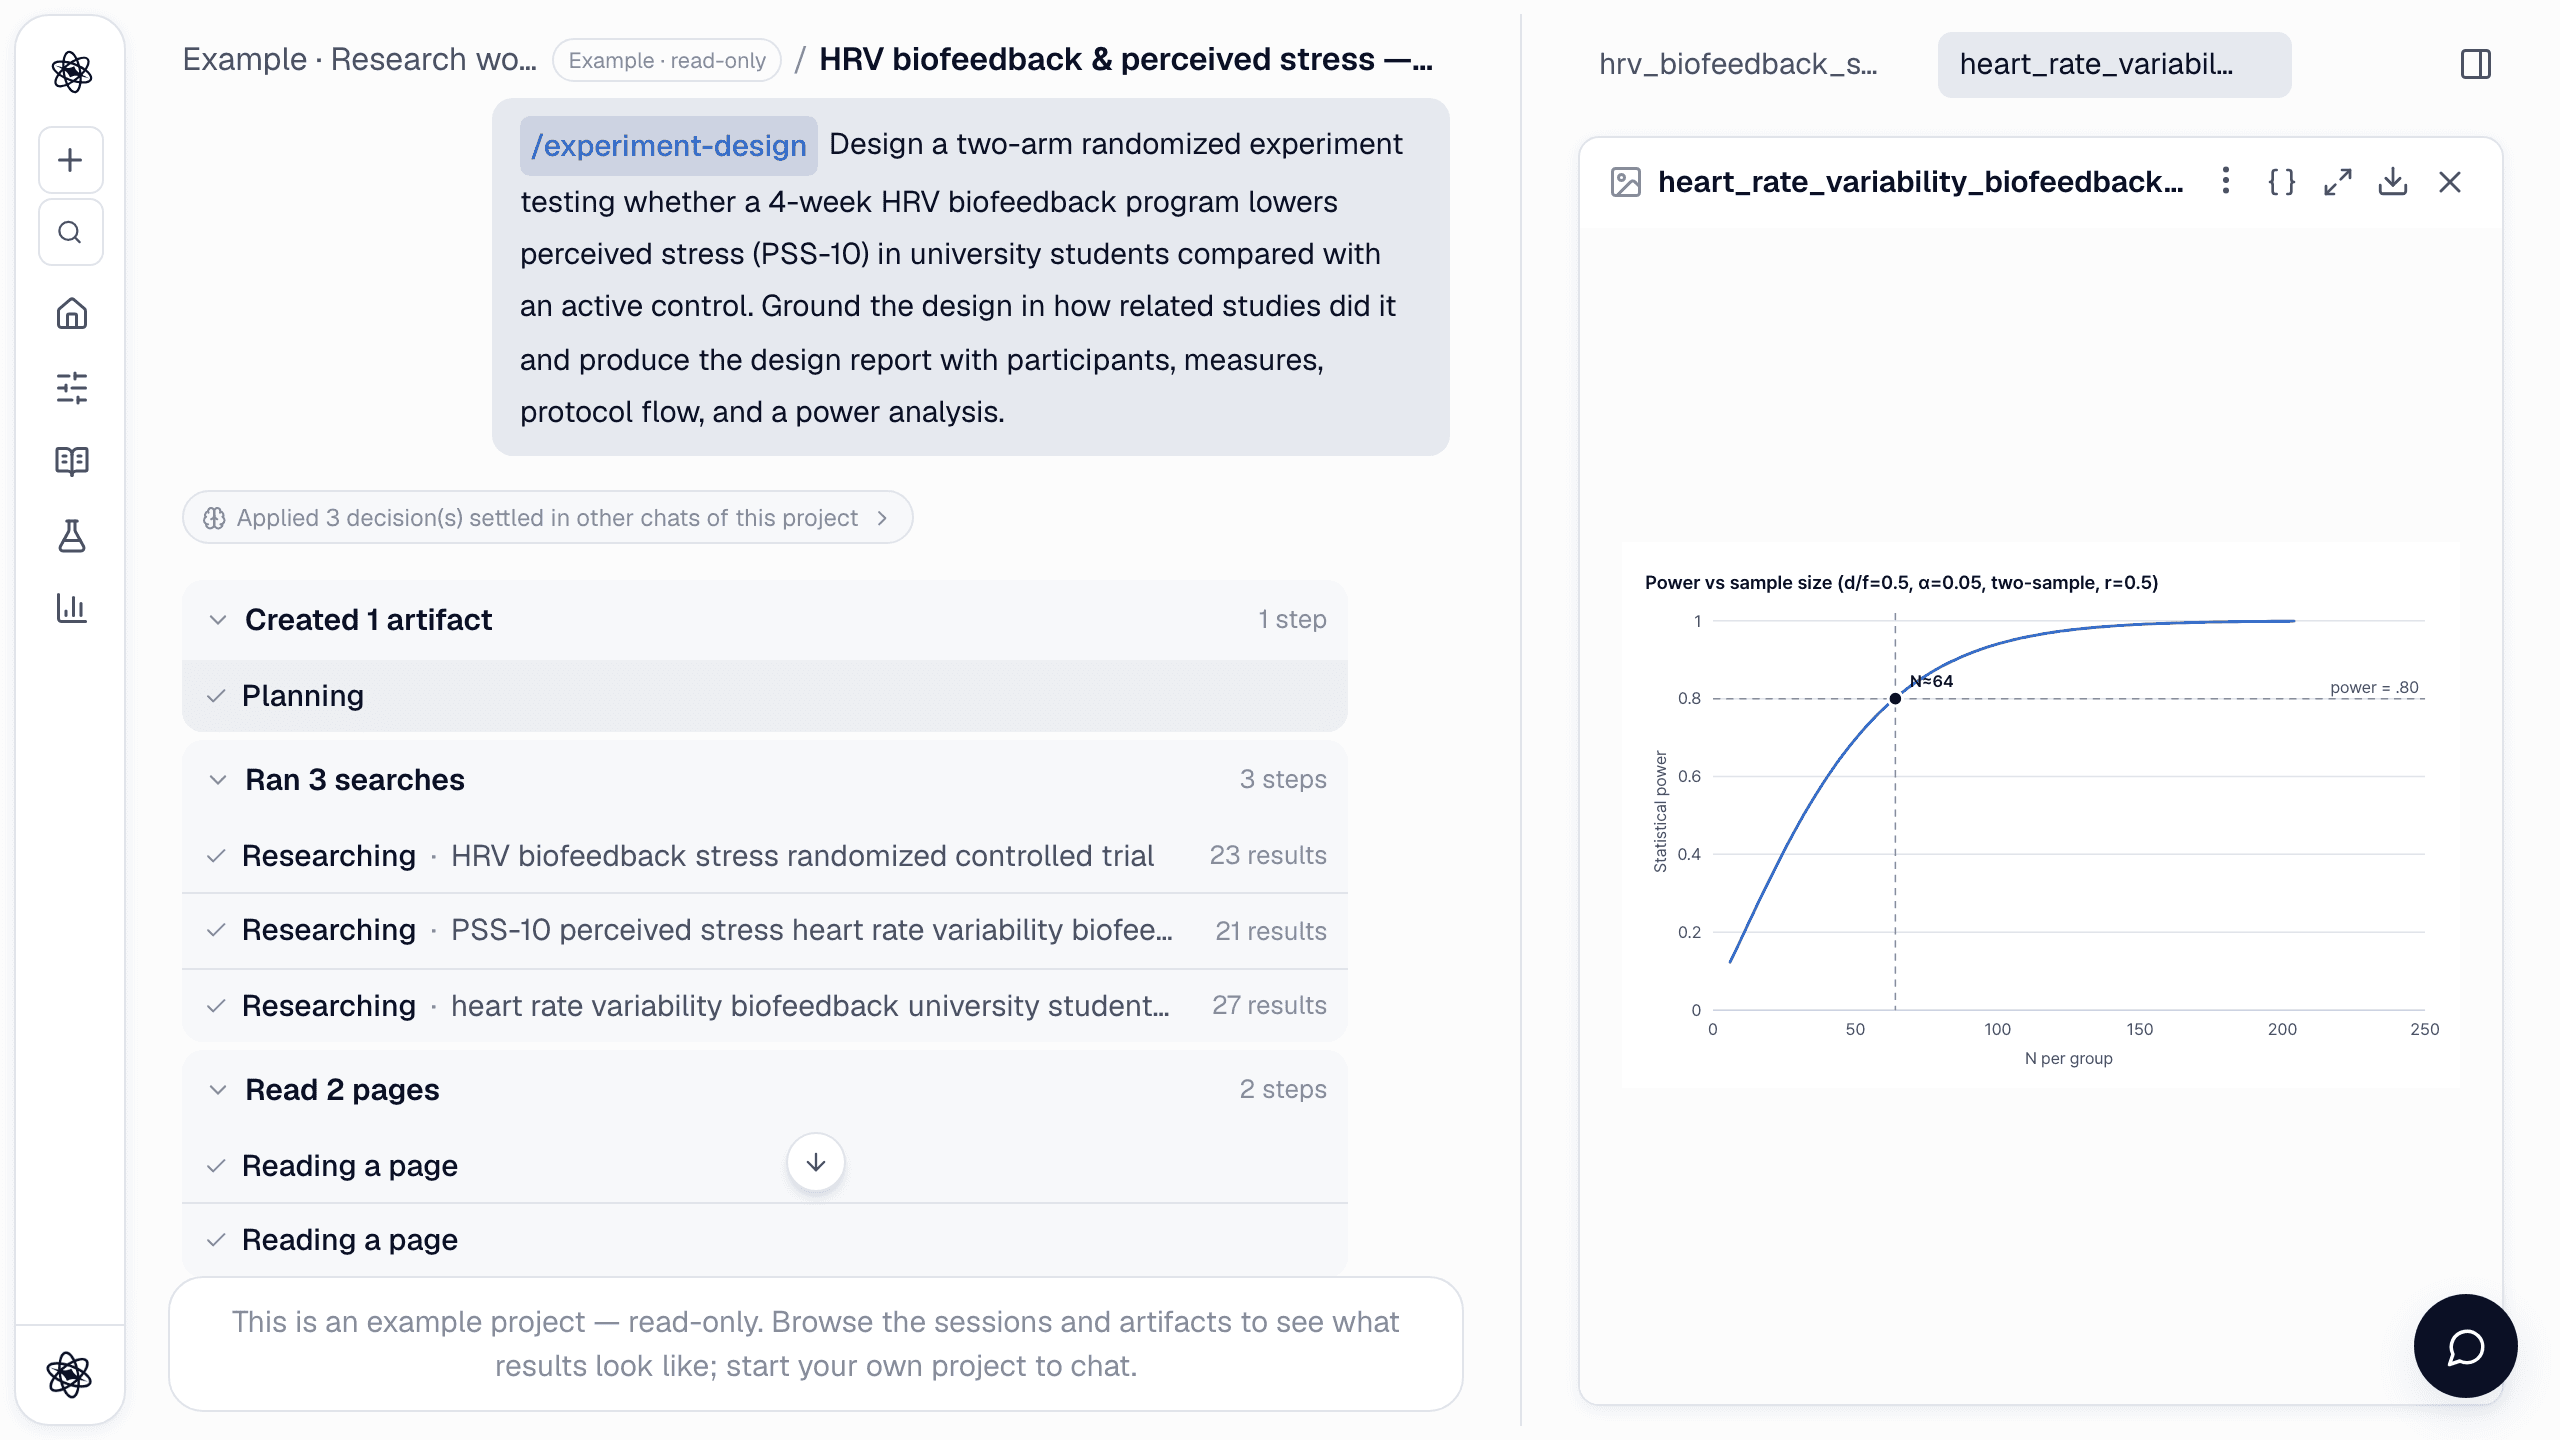
The design report is the most reusable document in the whole project. It contains research questions, hypotheses H1–H3 (each naming its test), a 2 × 2 mixed design with stratified block randomization, both arms specified (15 min/day, 5 days/week of 0.1 Hz resonance breathing with PPG feedback vs. psychoeducation with 14-bpm paced breathing), measures (PSS-10, GAD-7, resting RMSSD and lnHF, adherence), inclusion and exclusion criteria, the sample size, α and the multiplicity correction, confounds with how each is handled, and a rationale for every choice with its source. It comes with a power curve, a protocol-flow diagram, an expected-results chart (labelled as not measured data) and a comparison table of the reference studies' designs.
Walkthrough: experiment design.
From the design to a preregistration and an ethics (IRB) application
Most preregistration templates (OSF, AsPredicted) and ethics forms ask the same core questions, and the design report already answers many of them:
- Hypotheses: H1 is primary, H2 and H3 secondary, each written with the test that will evaluate it.
- Design and randomization: two parallel arms, 1:1 permuted blocks stratified by baseline stress and sex.
- Sample size: a power analysis with its assumptions stated (d = 0.50, α = .05, power = .80, pre–post r = .50), giving 64 per group and a recruitment target of 152 once 15% attrition is allowed for.
- Measures: each instrument named, with what it measures and its score range.
- Eligibility: inclusion and exclusion criteria, with the reason for each exclusion (e.g., medications that alter heart-rate dynamics).
- Analysis plan: the primary model, the significance level and the FDR correction for secondary outcomes.
- Procedure: the protocol-flow diagram from screening to post-test, which you can export for the application.
What the design report does not contain is everything specific to your institution: the consent form and participant information sheet, risk and benefit assessment, data management and storage, compensation, recruitment materials, and the rules for handling missing data and dropouts. You write those yourself. You can still ask a follow-up in the same chat, e.g. Draft a plain-language participant information sheet from @experiment_design.md, as long as you treat the result as a draft for your ethics office's template.
Before you submit, check three things. First, make sure the power analysis and the analysis plan describe the same test. In the example, the power analysis assumes a two-sample test on change scores while H1 is tested with an ANCOVA. That's defensible, but a reviewer will ask about it. Second, look at the rationale items marked No source, which rest on convention rather than evidence. In the example these were the PSS-10 ≥ 14 cutoff and the 4-point minimal important difference. Third, check any blinding claim. People in a biofeedback trial can usually tell which arm they are in.
Stage 4 — Data analysis
Upload the data (the + button in the composer; CSV, XLSX, SPSS .sav and more, up to 1 GB), then:
/analyze Inspect the uploaded pss_trial.xlsx (two groups, PSS-10 pre/post). Check data quality and baseline balance, compute change scores, and deliver a reproducible analysis report with plots.
You get missing-value and duplicate checks, baseline balance (age and baseline PSS-10 tests), normality checks, change scores and plots. The code that produced them sits behind the Reproducibility button. The example file is a demo dataset of 80 participants (40 per group), smaller than the 128 the design calls for. With your own data, check that the N in the report matches your enrolment log and that exclusions happened where your preregistration says they would. Walkthrough: data analysis.
Stage 5 — Statistics
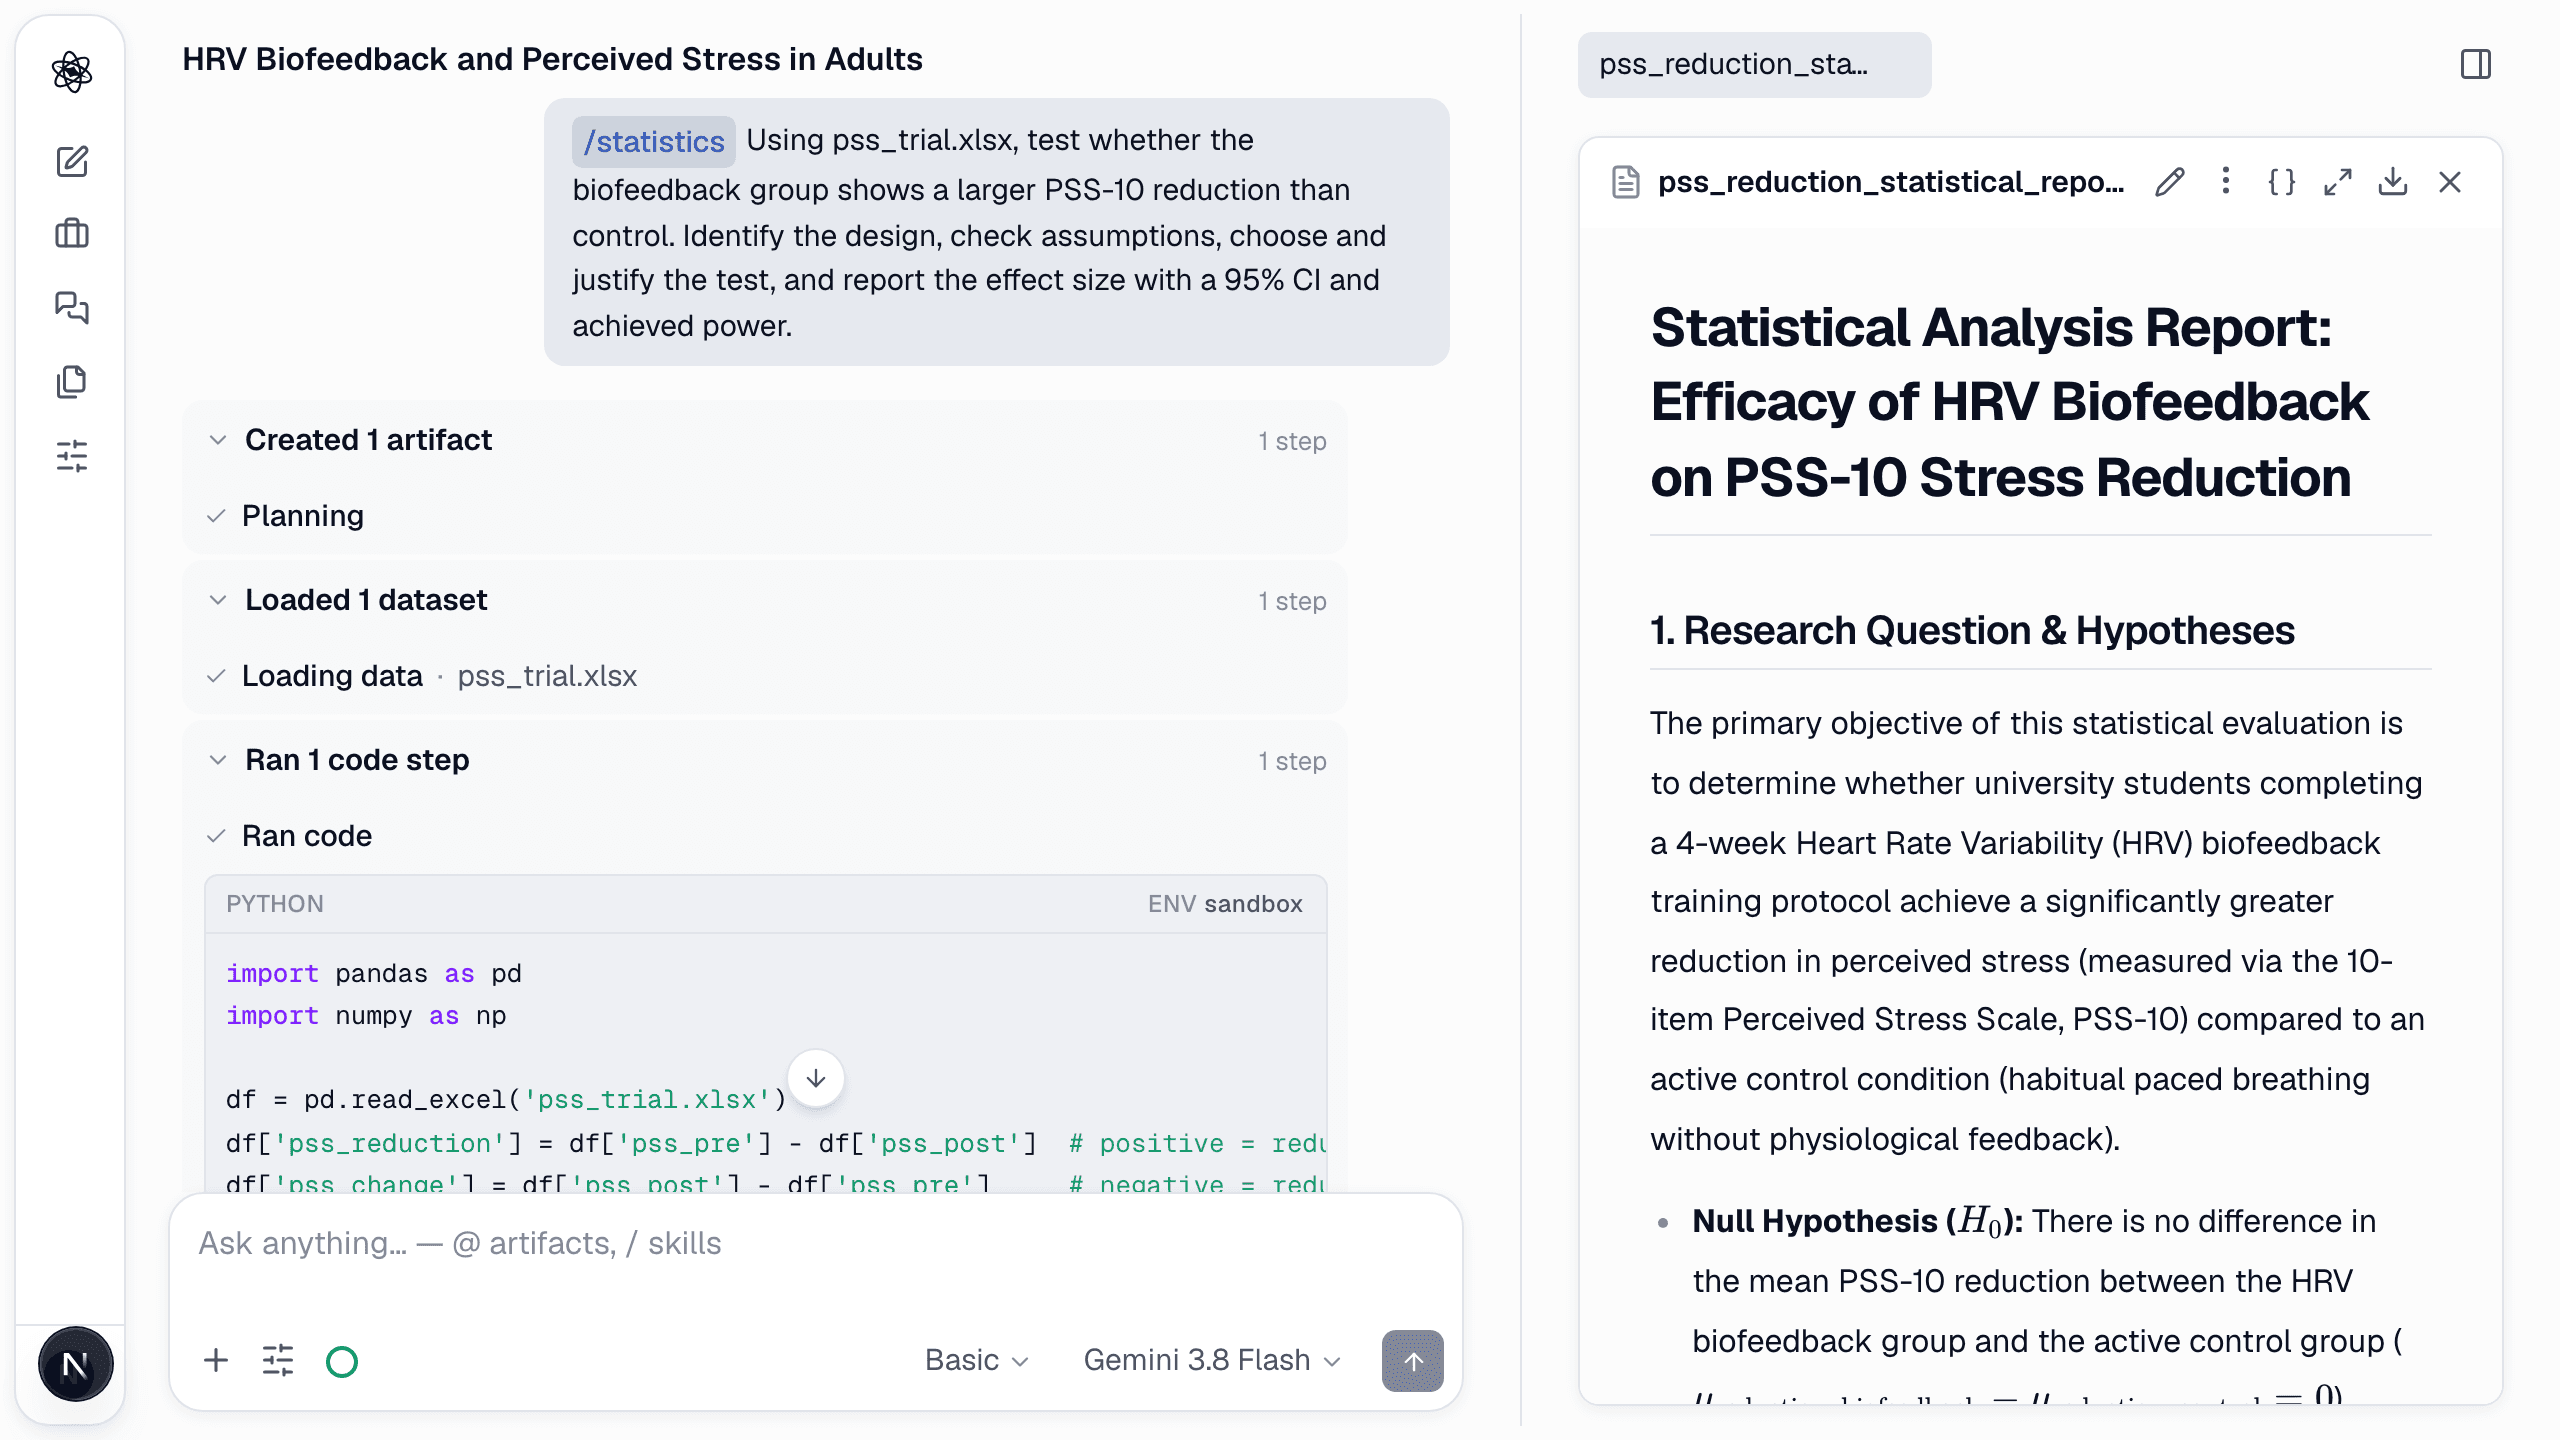
/stats Using pss_trial.xlsx, test whether the biofeedback group shows a larger PSS-10 reduction than control. Identify the design, check assumptions, choose and justify the test, and report the effect size with a 95% CI and achieved power.
The report walks from the design through the assumption checks (normality not rejected, Levene p = .057) to an independent-samples t-test, with Welch and Mann–Whitney as sensitivity checks. The result on the demo data was t(78) = 5.51, p < .001, a mean difference of 3.67 points [95% CI 2.34, 4.99] and d = 1.23 [0.75, 1.71].
Before your advisor sees it: "achieved power" computed from the observed effect adds nothing the p-value hasn't already told you. The sensitivity analysis (the smallest effect detectable with your N) is the number worth reporting. Also make sure the test you report is the one you preregistered. Walkthrough: statistics.
Stage 6 — Figures and illustrations
/figure Draw an editable vector study flow diagram for the experiment designed in this session: recruitment → screening → randomization → HRV biofeedback (4 weeks) vs active control → post-test (PSS-10) → 3-month follow-up. Use a journal template.
/illustrate Draw a scientific illustration of the HRV biofeedback setup for a methods figure: a seated participant wearing a chest-strap ECG sensor and a fingertip PPG sensor, breathing along with a pacing display on a laptop. Semi-flat style, white background.
The flow diagram is a real vector figure. Edit in workspace lets you move boxes and fix labels, and it exports to SVG, PNG, PDF or PPTX. Check that each figure matches the design. This prompt asks for a 3-month follow-up, but the English design report only has baseline and post-test. That kind of mismatch is easy to miss and easy for an examiner to spot. Proofread the text inside generated illustrations as well, since labels in the artwork can come out misspelled. Walkthrough: figures.
Stage 7 — Writing the chapter
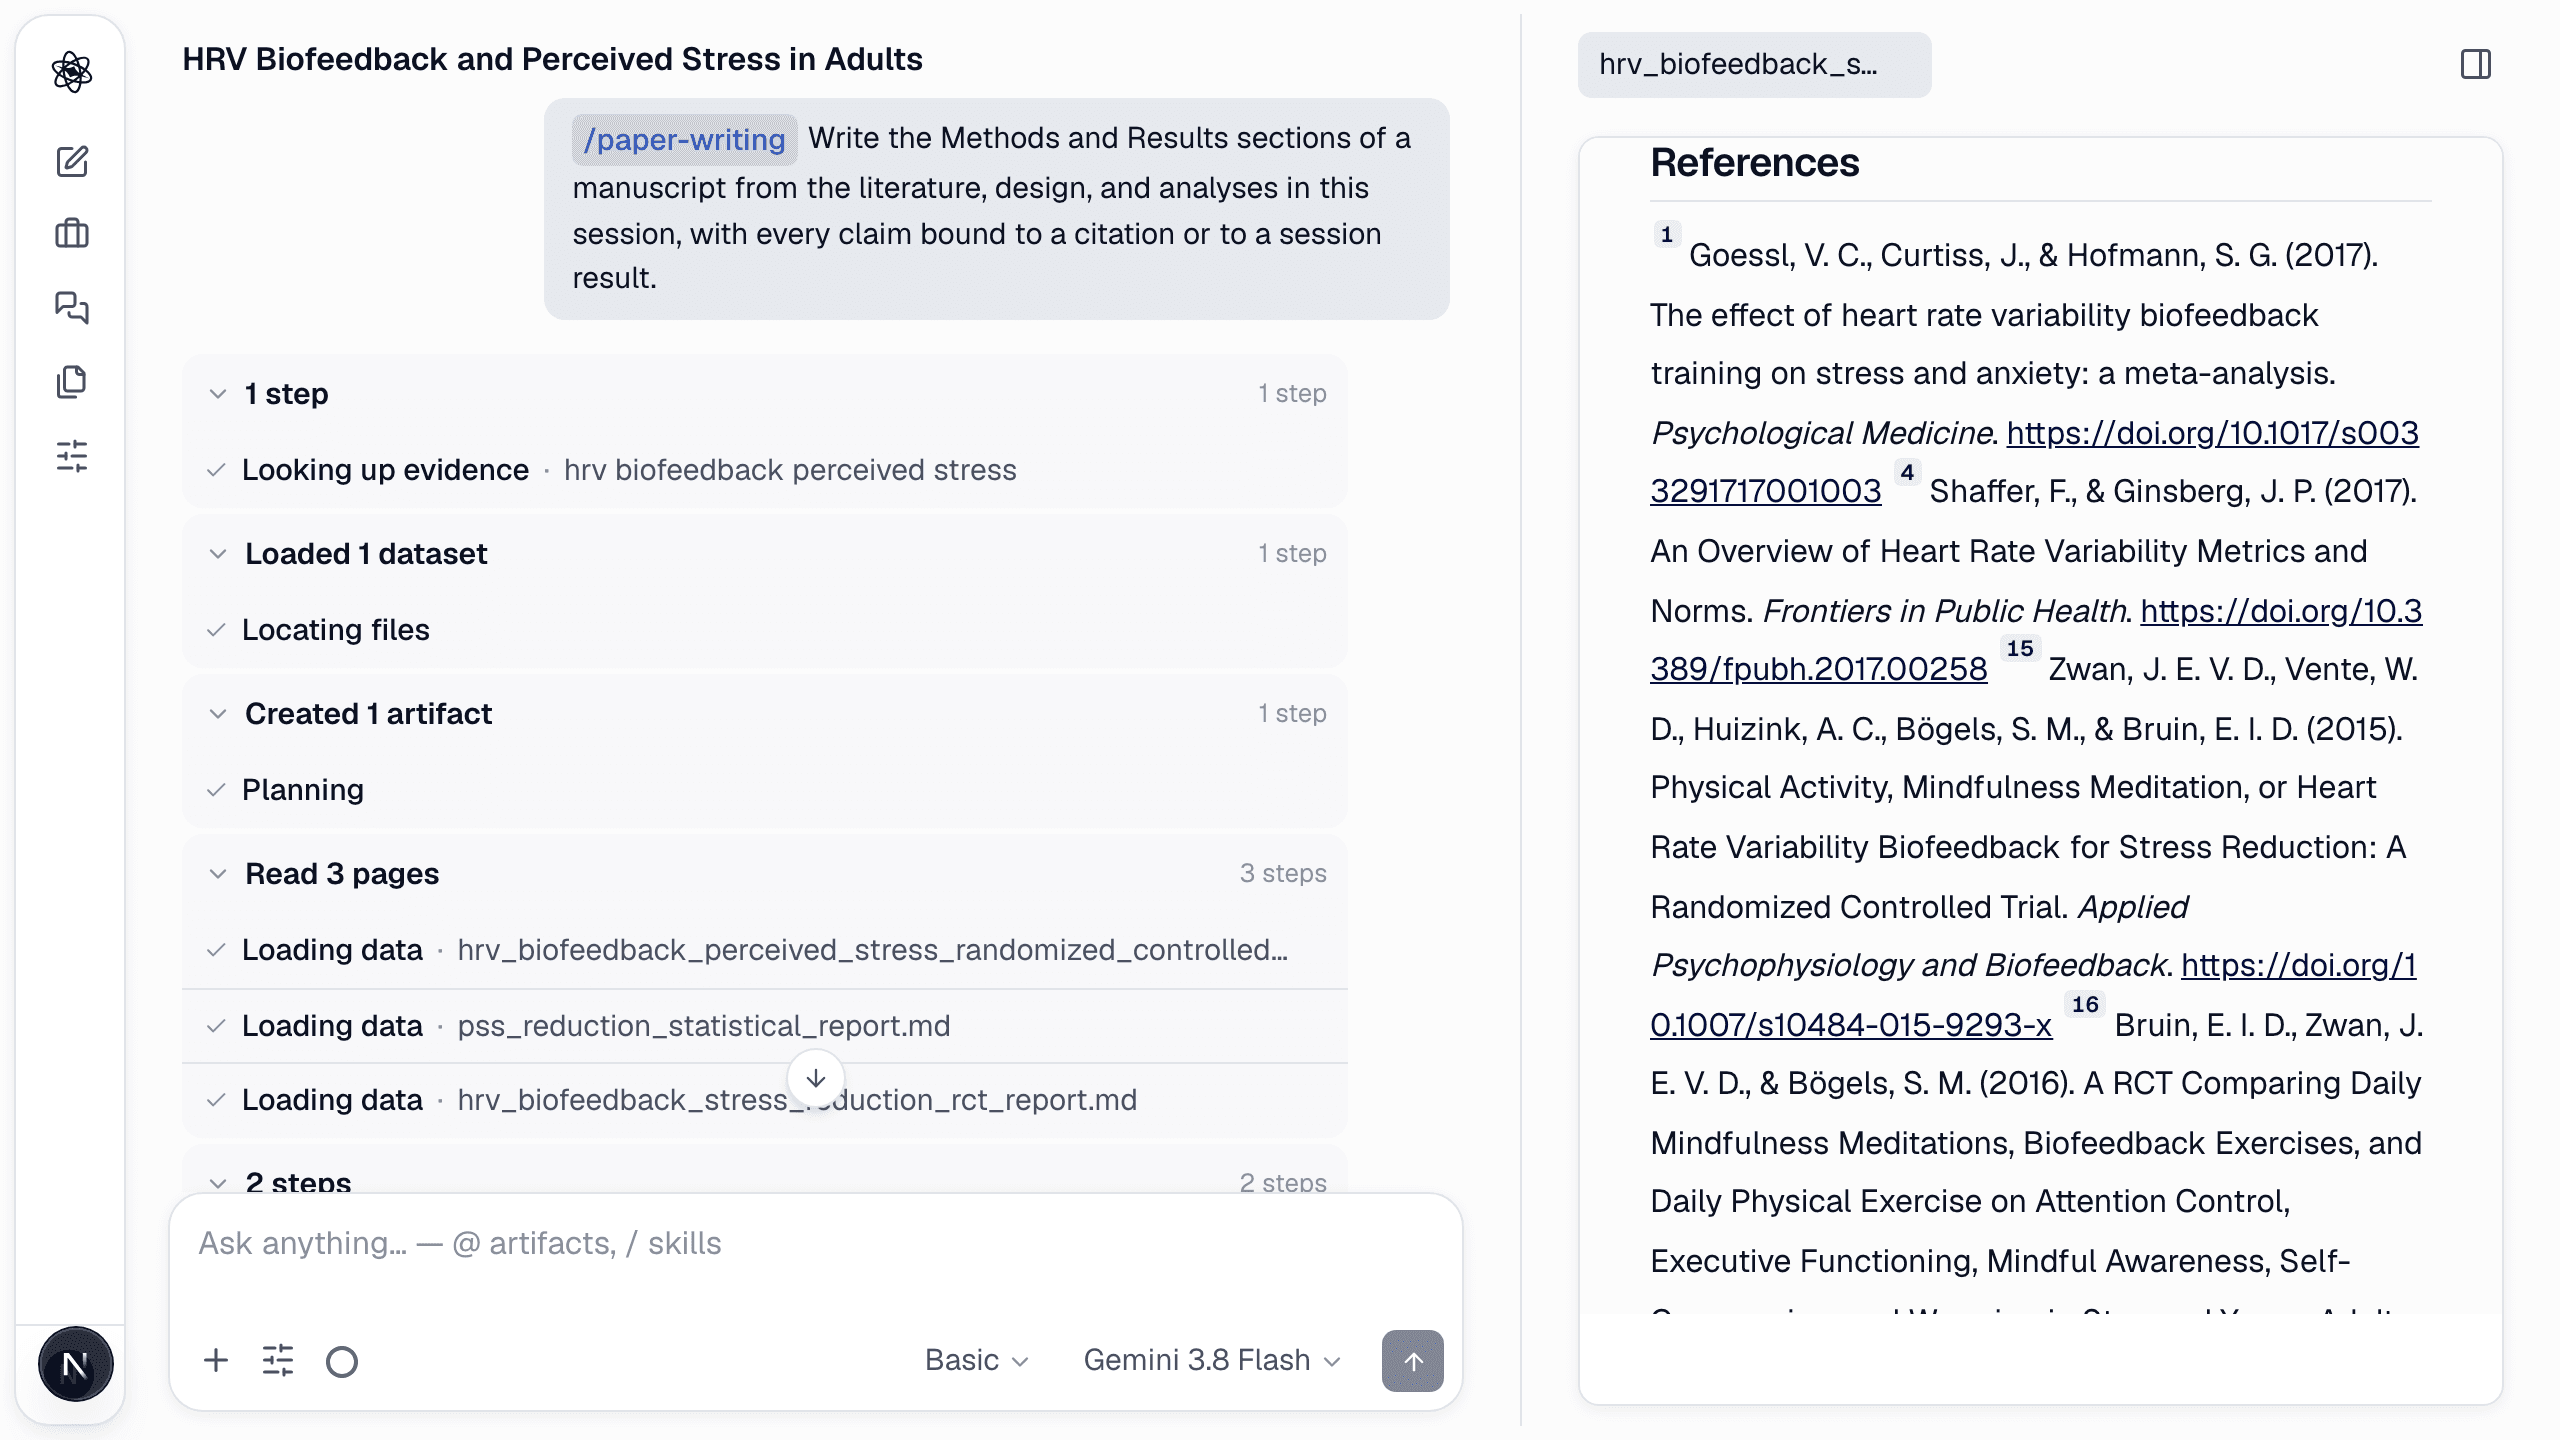
/write Write the Methods and Results sections of a manuscript from the literature, design, and analyses in this session, with every claim bound to a citation or to a session result.
The manuscript is written from the session's artifacts, not from the model's memory. Numbers in Results come from the statistics report, citations come from the screened literature, and figures sit where the text first discusses them. It ends with a numbered reference list.
Before your advisor sees it: check every number against the statistics report and every [n] against its paper. Then rewrite the prose in your own voice. That is the chapter your committee will read. Export from the panel's download button as DOCX, LaTeX, PDF or Markdown. Walkthrough: writing.
Stage 8 — Report review
/report-review Independently review the manuscript written in this session — claims, methods, statistics, cited evidence, and reproducibility — and write a prioritized review report.
Report review works as a second reader. It re-derives the statistics from the data, checks each claim against its source and ranks the problems by priority. In the example it re-ran the analysis on the 80 participants and confirmed the reported numbers. It also flagged a truncated passage in the draft and asked the authors to separate the effect of slow paced breathing from the effect of the feedback itself. Fix those issues before anyone else reads the draft. Walkthrough: report review.
Stage 9 — Peer review
/peer-review Run a peer review of the manuscript written in this session for the journal Applied Psychophysiology and Biofeedback: journal profile and submission rules, comparable papers, five reviewers with scores, the editorial decision, a revision guide and recommended journals.
Peer review simulates the journal: a profile of the target journal with its submission rules, comparable papers it has published, five reviewers with scores, an editor's decision (Minor Revision for the English manuscript), a revision guide and a list of alternative journals.
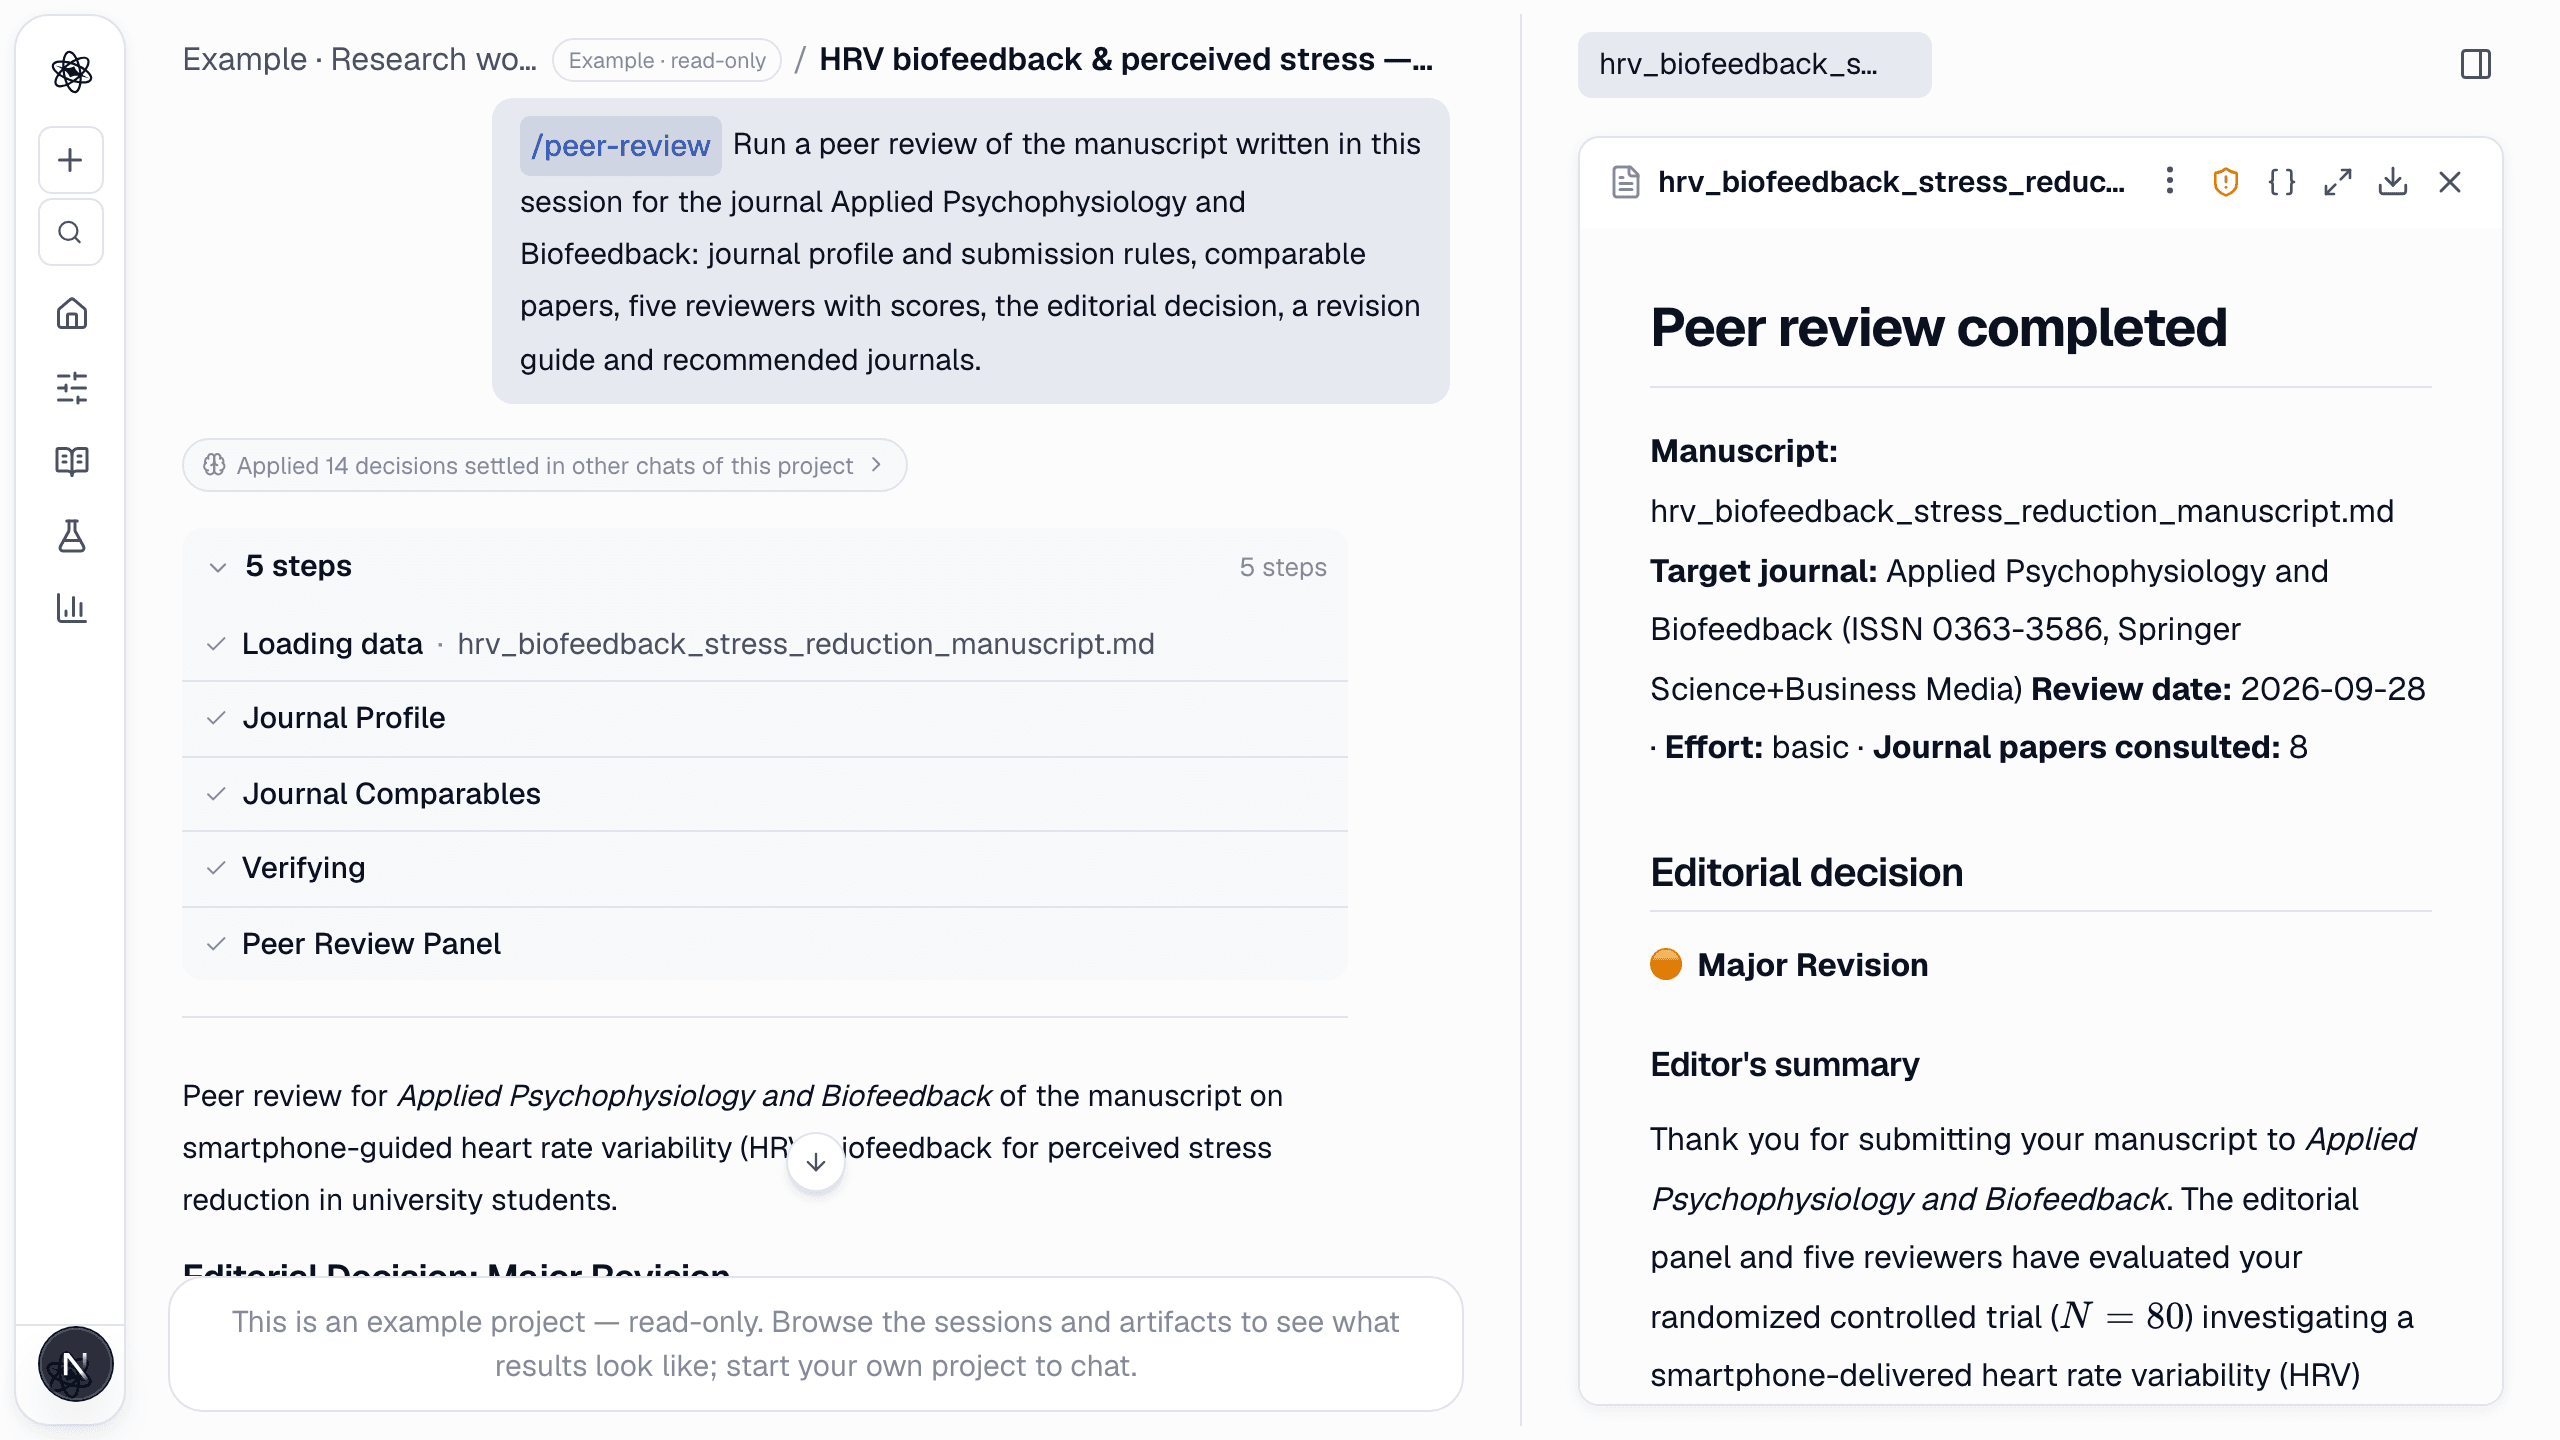
Use it to rehearse the review, not to predict the outcome. The revision guide doubles as a to-do list before the draft goes to your committee. Walkthrough: peer review.
Practical tips
- One project per study. A thesis with three studies gets three projects. Artifacts and memory stay apart, and each chapter's sources stay traceable.
- @-mention instead of re-explaining. Type
@in the composer to pick an earlier artifact:Rewrite the Methods to match @experiment_design.md. - Say what you've decided. Memory keeps what was actually settled in a chat. Stating a decision explicitly ("we'll use the PSS-10 cutoff of 14") is the most reliable way to have later chats follow it.
- Upload the real thing. Your data, your advisor's marked-up PDF, the journal's author guidelines. The agent can only use what it can read.
- Mind the tokens. The ten turns in the example used about 1.6 to 2 million managed tokens on Basic effort with Gemini 3.8 Flash. The Free plan includes about 3 million a month with a daily cap of about 750K, so on Free spread a workflow like this over several days. Paid plans raise both limits and add premium models. See Plans & tokens.
Neutropic drafts and checks. You are the author.
Your university's rules on AI assistance come first. Read them, and tell your advisor how you used the tool. Neutropic helps by making every step inspectable. Citations point to sources that were actually retrieved, and statistics come with the code that produced them. Report review re-checks the numbers. That lets you verify the work, but the judgement stays with you. The ideas, the decisions and the final text are yours, and so is the responsibility for them. Cite only papers you have read, and never submit a paragraph you couldn't defend in your viva.
Open Example · Research workflow from My Library to read all ten turns, then start your own project and run the first stage on your own question.