다이어그램 — /figure
text
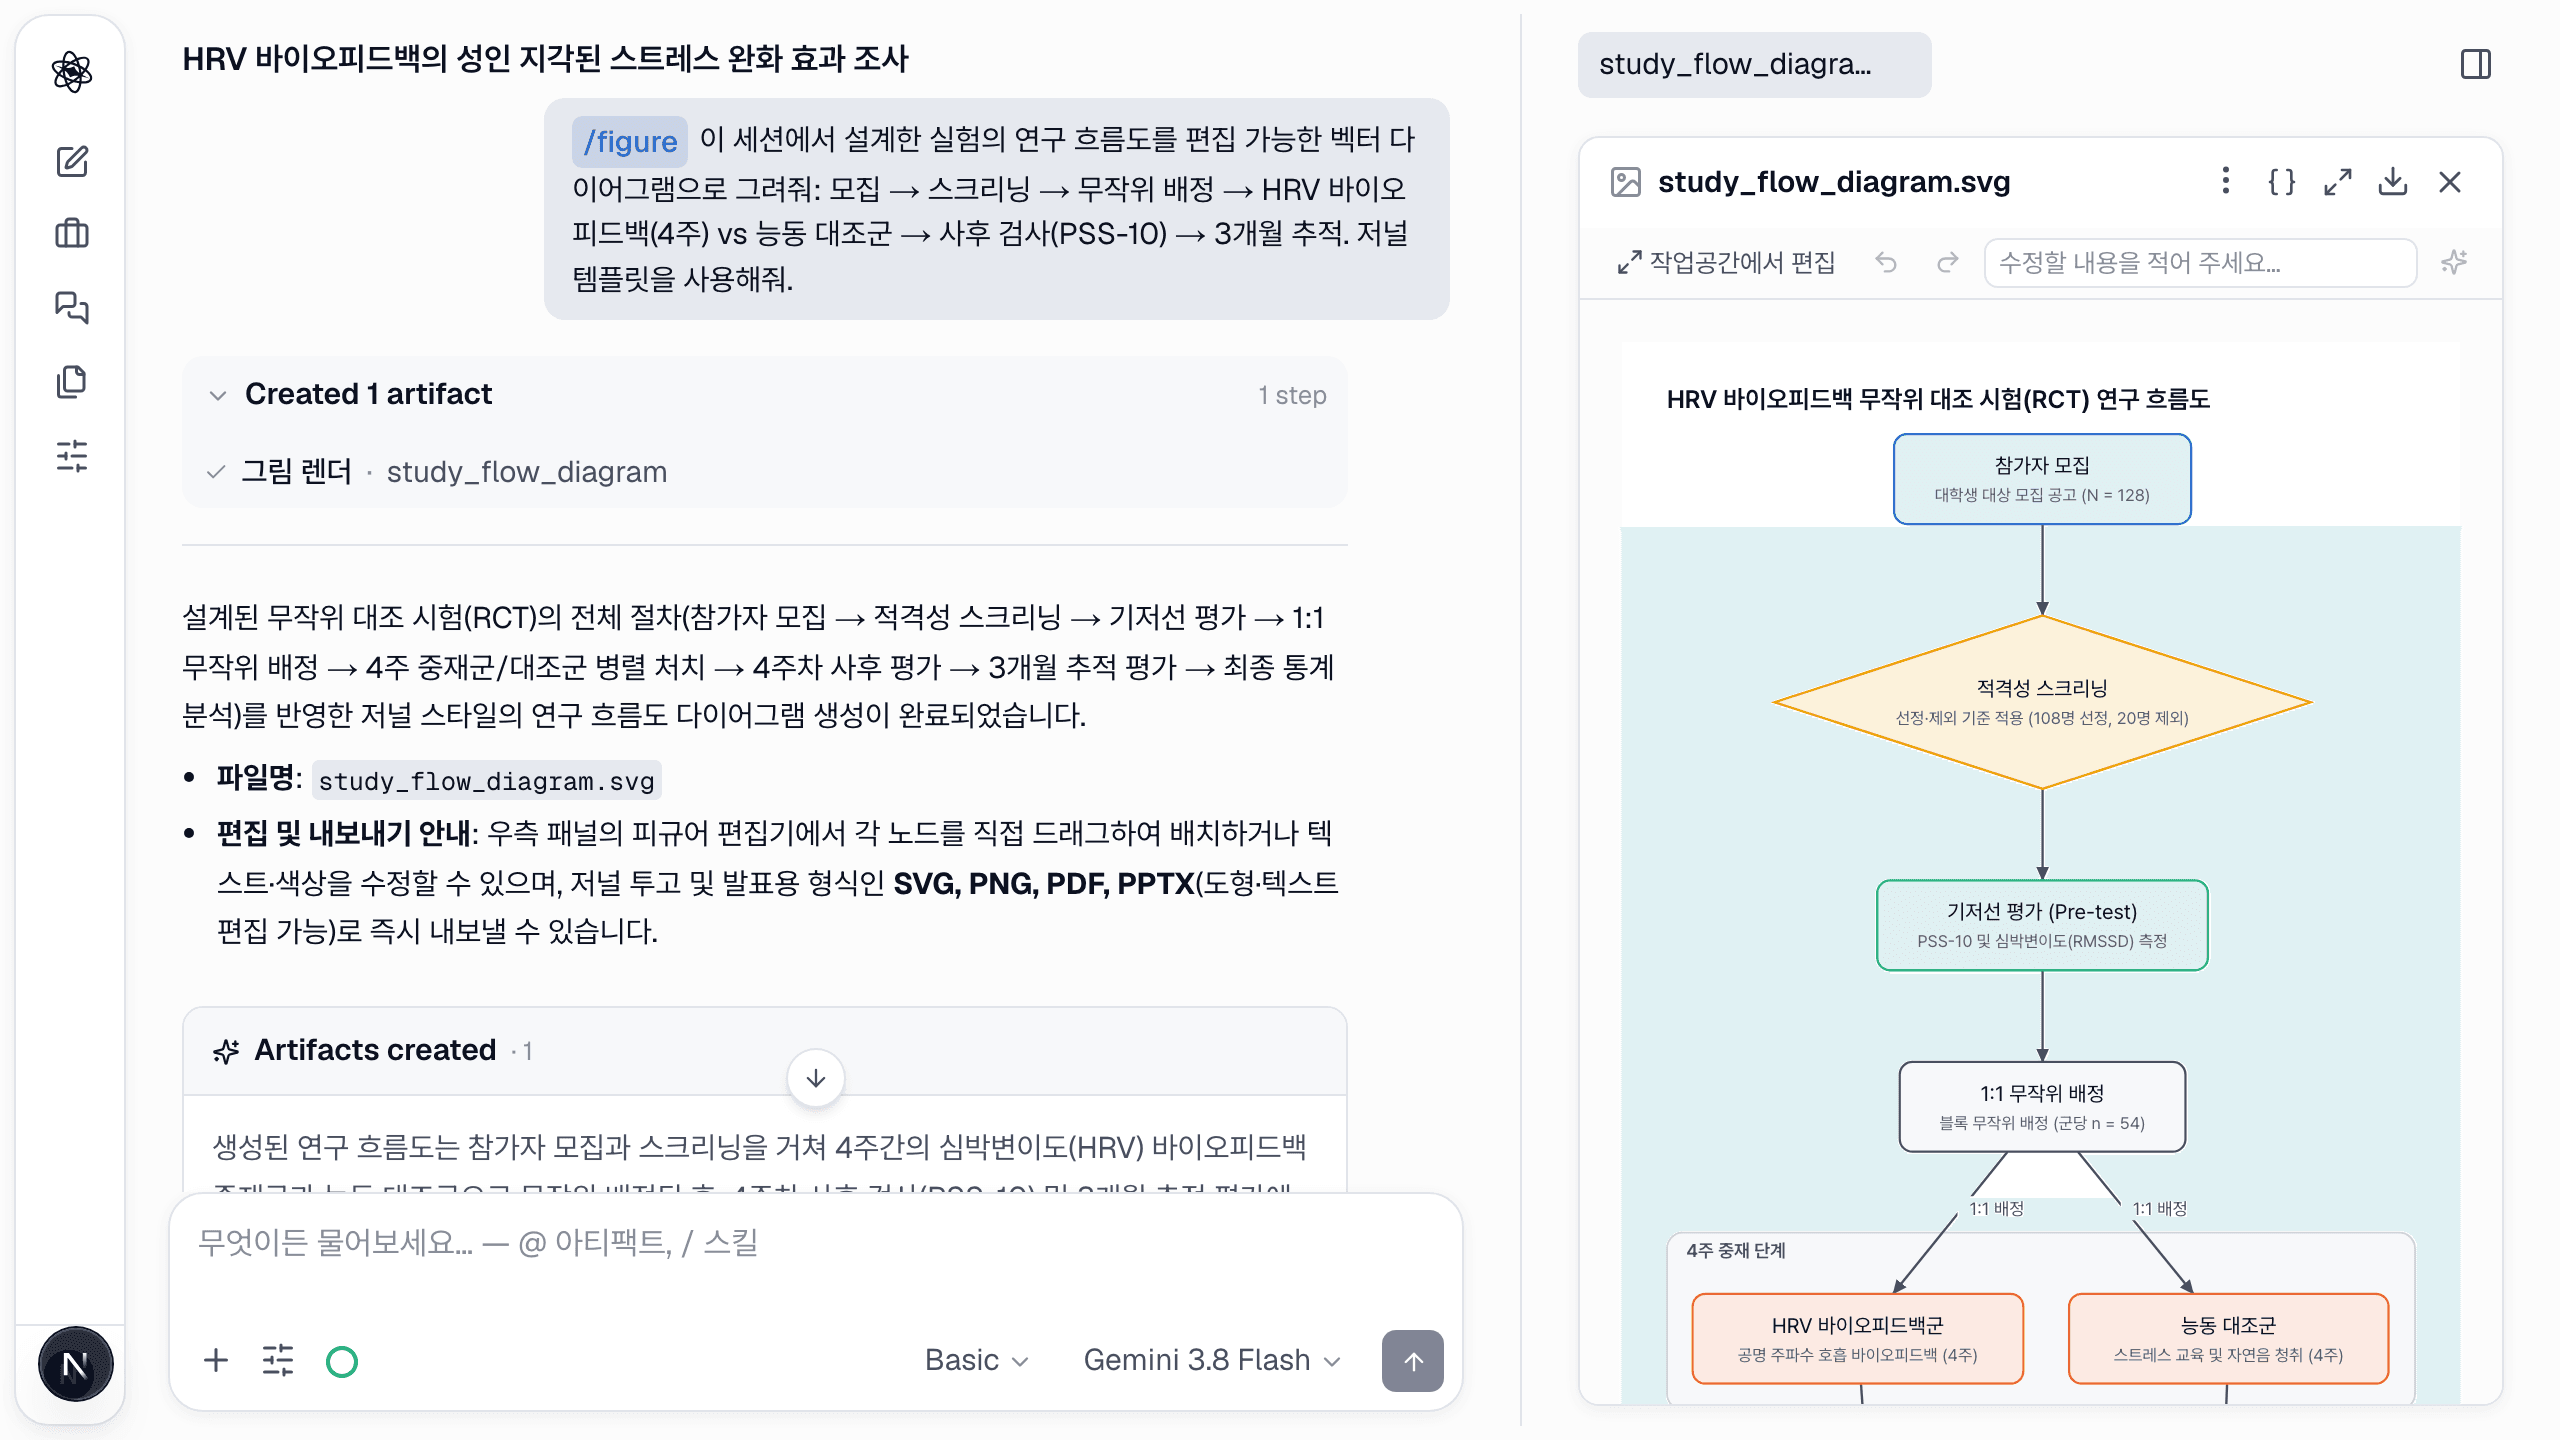
/figure Draw the research flow of the experiment designed in this session as an editable vector diagram: recruitment → screening → randomization → HRV biofeedback (4 weeks) vs active control → post-test (PSS-10) → 3-month follow-up. Use the journal template.
figure 스킬은 저널 스타일 템플릿으로 다이어그램(흐름도, 프레임워크, 프로토콜 흐름, 타임라인)을 배치하고 SVG로 저장합니다. 텍스트는 텍스트로 남아 검색·편집이 가능합니다.
일러스트 — /illustrate
text
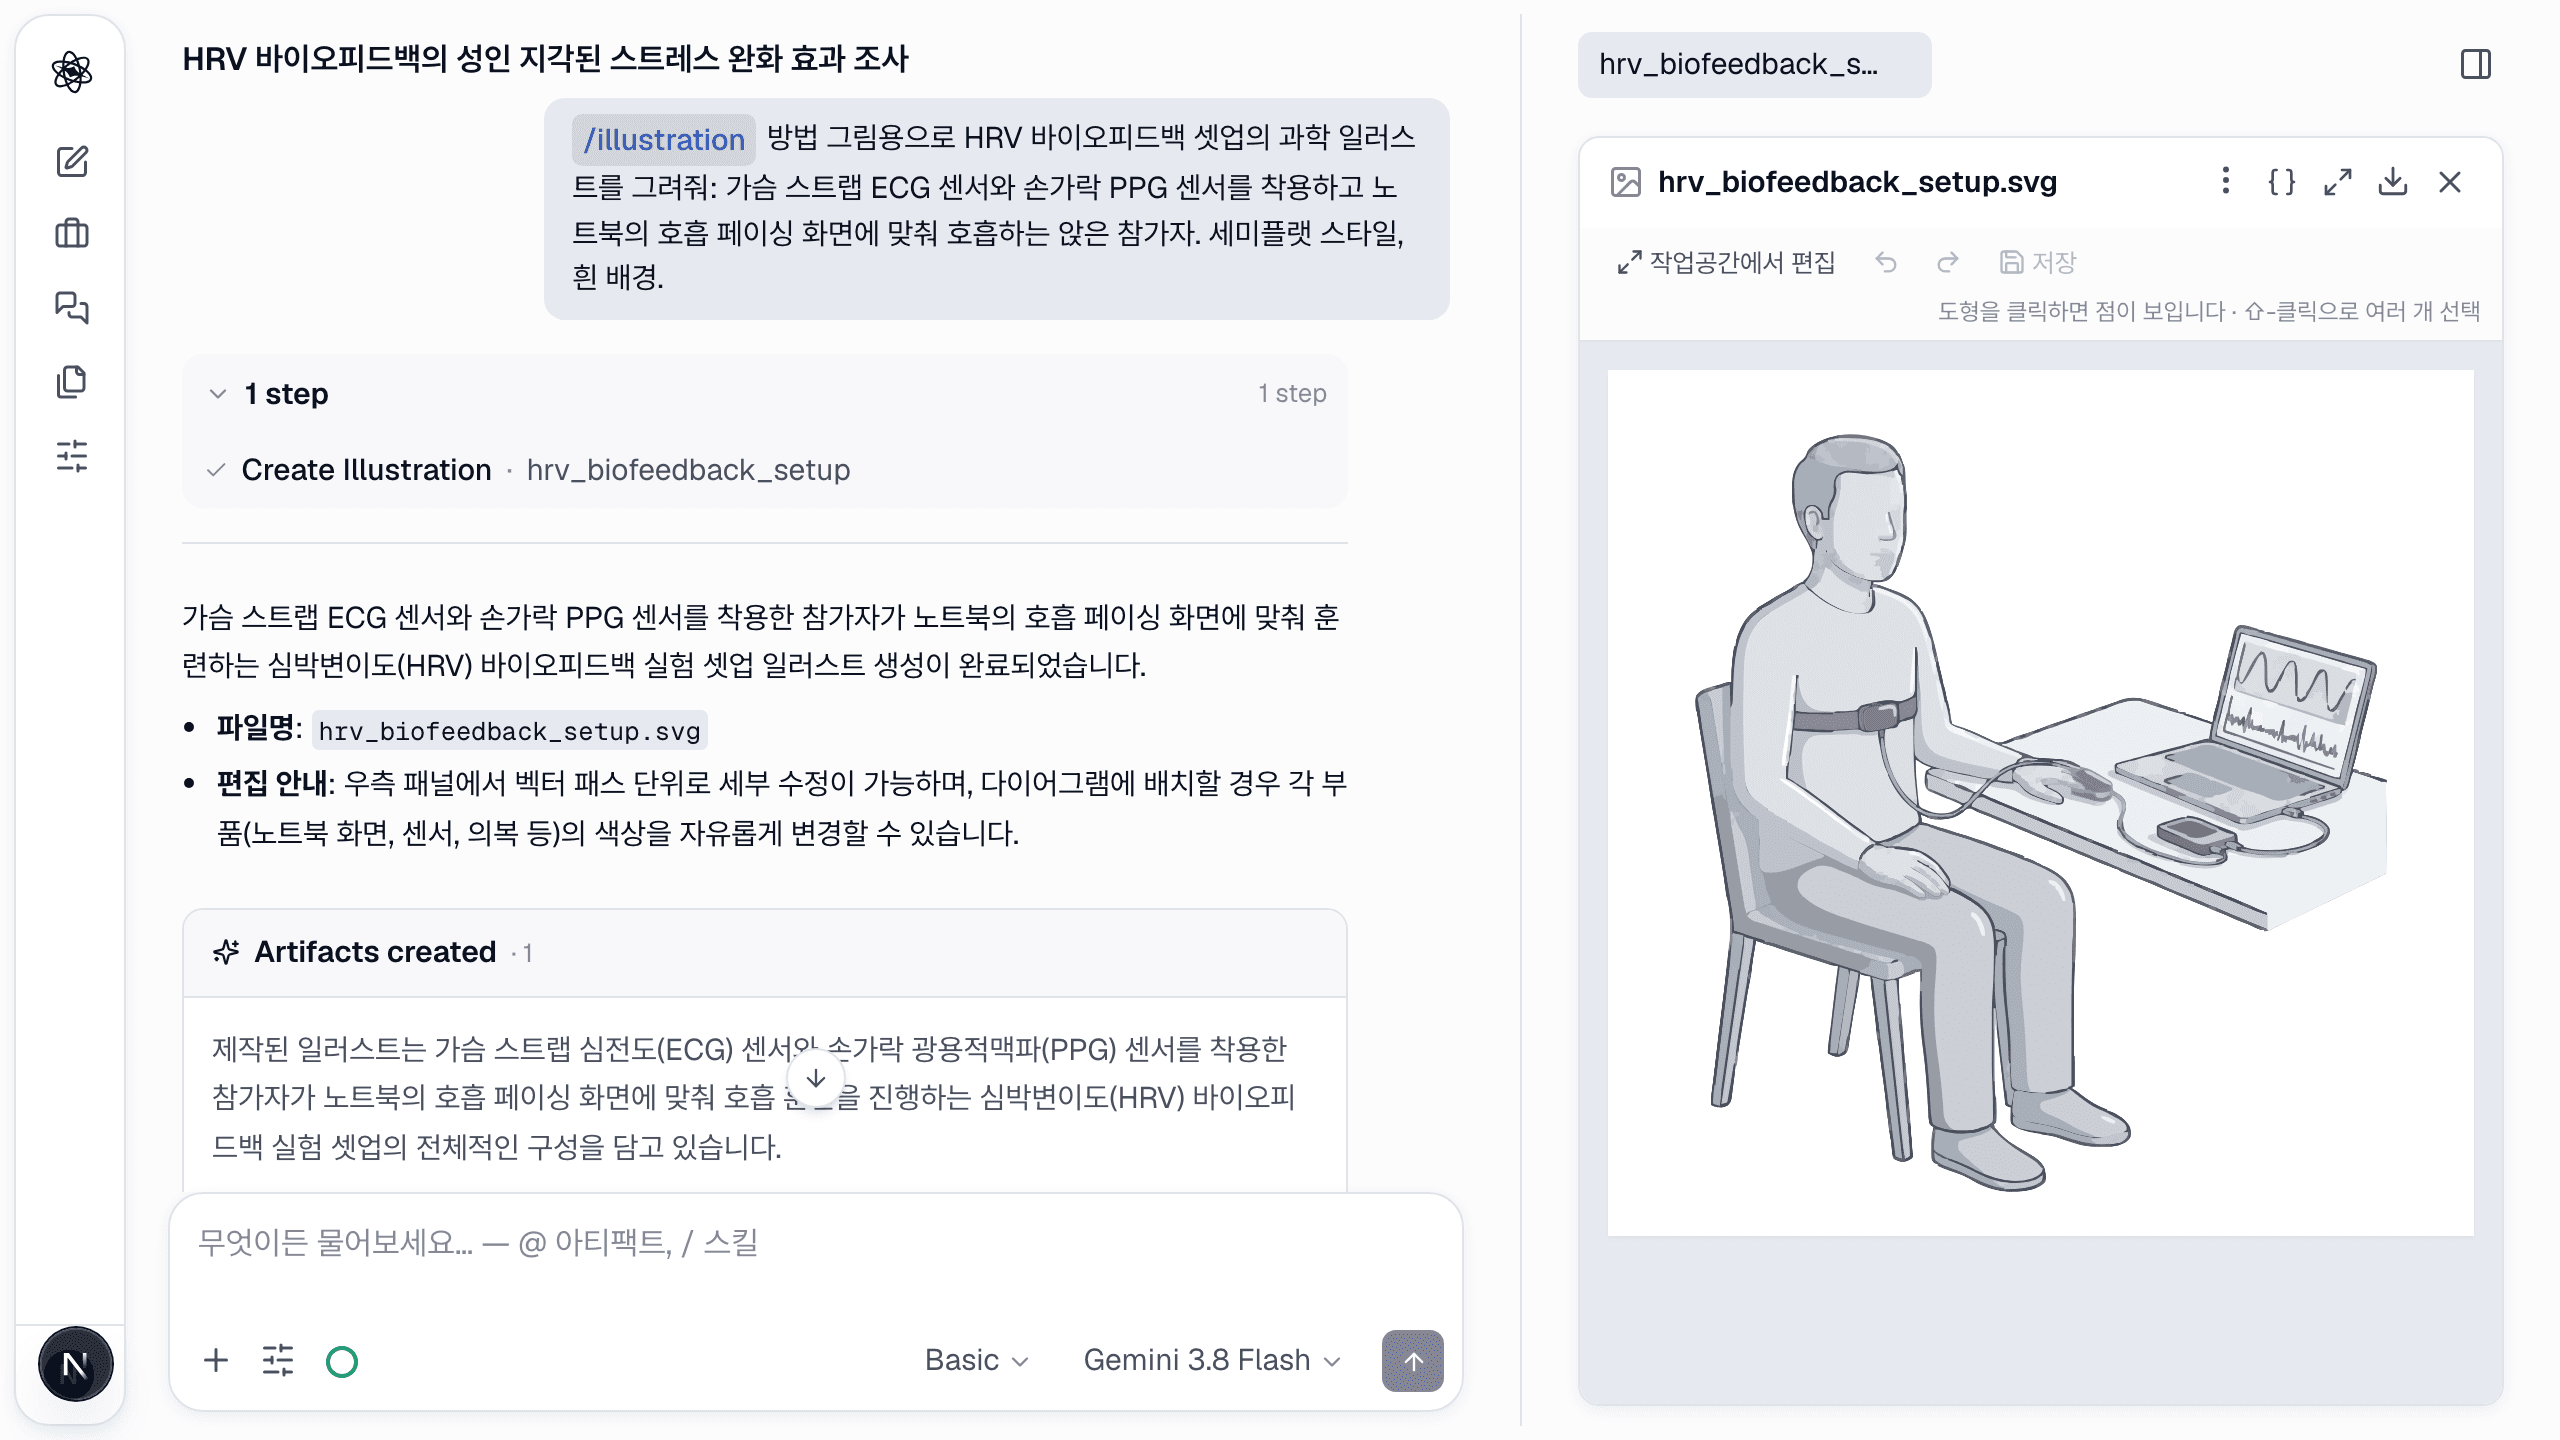
/illustrate A scientific illustration of the HRV biofeedback setup for a methods figure: a seated participant wearing a chest-strap ECG sensor and a fingertip PPG sensor, breathing along with a paced-breathing display on a laptop. Semi-flat style, white background.
일러스트는 부분 라벨이 있는 벡터 아트로 생성됩니다. 품질은 강도를 따릅니다 — Lite는 빠르고 거칠고, Deep은 출판 품질입니다.
작업공간에서 편집
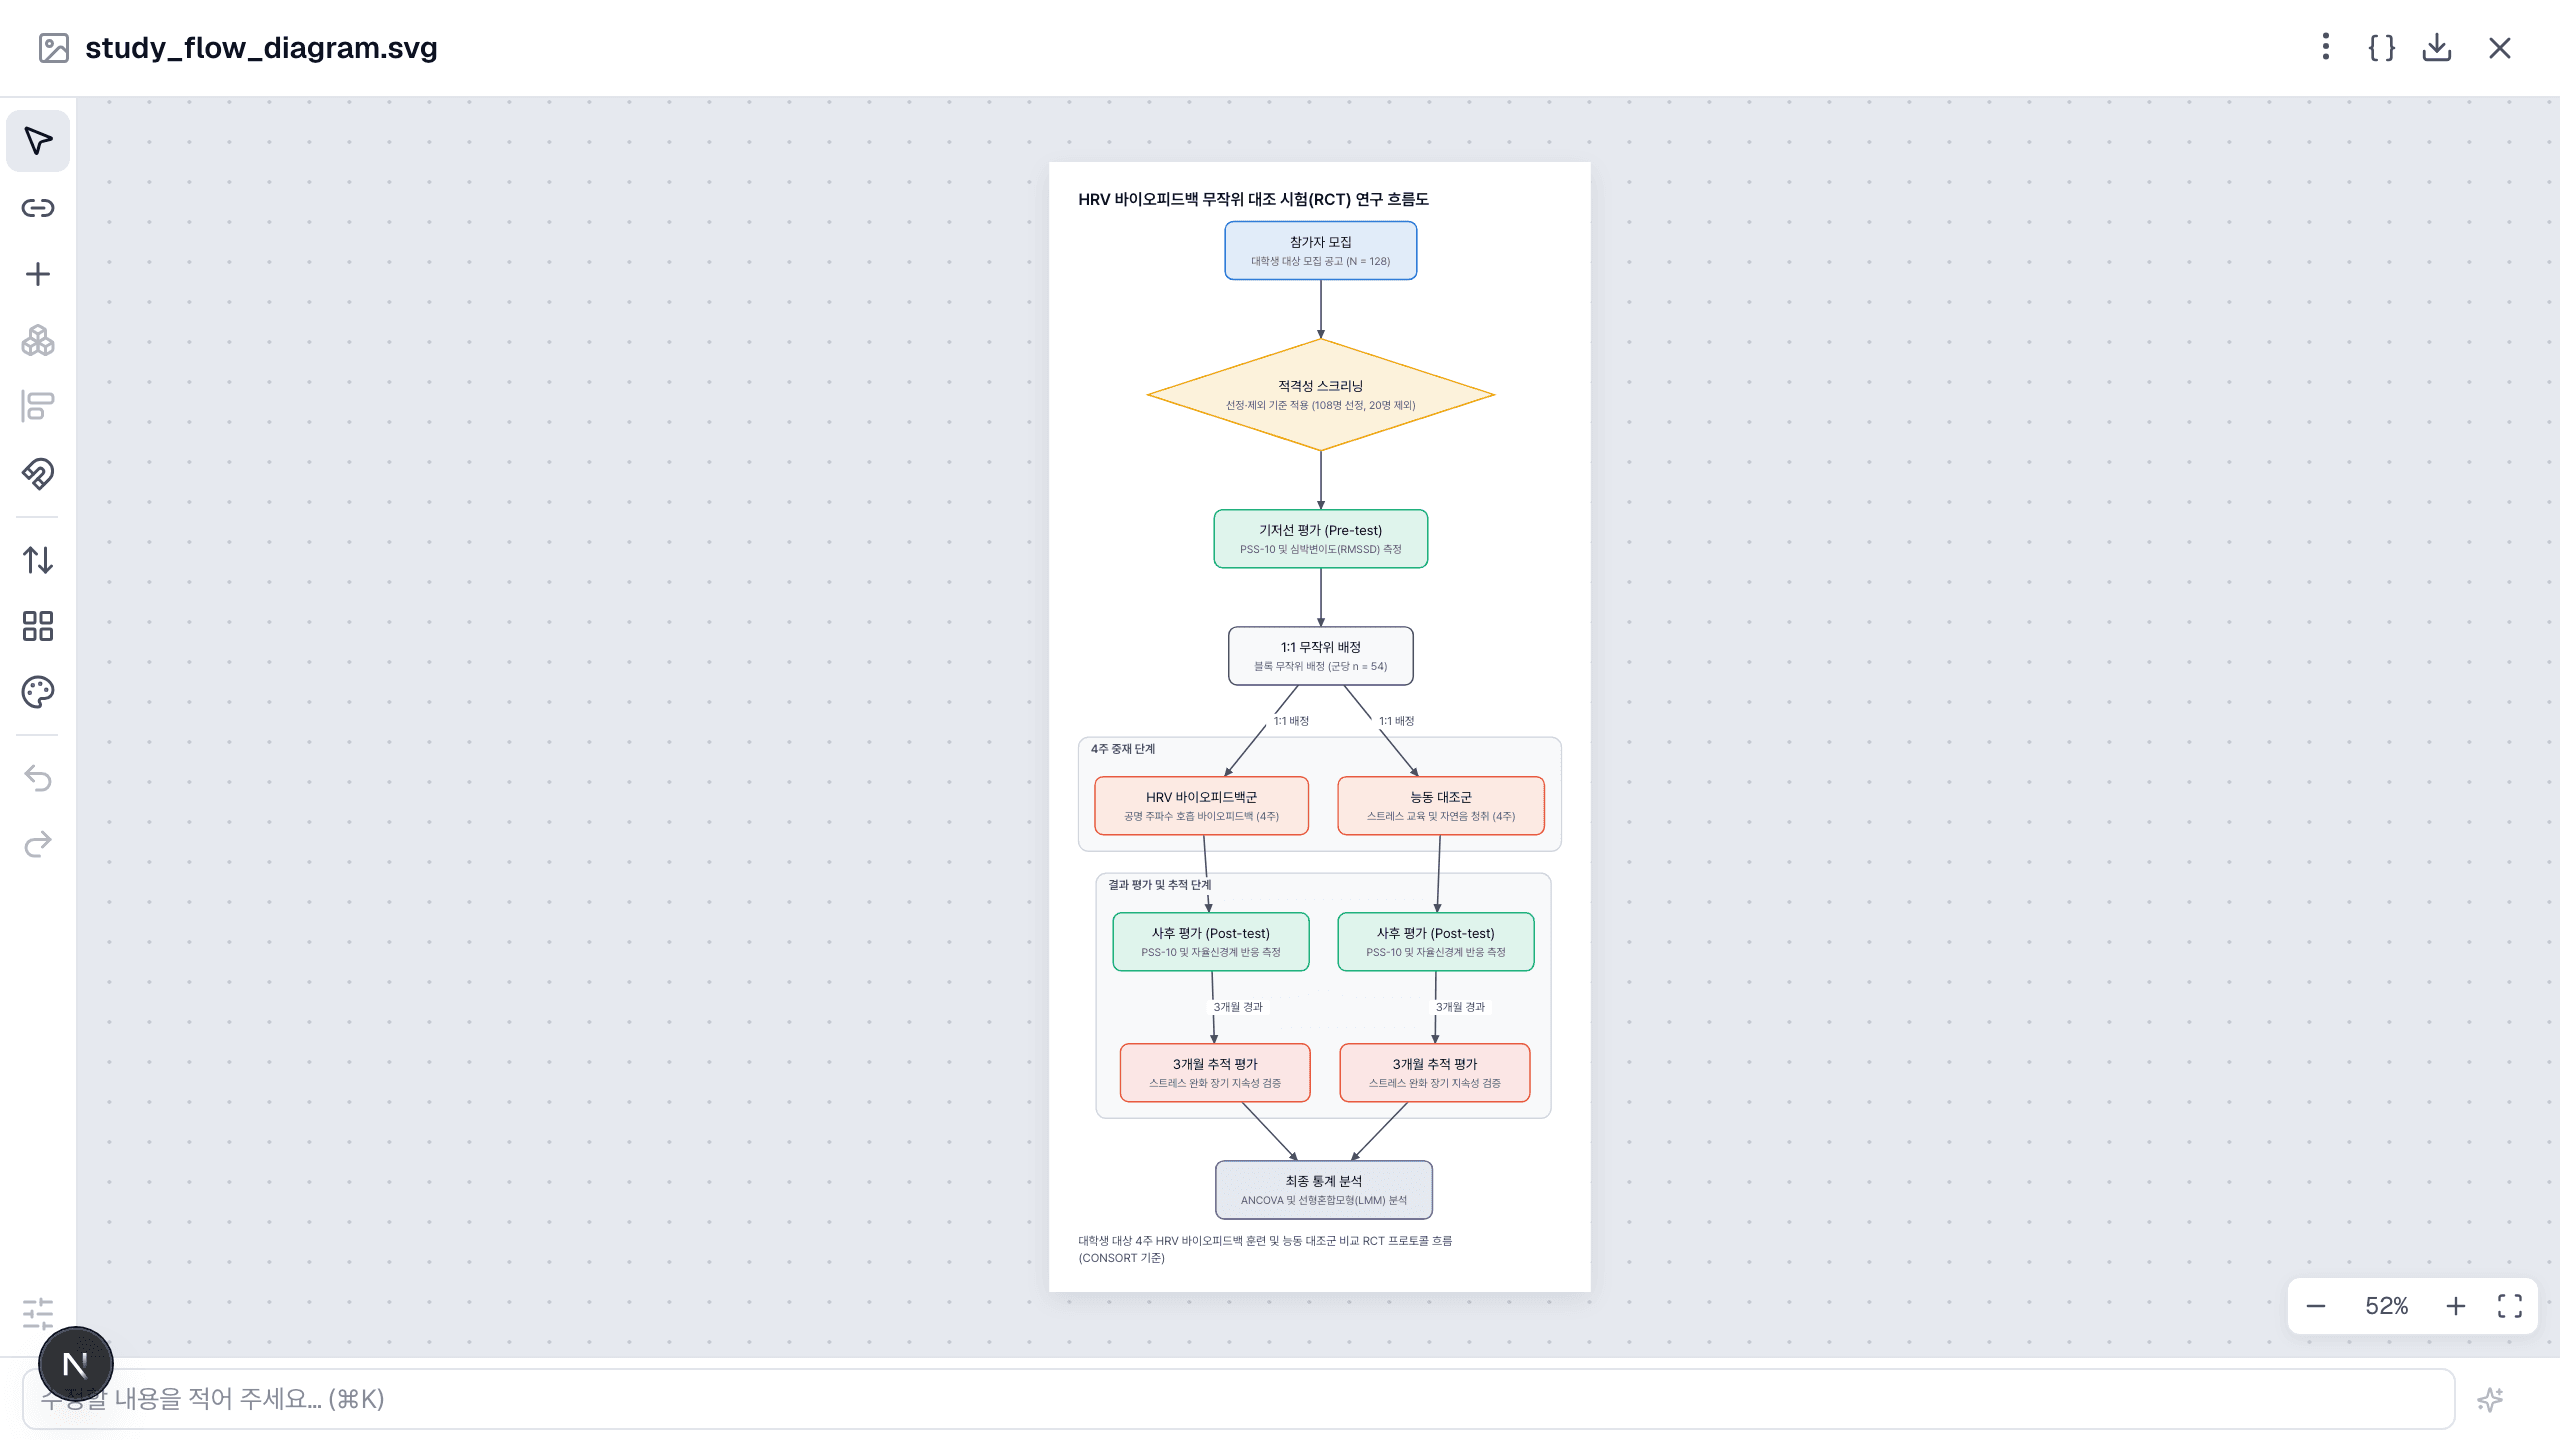
SVG 산출물에서 작업공간에서 편집을 누르면 편집기가 열립니다: 요소 이동·크기 조절, 색과 글꼴 변경, 라벨 수정, 정렬. 실행 취소/다시 실행이 되고 저장할 때마다 새 수정본이 됩니다.
내보내기
SVG, PNG, PDF, PPTX(PowerPoint에서 도형과 텍스트가 편집 가능)로 다운로드합니다. 저널이 요구하면 요청에 크기나 DPI를 명시하세요.
분석에서 나온 그림
분석·통계 턴에서 만든 플롯도 산출물입니다 — 열어서 스타일 변경을 요청하거나("흑백으로, 축 라벨을 한국어로") 편집기로 보내세요.
워크스루: Figure: 다이어그램과 일러스트.