图表 — /figure
text
/figure Draw the research flow of the experiment designed in this session as an editable vector diagram: recruitment → screening → randomization → HRV biofeedback (4 weeks) vs active control → post-test (PSS-10) → 3-month follow-up. Use the journal template.
figure 技能用期刊风格模板排布图表(流程图、框架、方案流程、时间线)并保存为 SVG。文本仍是文本,因此可搜索、可编辑。
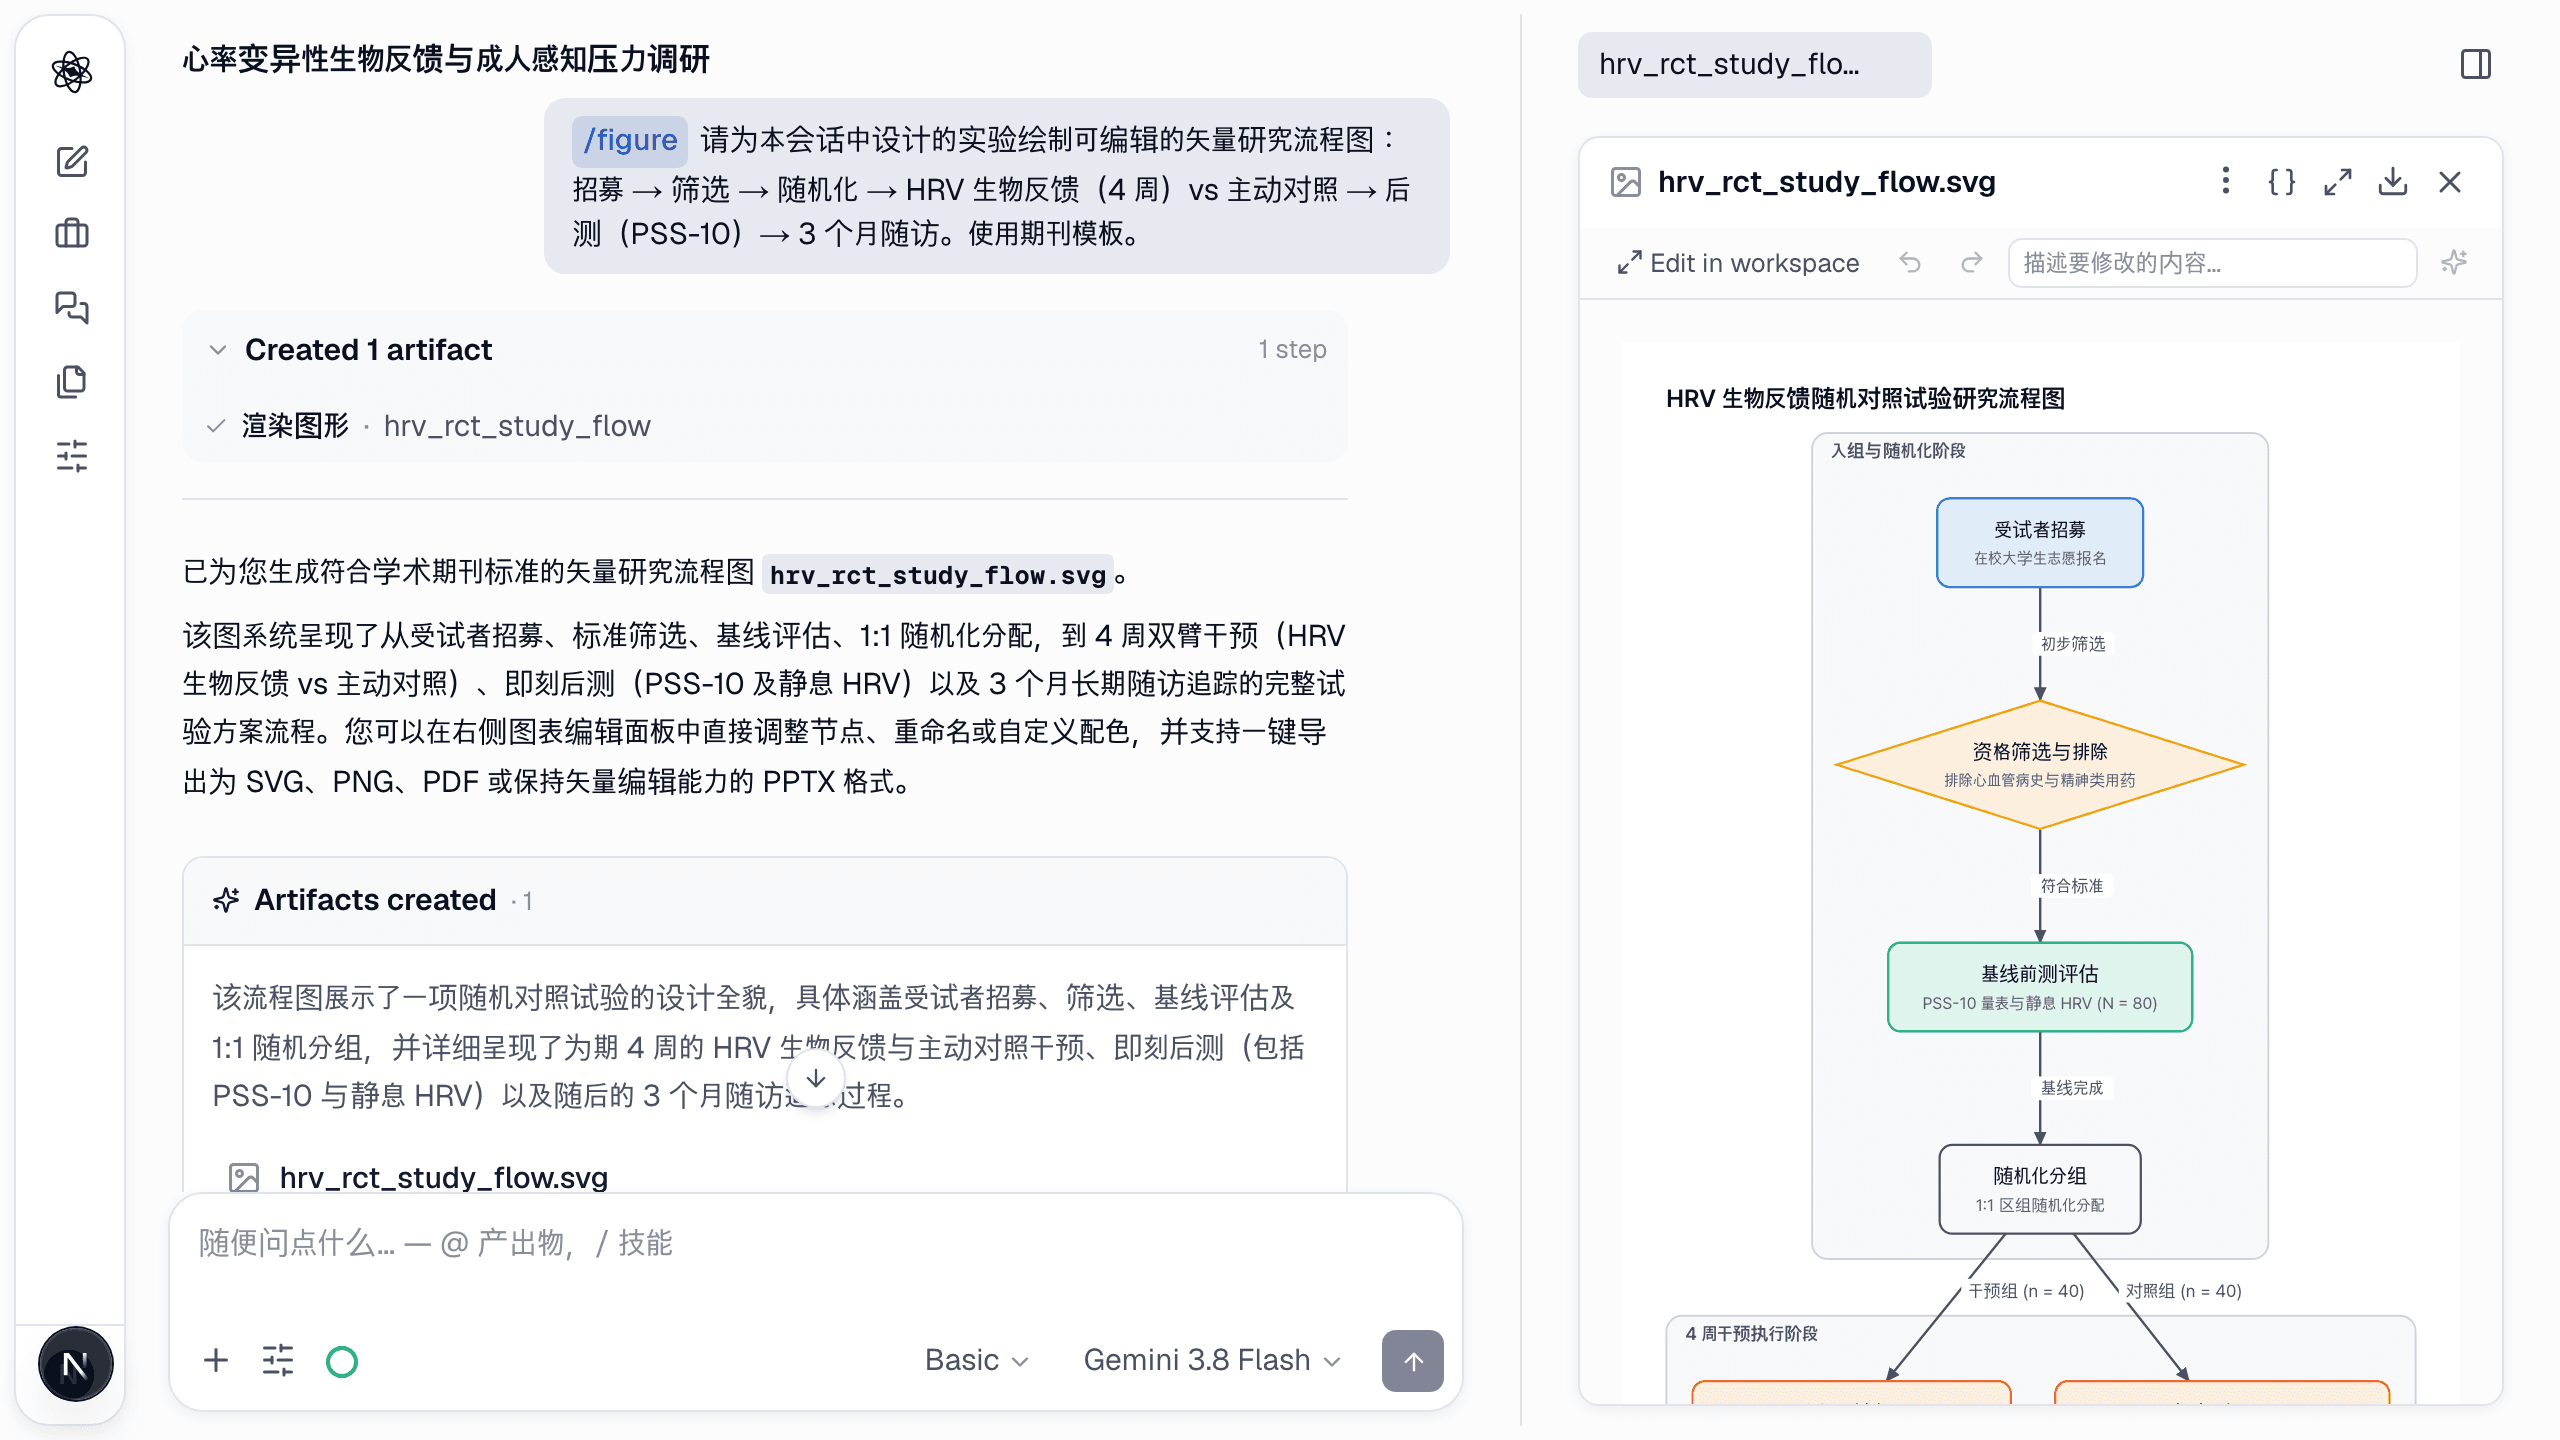
插图 — /illustrate
text
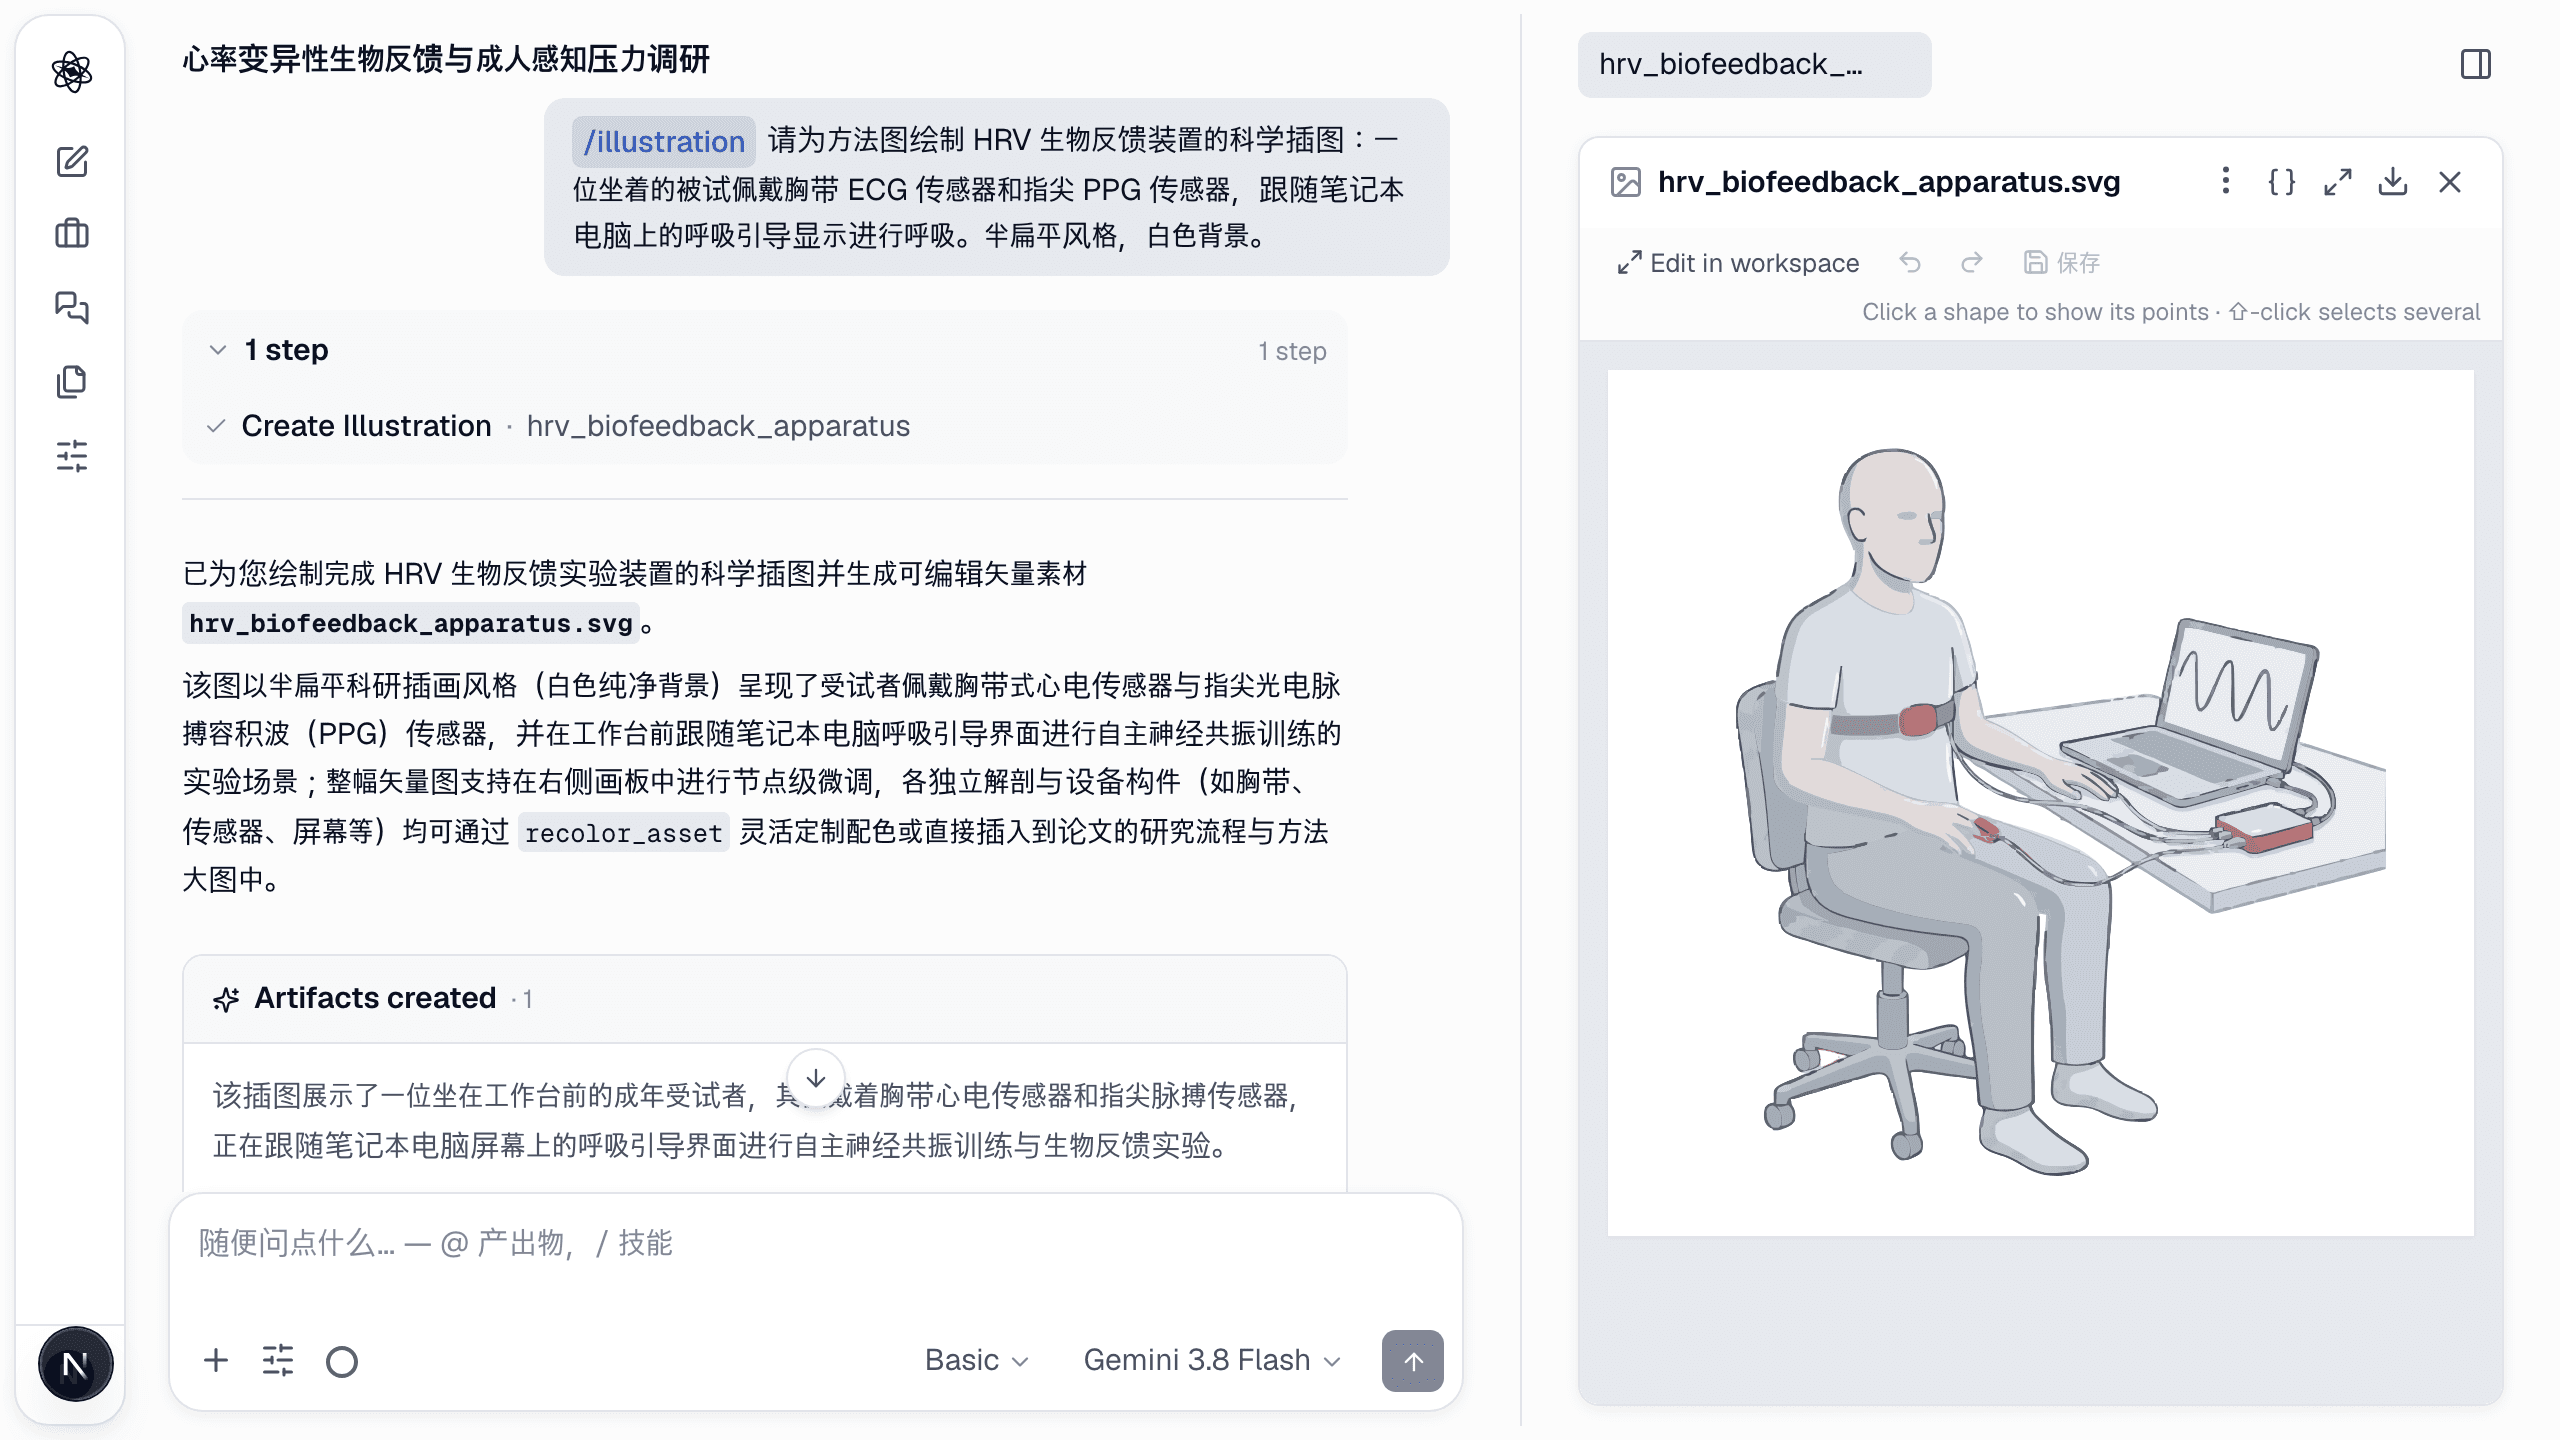
/illustrate A scientific illustration of the HRV biofeedback setup for a methods figure: a seated participant wearing a chest-strap ECG sensor and a fingertip PPG sensor, breathing along with a paced-breathing display on a laptop. Semi-flat style, white background.
插图生成为带部件标注的矢量艺术。质量随强度而定——Lite 快速粗略,Deep 达到出版级。
在工作区中编辑
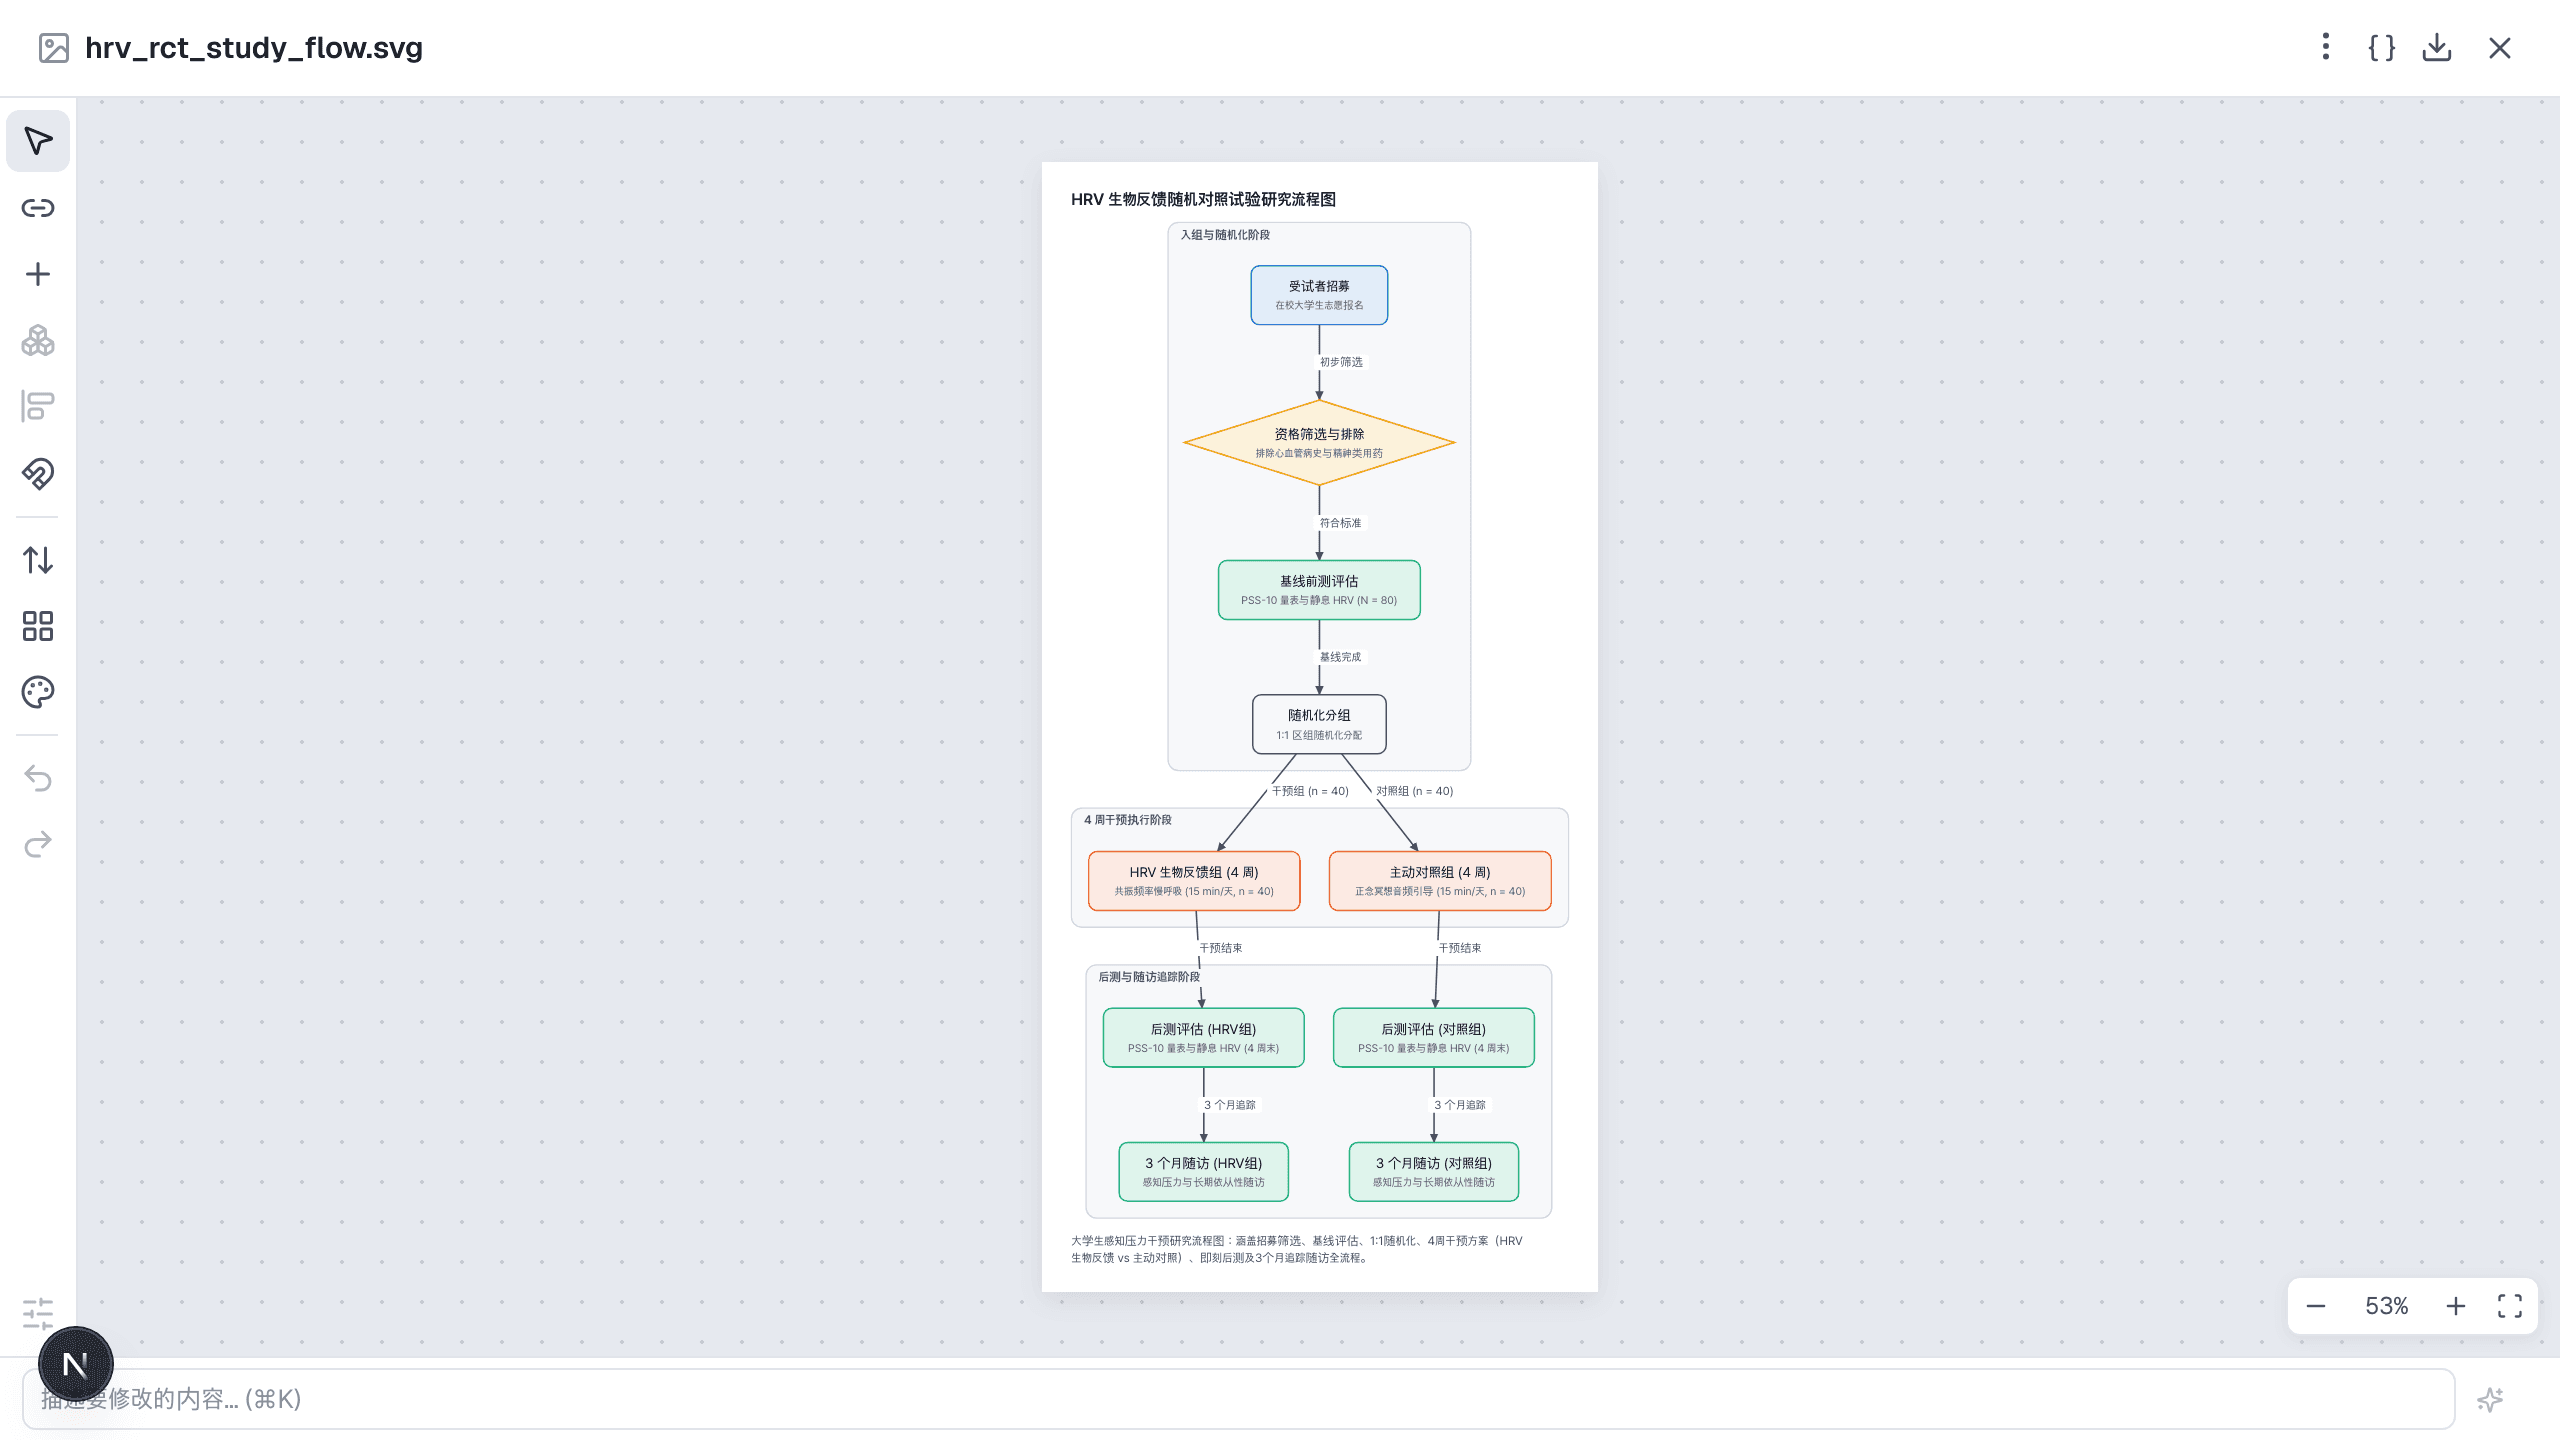
在任意 SVG 产物上按在工作区中编辑打开编辑器:移动和缩放元素、更改颜色和字体、重新标注、对齐。支持撤销/重做,每次保存都是一个新修订版。
导出
下载为 SVG、PNG、PDF 或 PPTX(在 PowerPoint 中形状和文本保持可编辑)。期刊有要求时,在请求中指定尺寸或 DPI。
来自分析的图表
分析和统计回合中生成的图表也是产物——打开它们,请求样式修改("改为灰度,坐标轴标签用中文"),或发送到编辑器。
教程:图表:示意图与插图。