figure draws diagrams — study flow, protocol, conceptual framework, path/SEM model, analysis pipeline, concept tree, simple charts — as native vector figures from a figure DSL. Not for photographic or illustrative art: that is /illustrate.
How to call it
text
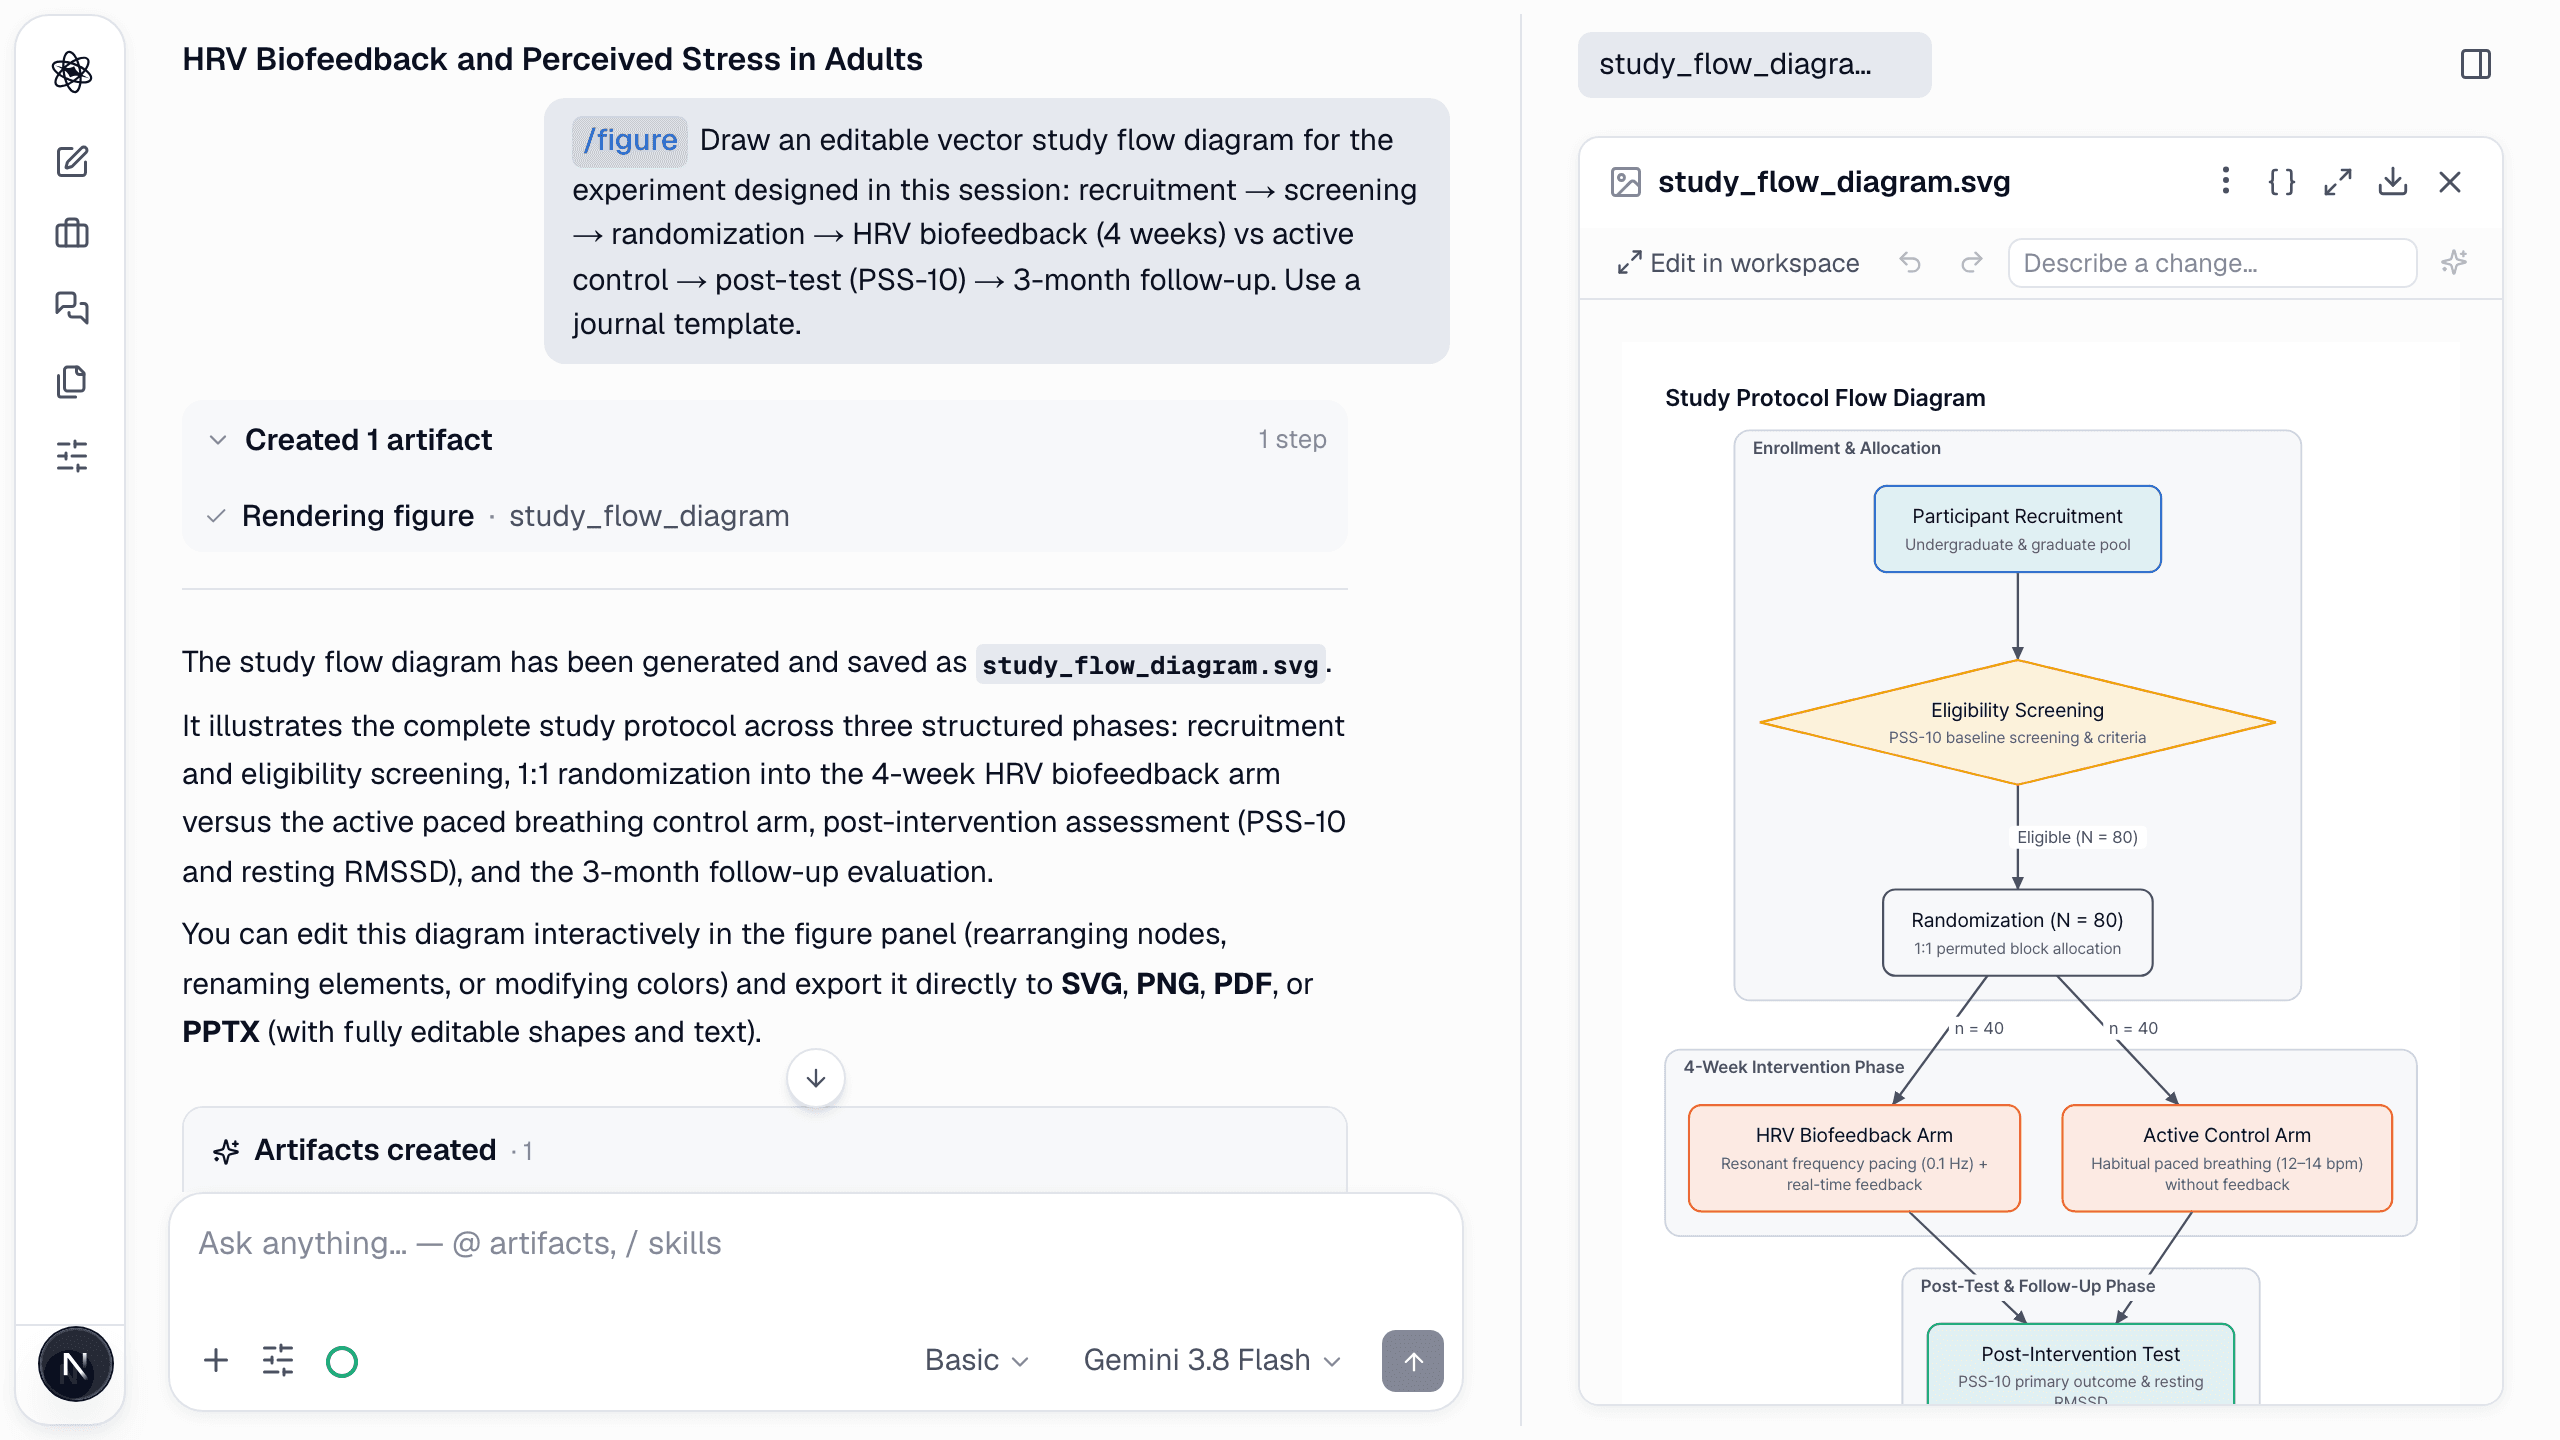
/figure Draw the study flow diagram for the experiment designed in this session: recruitment → screening → randomization → HRV biofeedback (4 weeks) vs active control → post-test (PSS-10) → 3-month follow-up. Use a journal template.
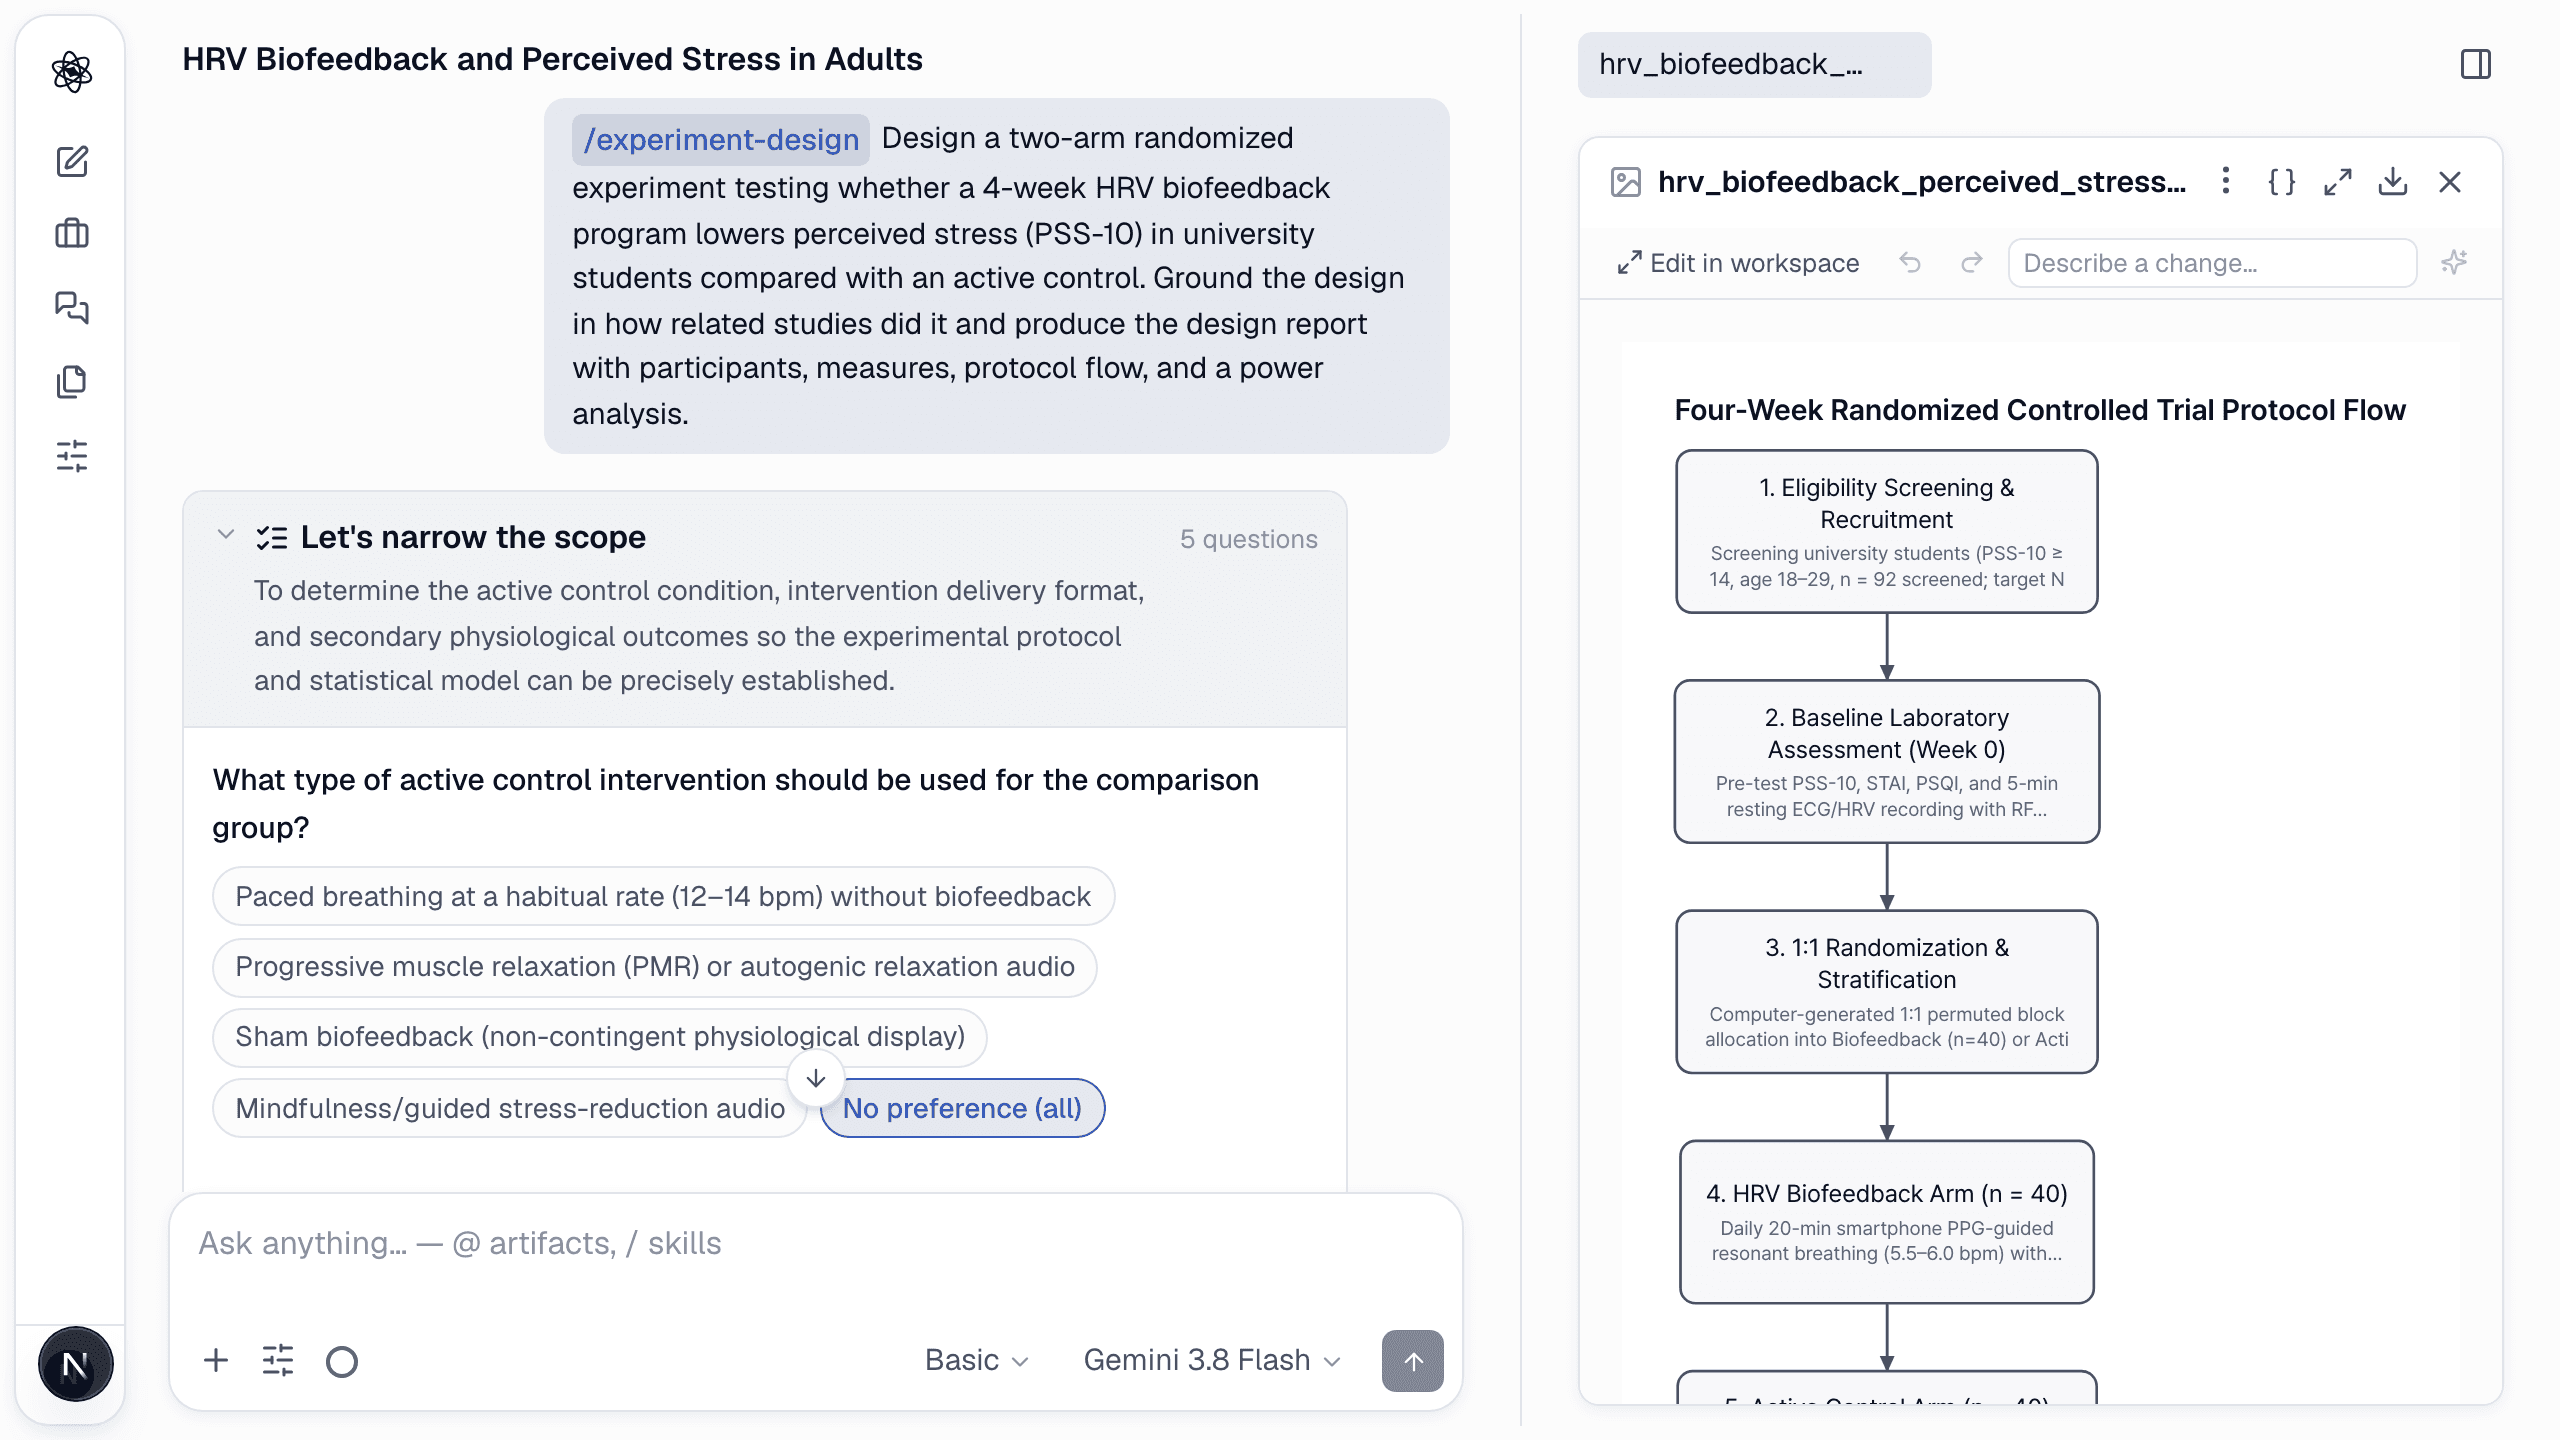
It reads the session — a design or an analysis earlier in the chat — so you describe the figure, not the study.
What happens
- The diagram is built as nodes, edges and groups in a journal template and rendered as SVG.
- It opens in the figure panel: drag, rename, recolor, or type a change in "Describe a change…"; undo/redo keep the history.
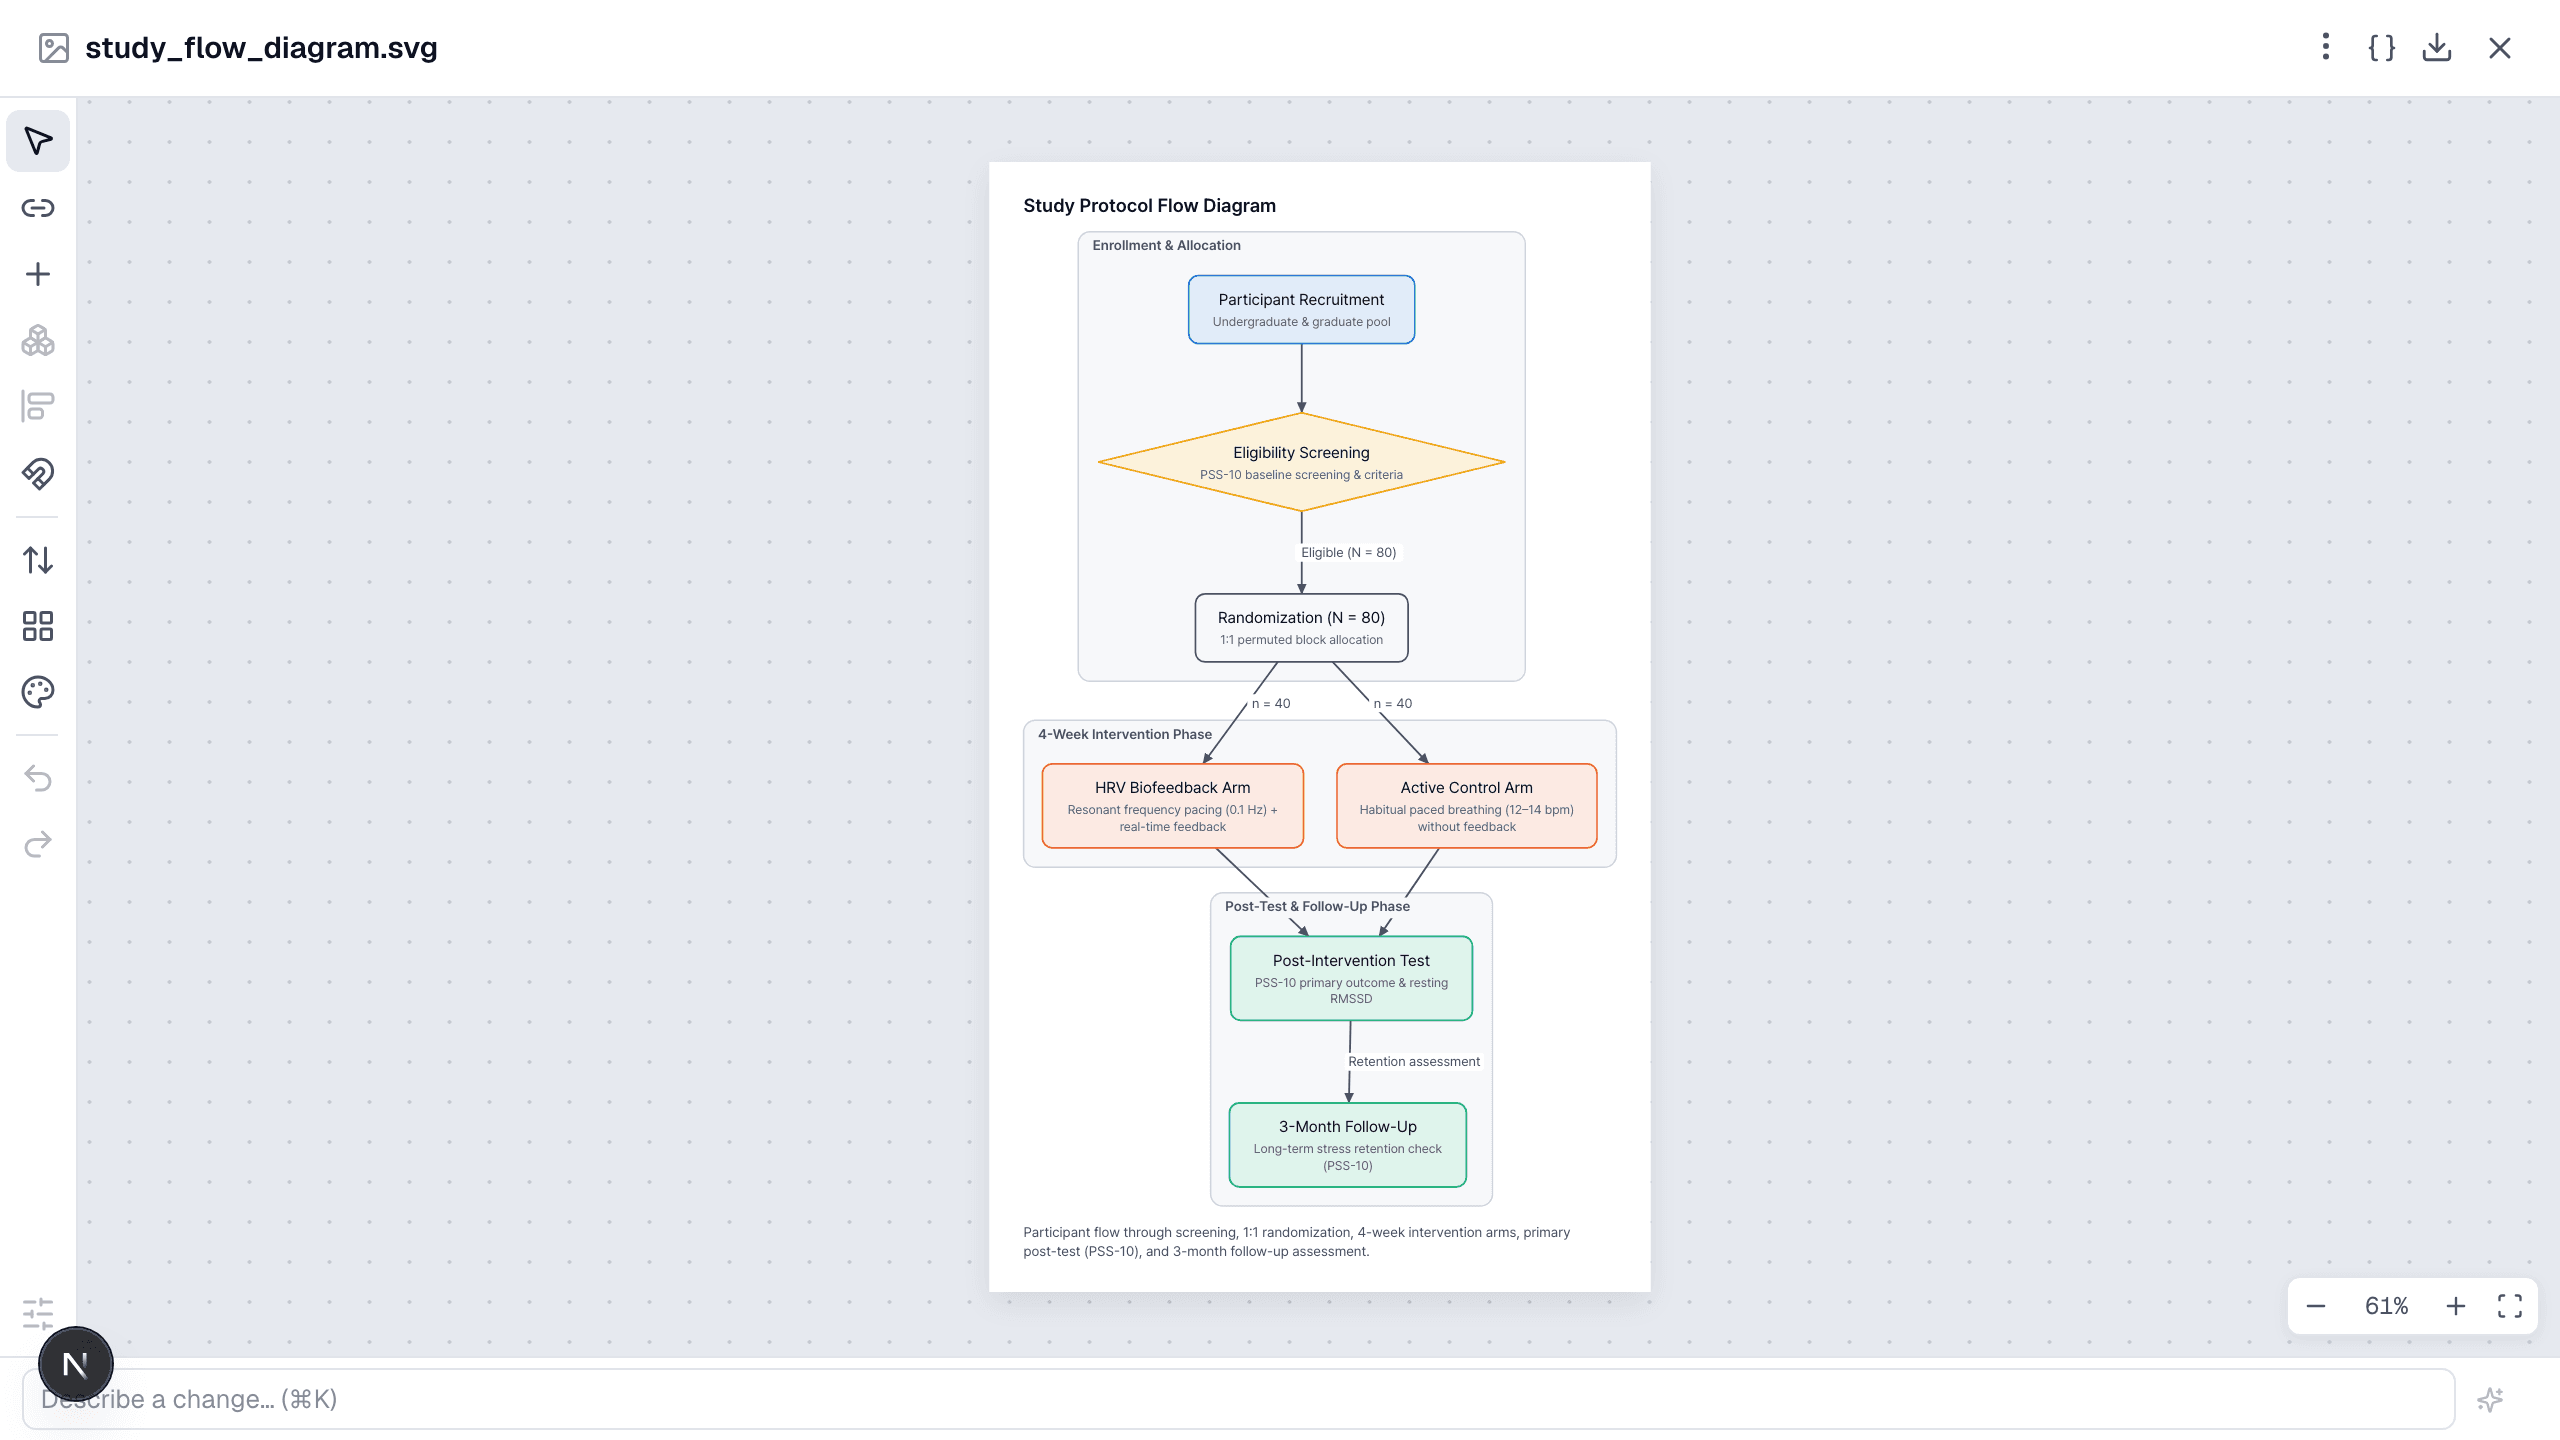
- "Edit in workspace" opens the full editor: select shapes and points, align, compose panels, save versions.
What you get
- The figure artifact (editable), exportable to SVG, PNG, PDF and PPTX with shapes and text intact.
- Session citations can be attached to nodes; multi-panel figures compose several artifacts with panel letters.
Tips
- Name the template ("Nature-style", "APA") and the palette; the figure follows it.
- Place an illustration inside a diagram as a node icon by referencing it by name.