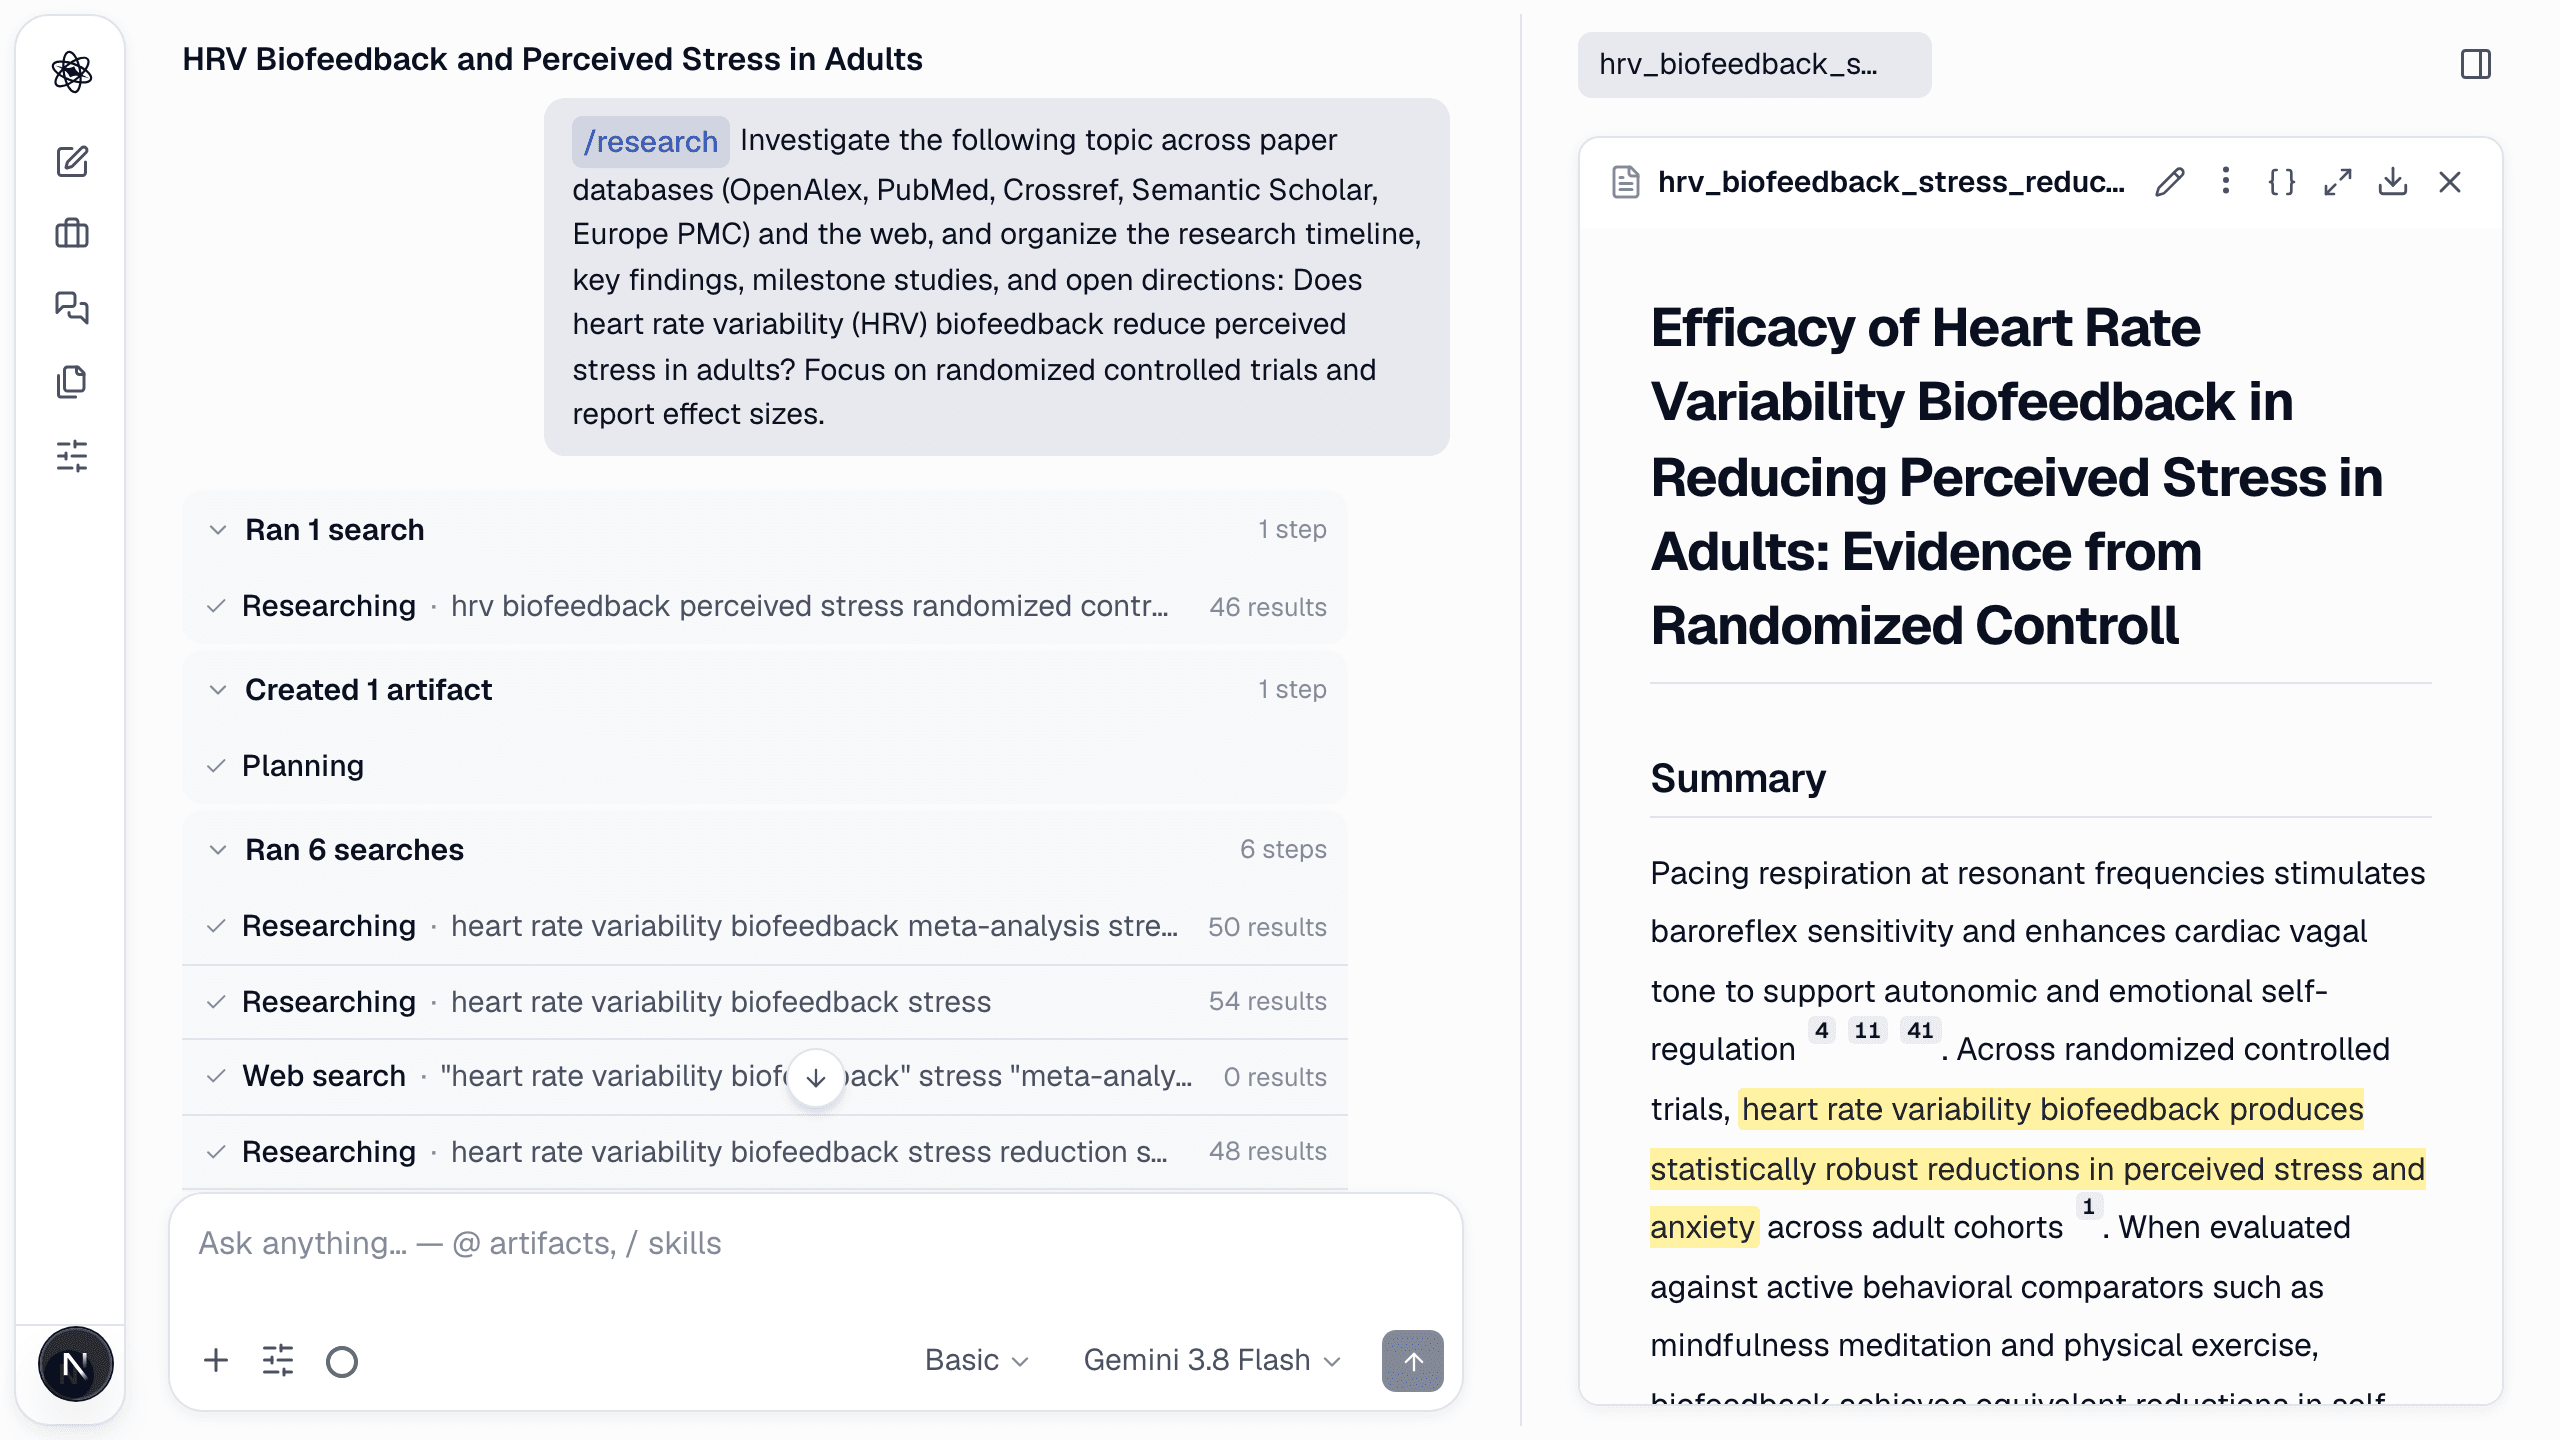
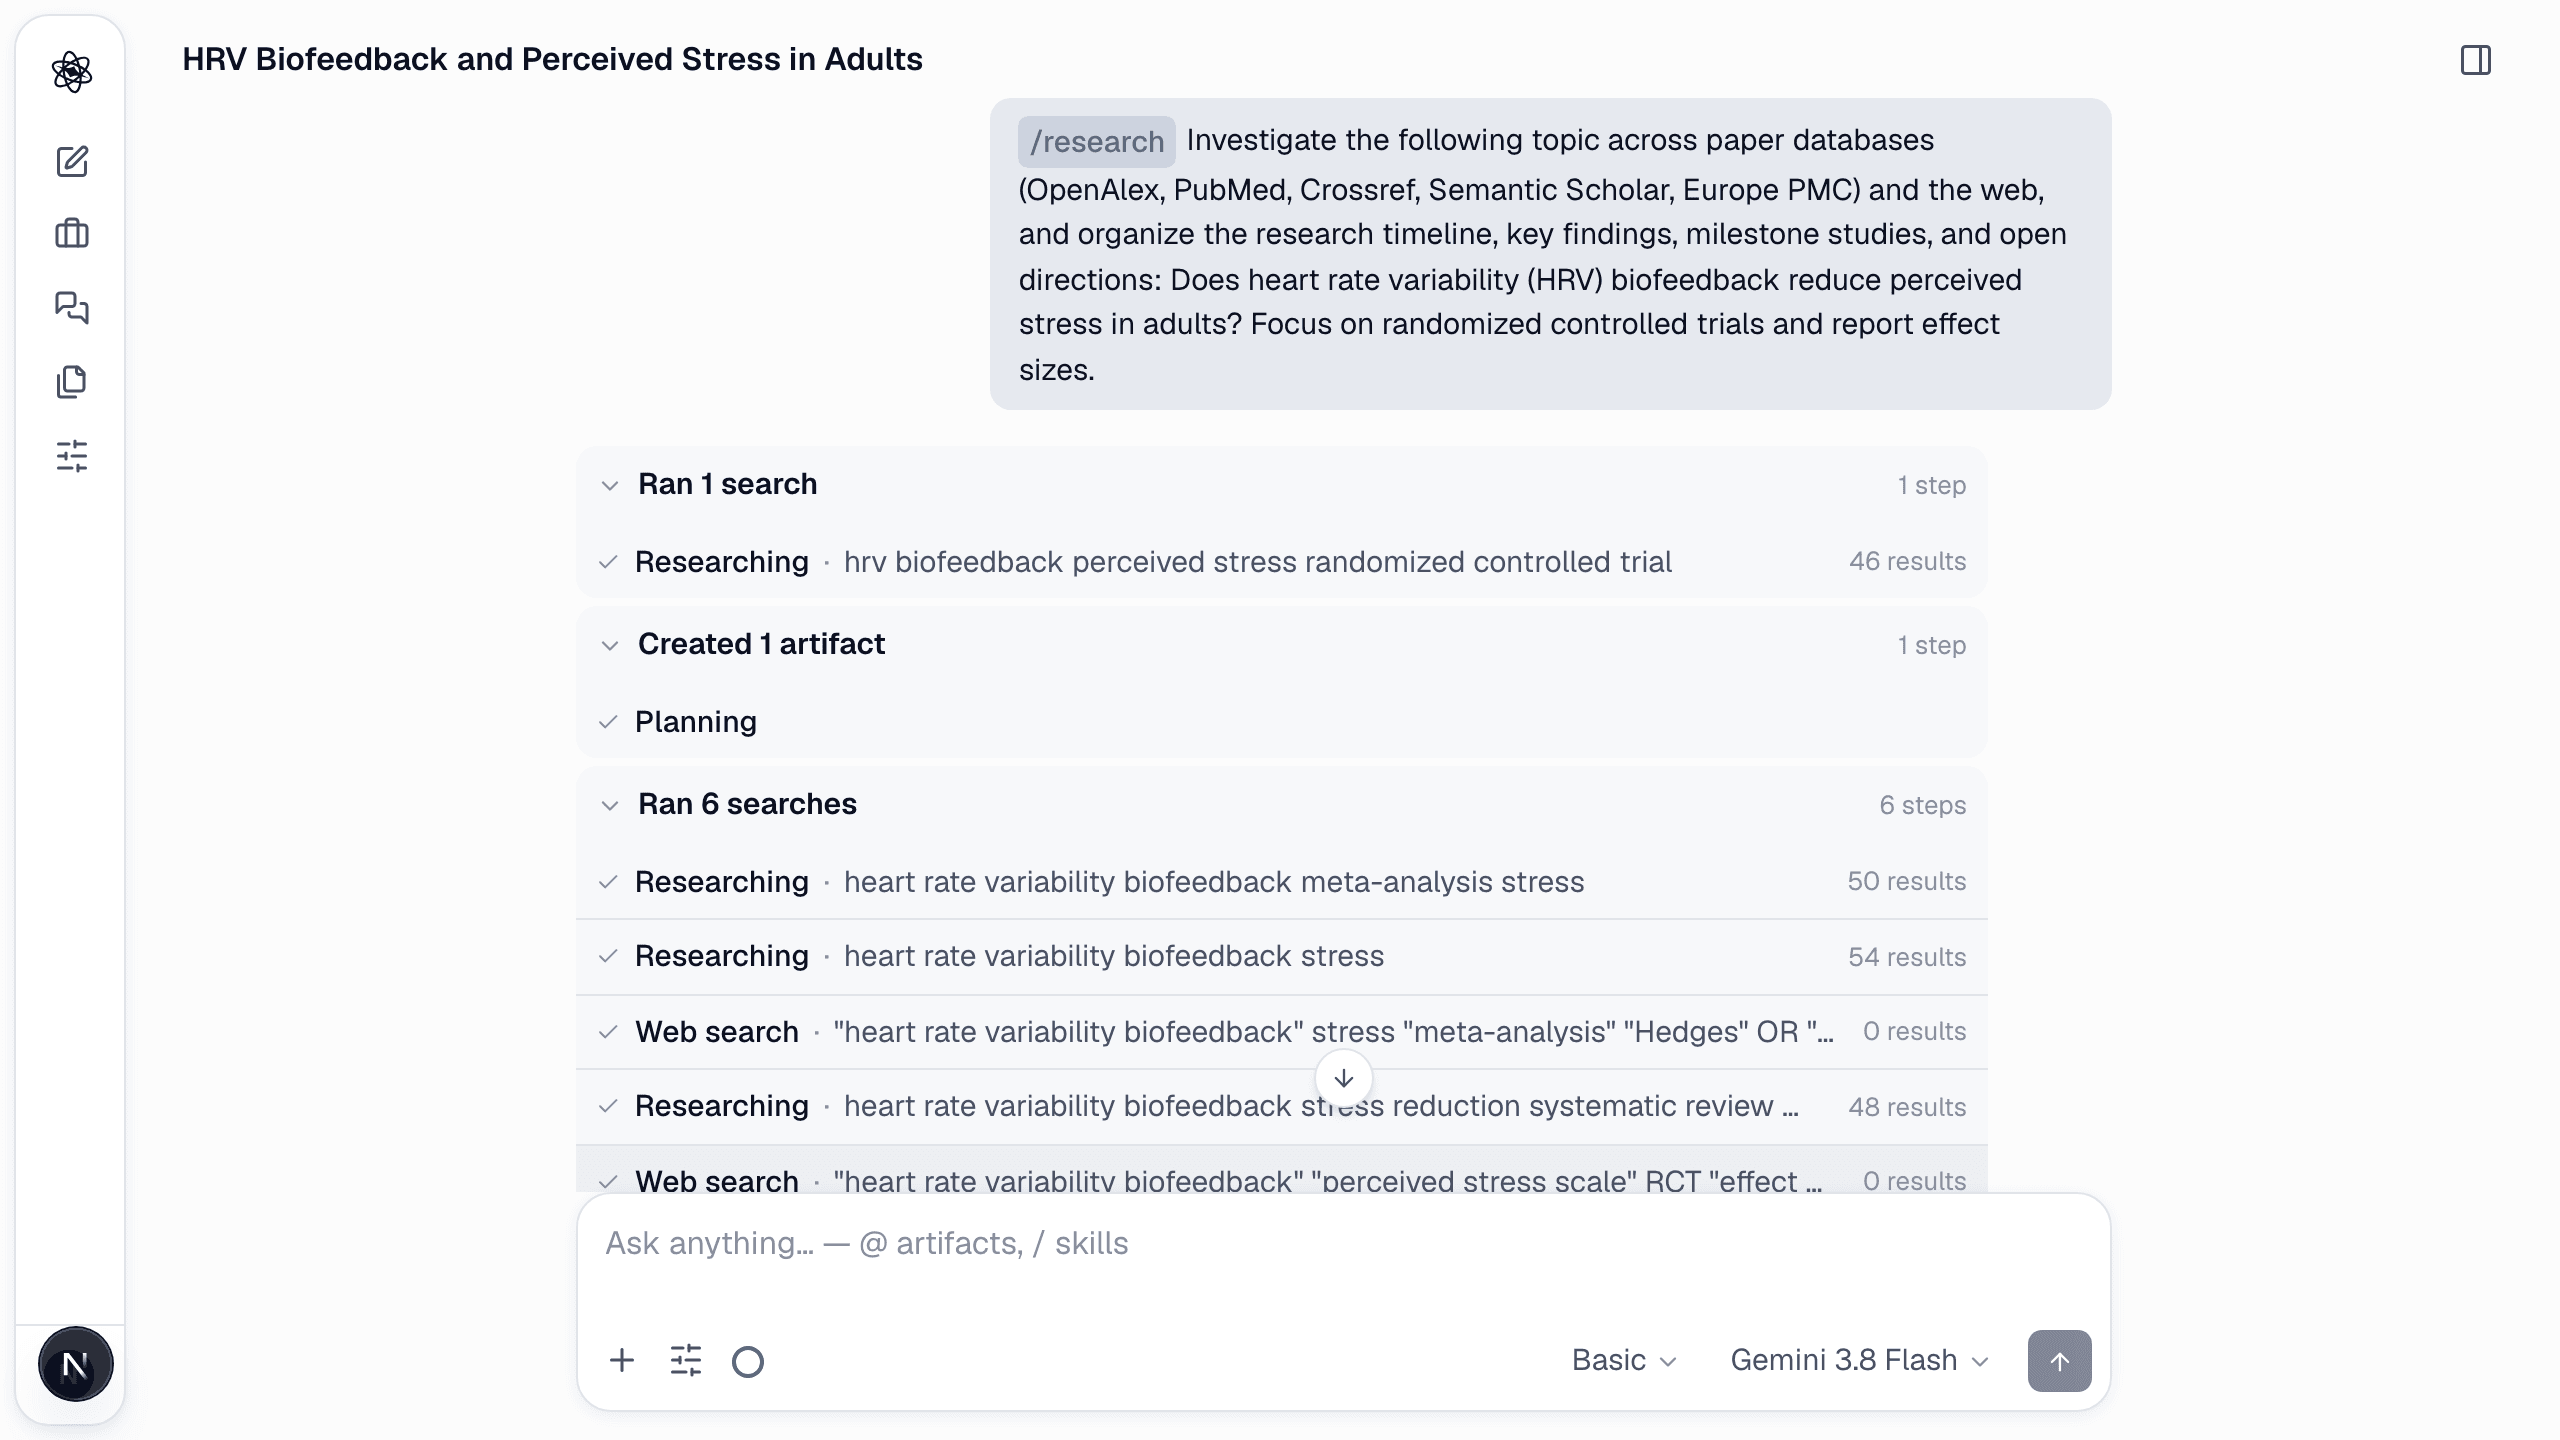
data-analysis is the end-to-end analysis skill for an uploaded dataset — a spreadsheet, logs, a recording or a video. It composes twelve method skills and always follows the same order: inspect, plan, analyze, interpret.
How to call it
text
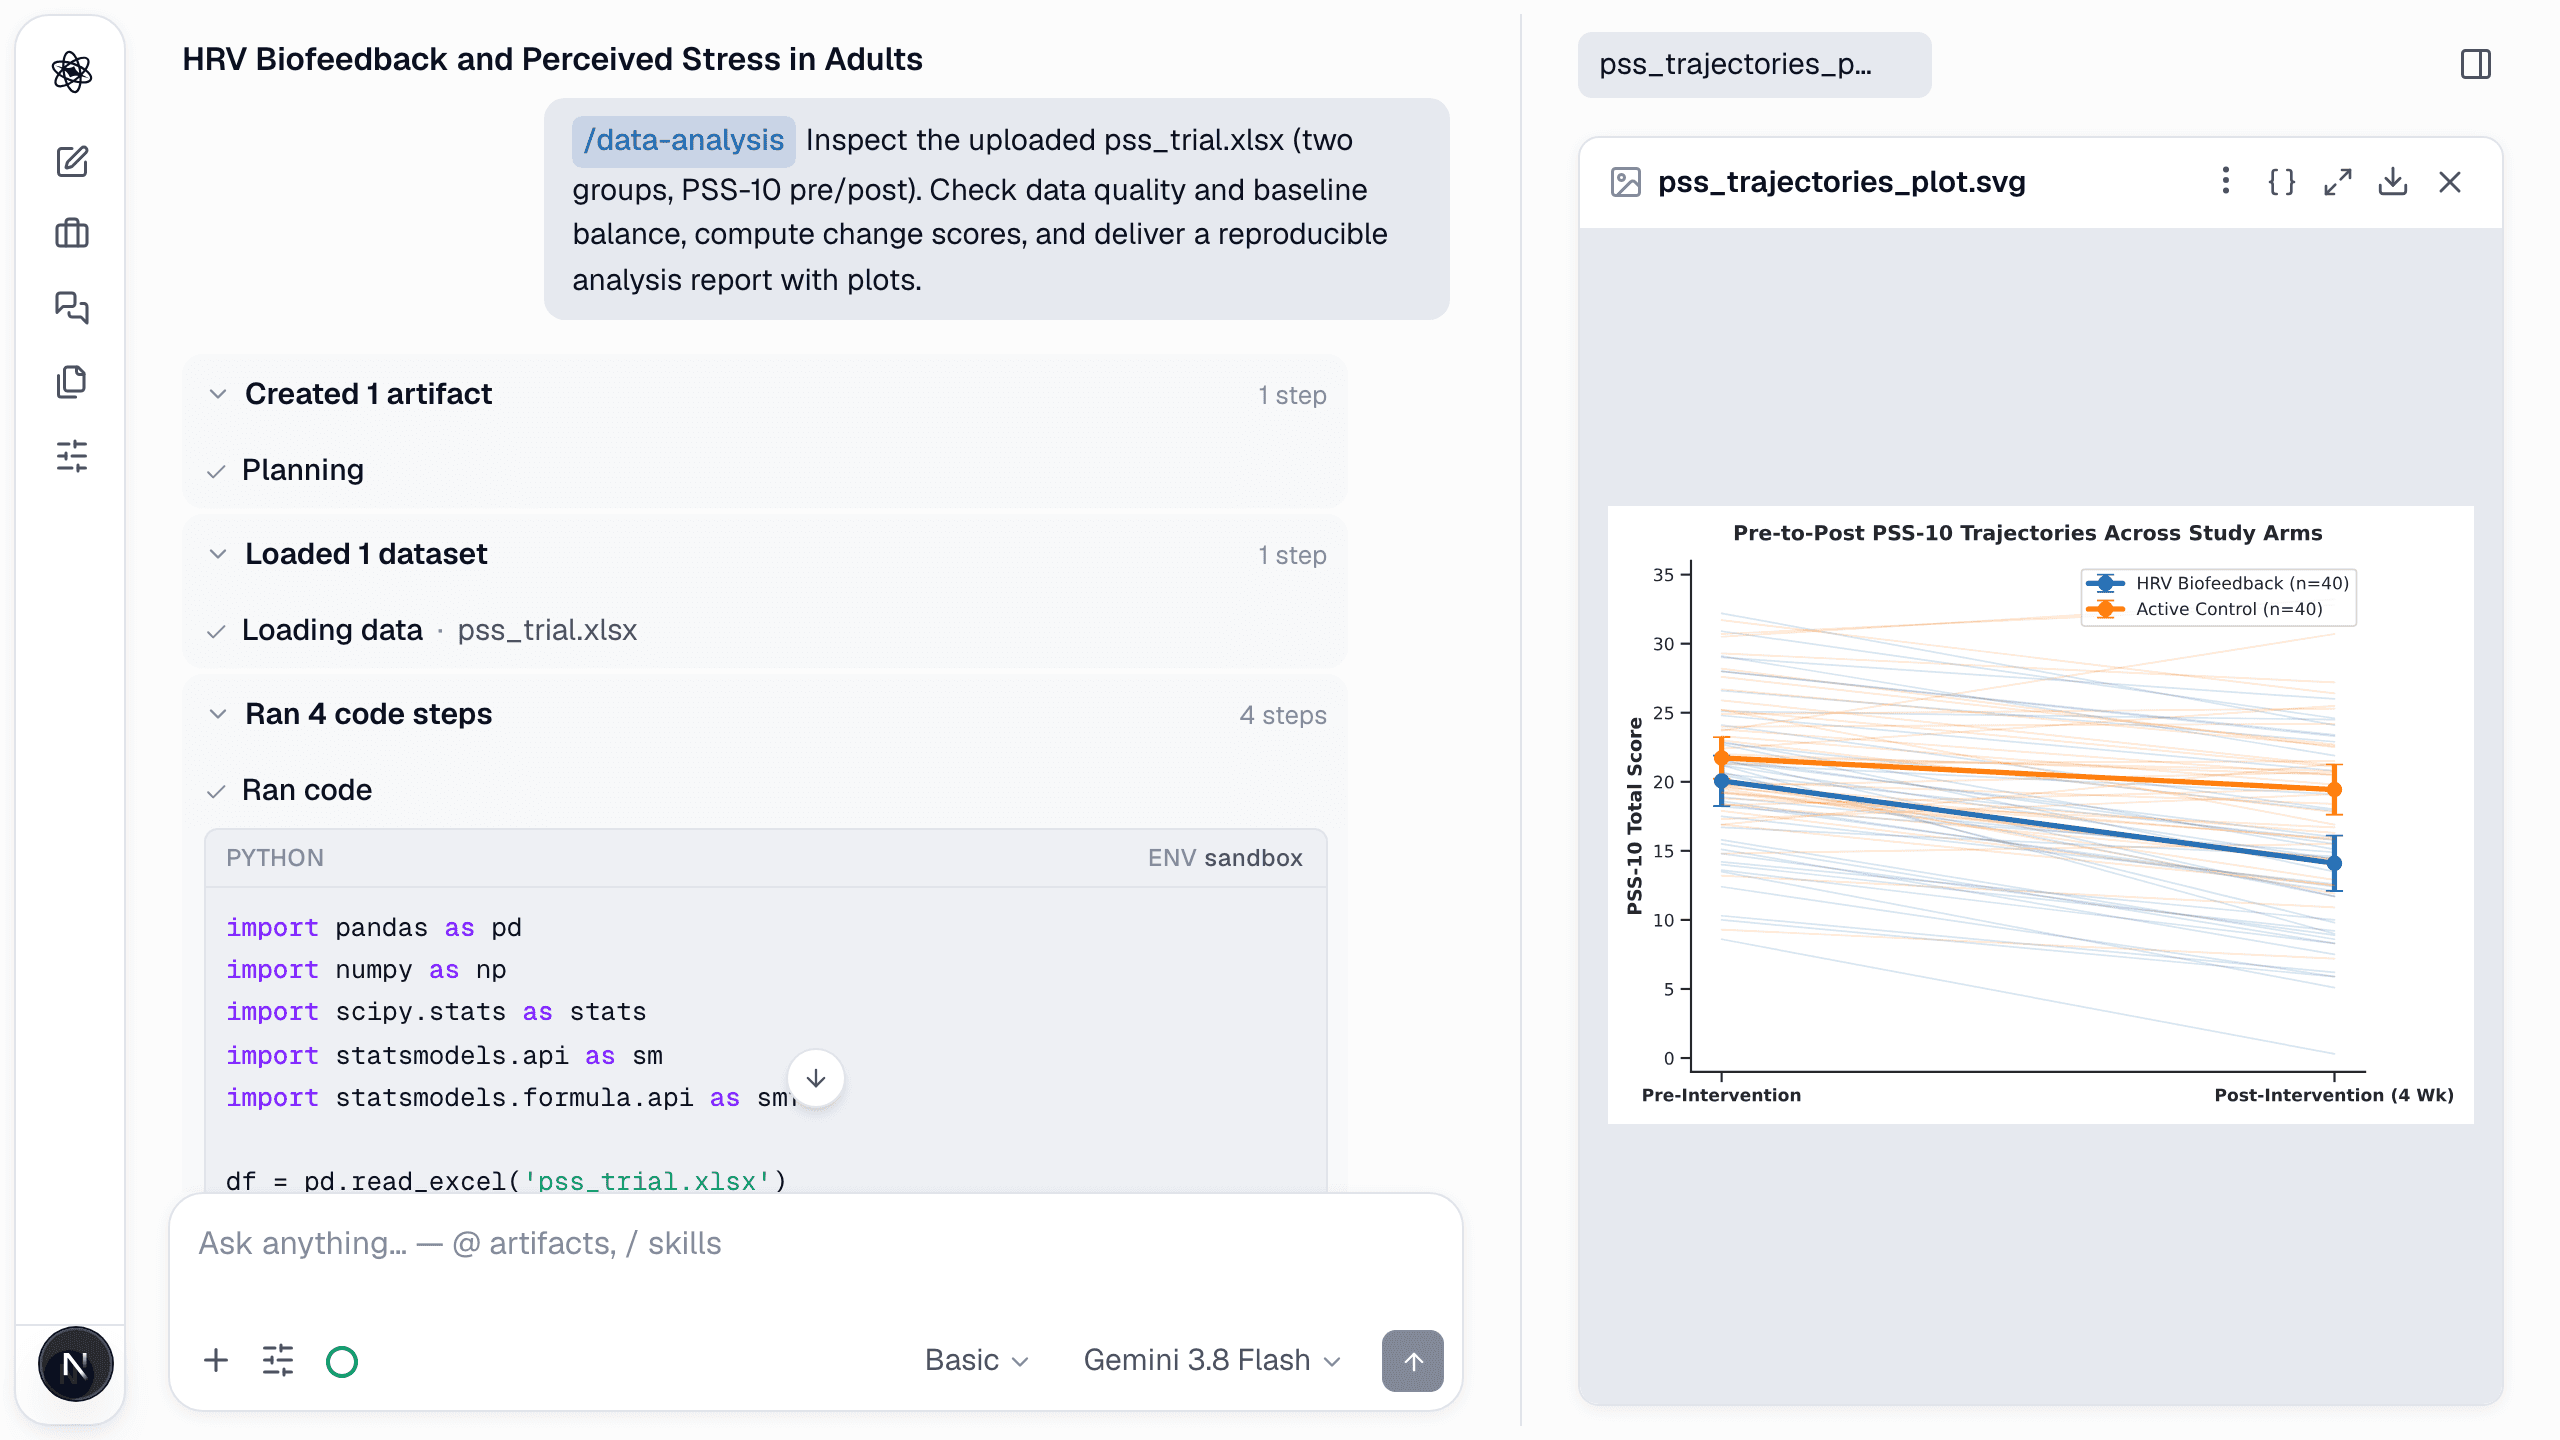
/analyze Inspect the uploaded pss_trial.xlsx (two groups, PSS-10 pre/post). Check data quality and baseline balance, compute change scores, and deliver a reproducible analysis report with plots.
Attach the file with the + button first; it stays in the session for later steps.
What happens
- Inspect: structure, missing values, ranges, group balance — reported before anything is computed.
- Plan: an explicit analysis plan you can read (and object to).
- Analyze: code runs in the sandbox, each step visible and expandable; every artifact records the code and data snapshot behind it.
- Interpret: a report with data quality, plan, assumption checks, results with effect sizes and CIs, interpretation and limitations.
Method skills it composes
- descriptives · correlation · regression (linear · logistic) · mixedlm (mixed-effects) · abtest
- transcription (local whisper) · acoustic (formants · MFCC) · voice (emotion features)
- face_expression (image · video) · pose (image · video) · rppg (heart rate from face video) · eeg_suite (preprocess · band power · topomap · ERP · ERD/ERS · SSVEP)
What you get
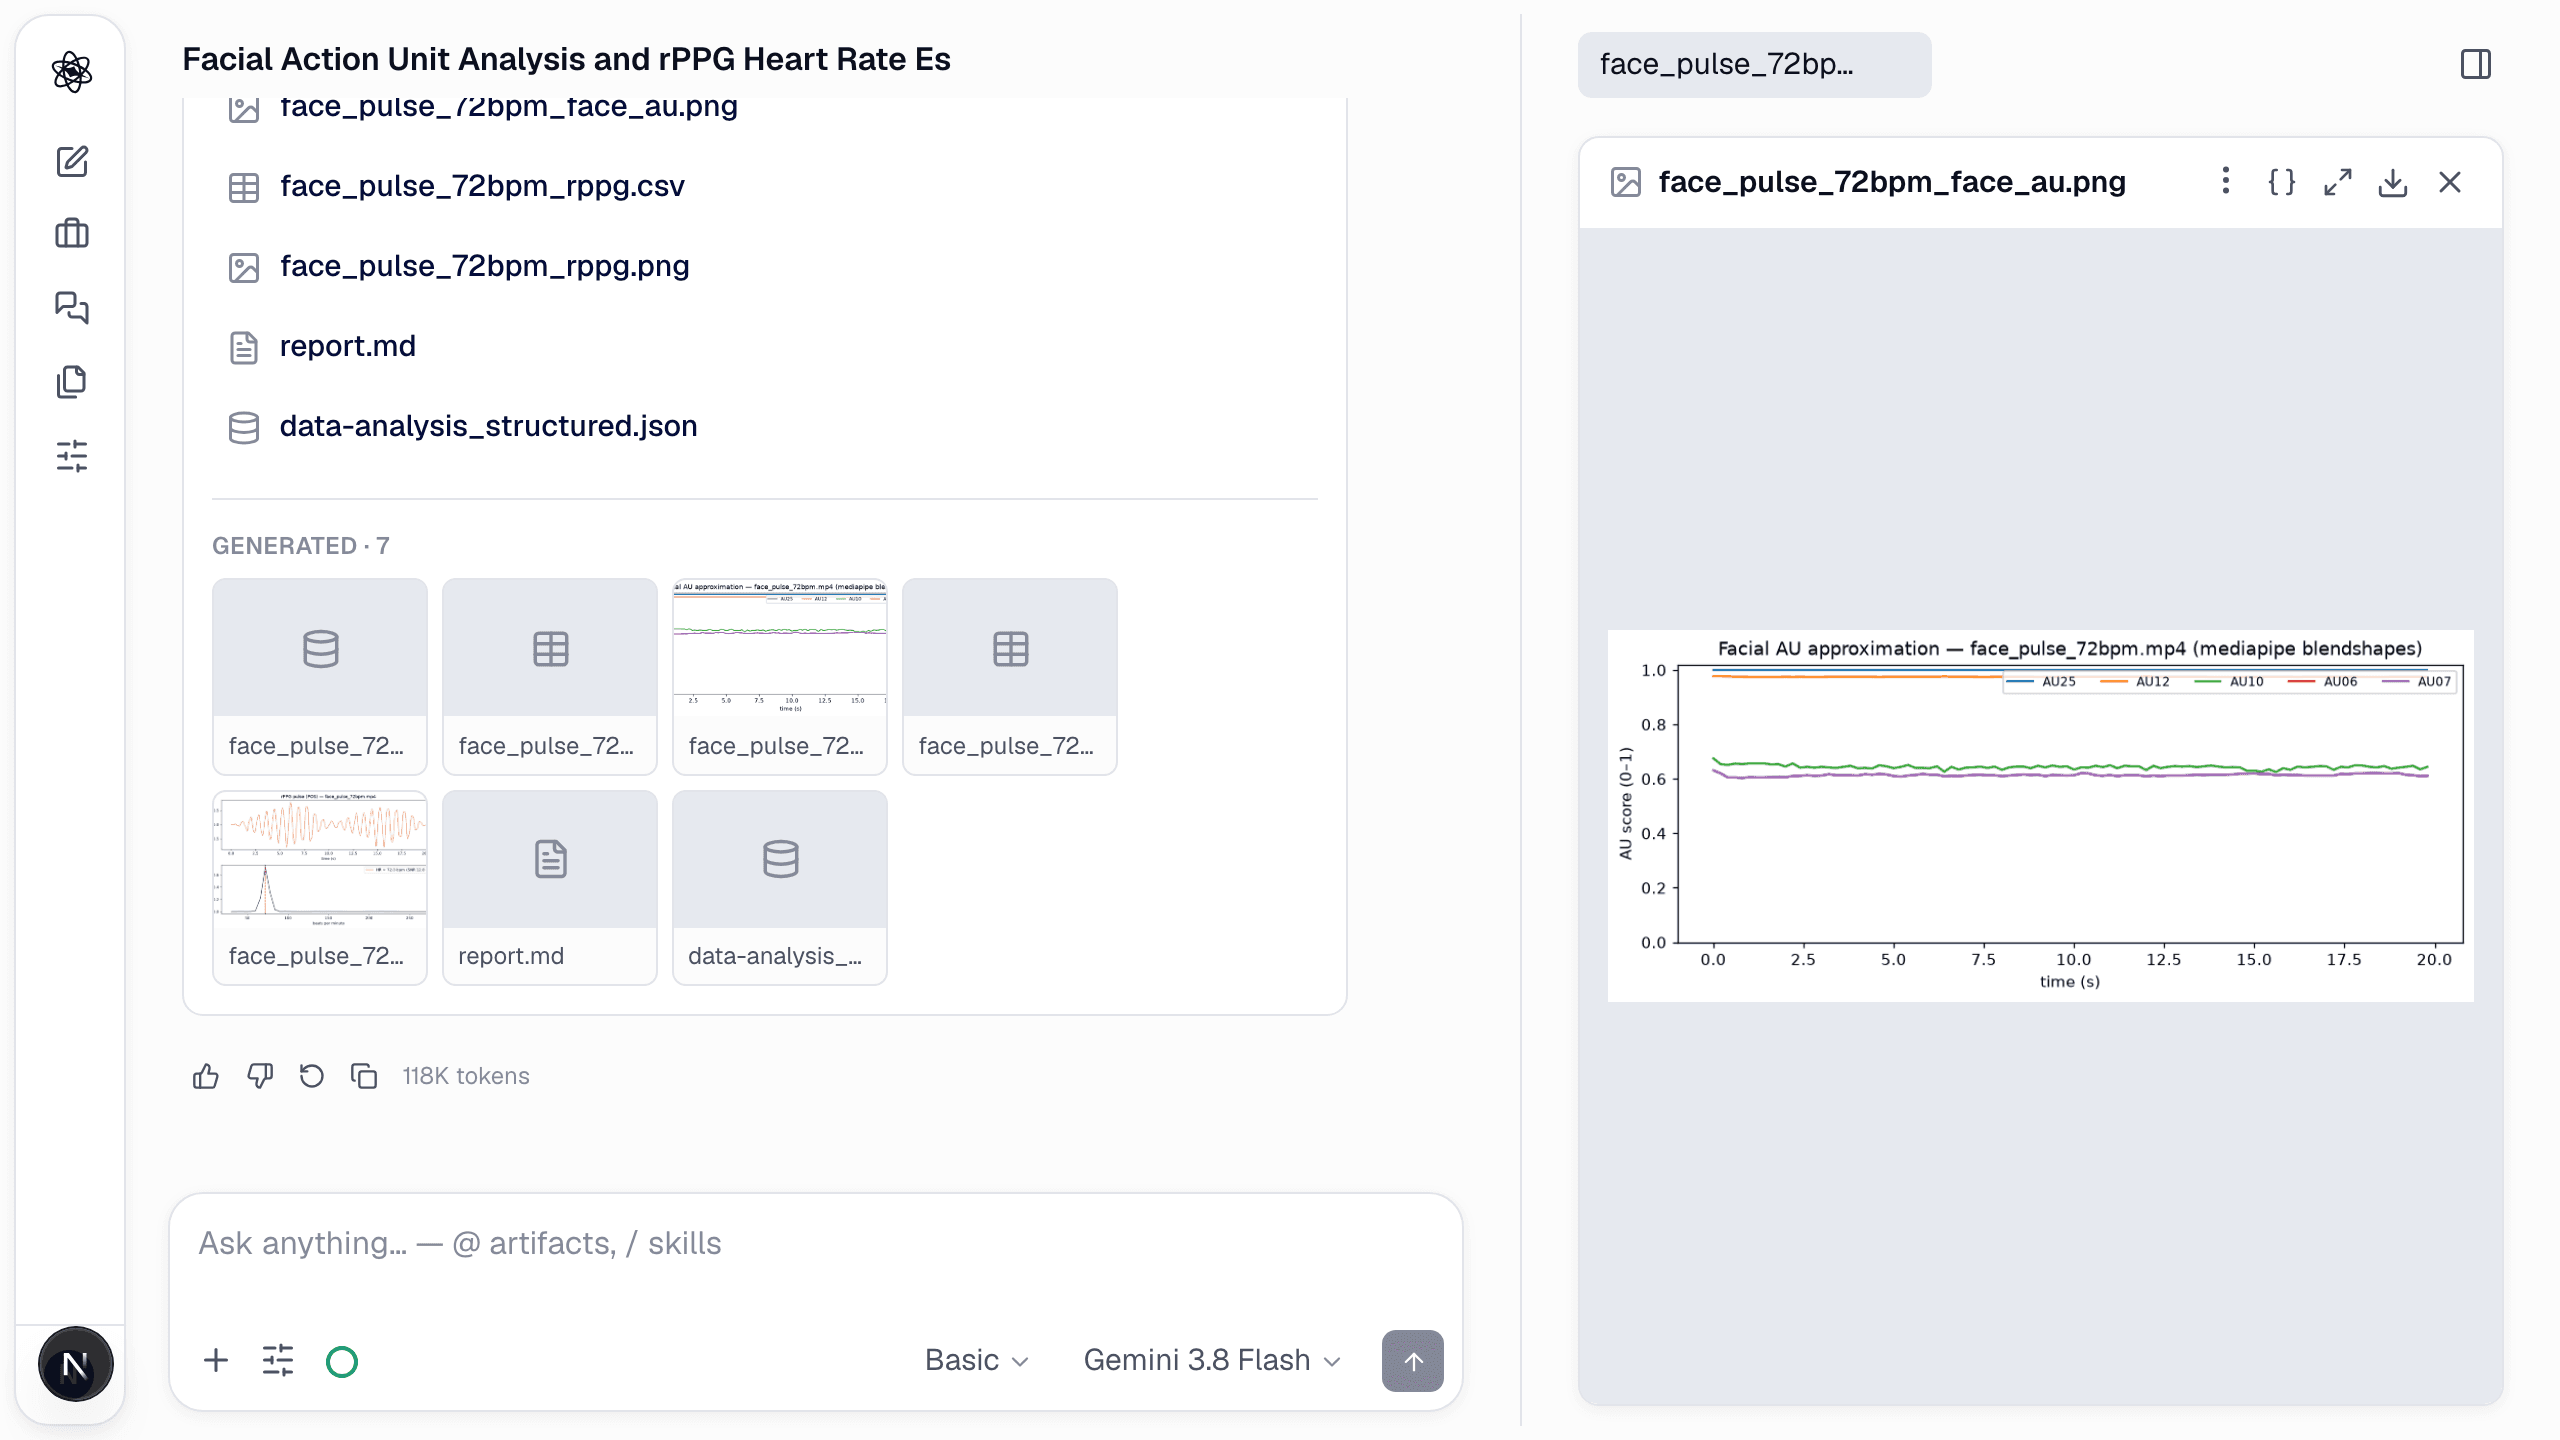
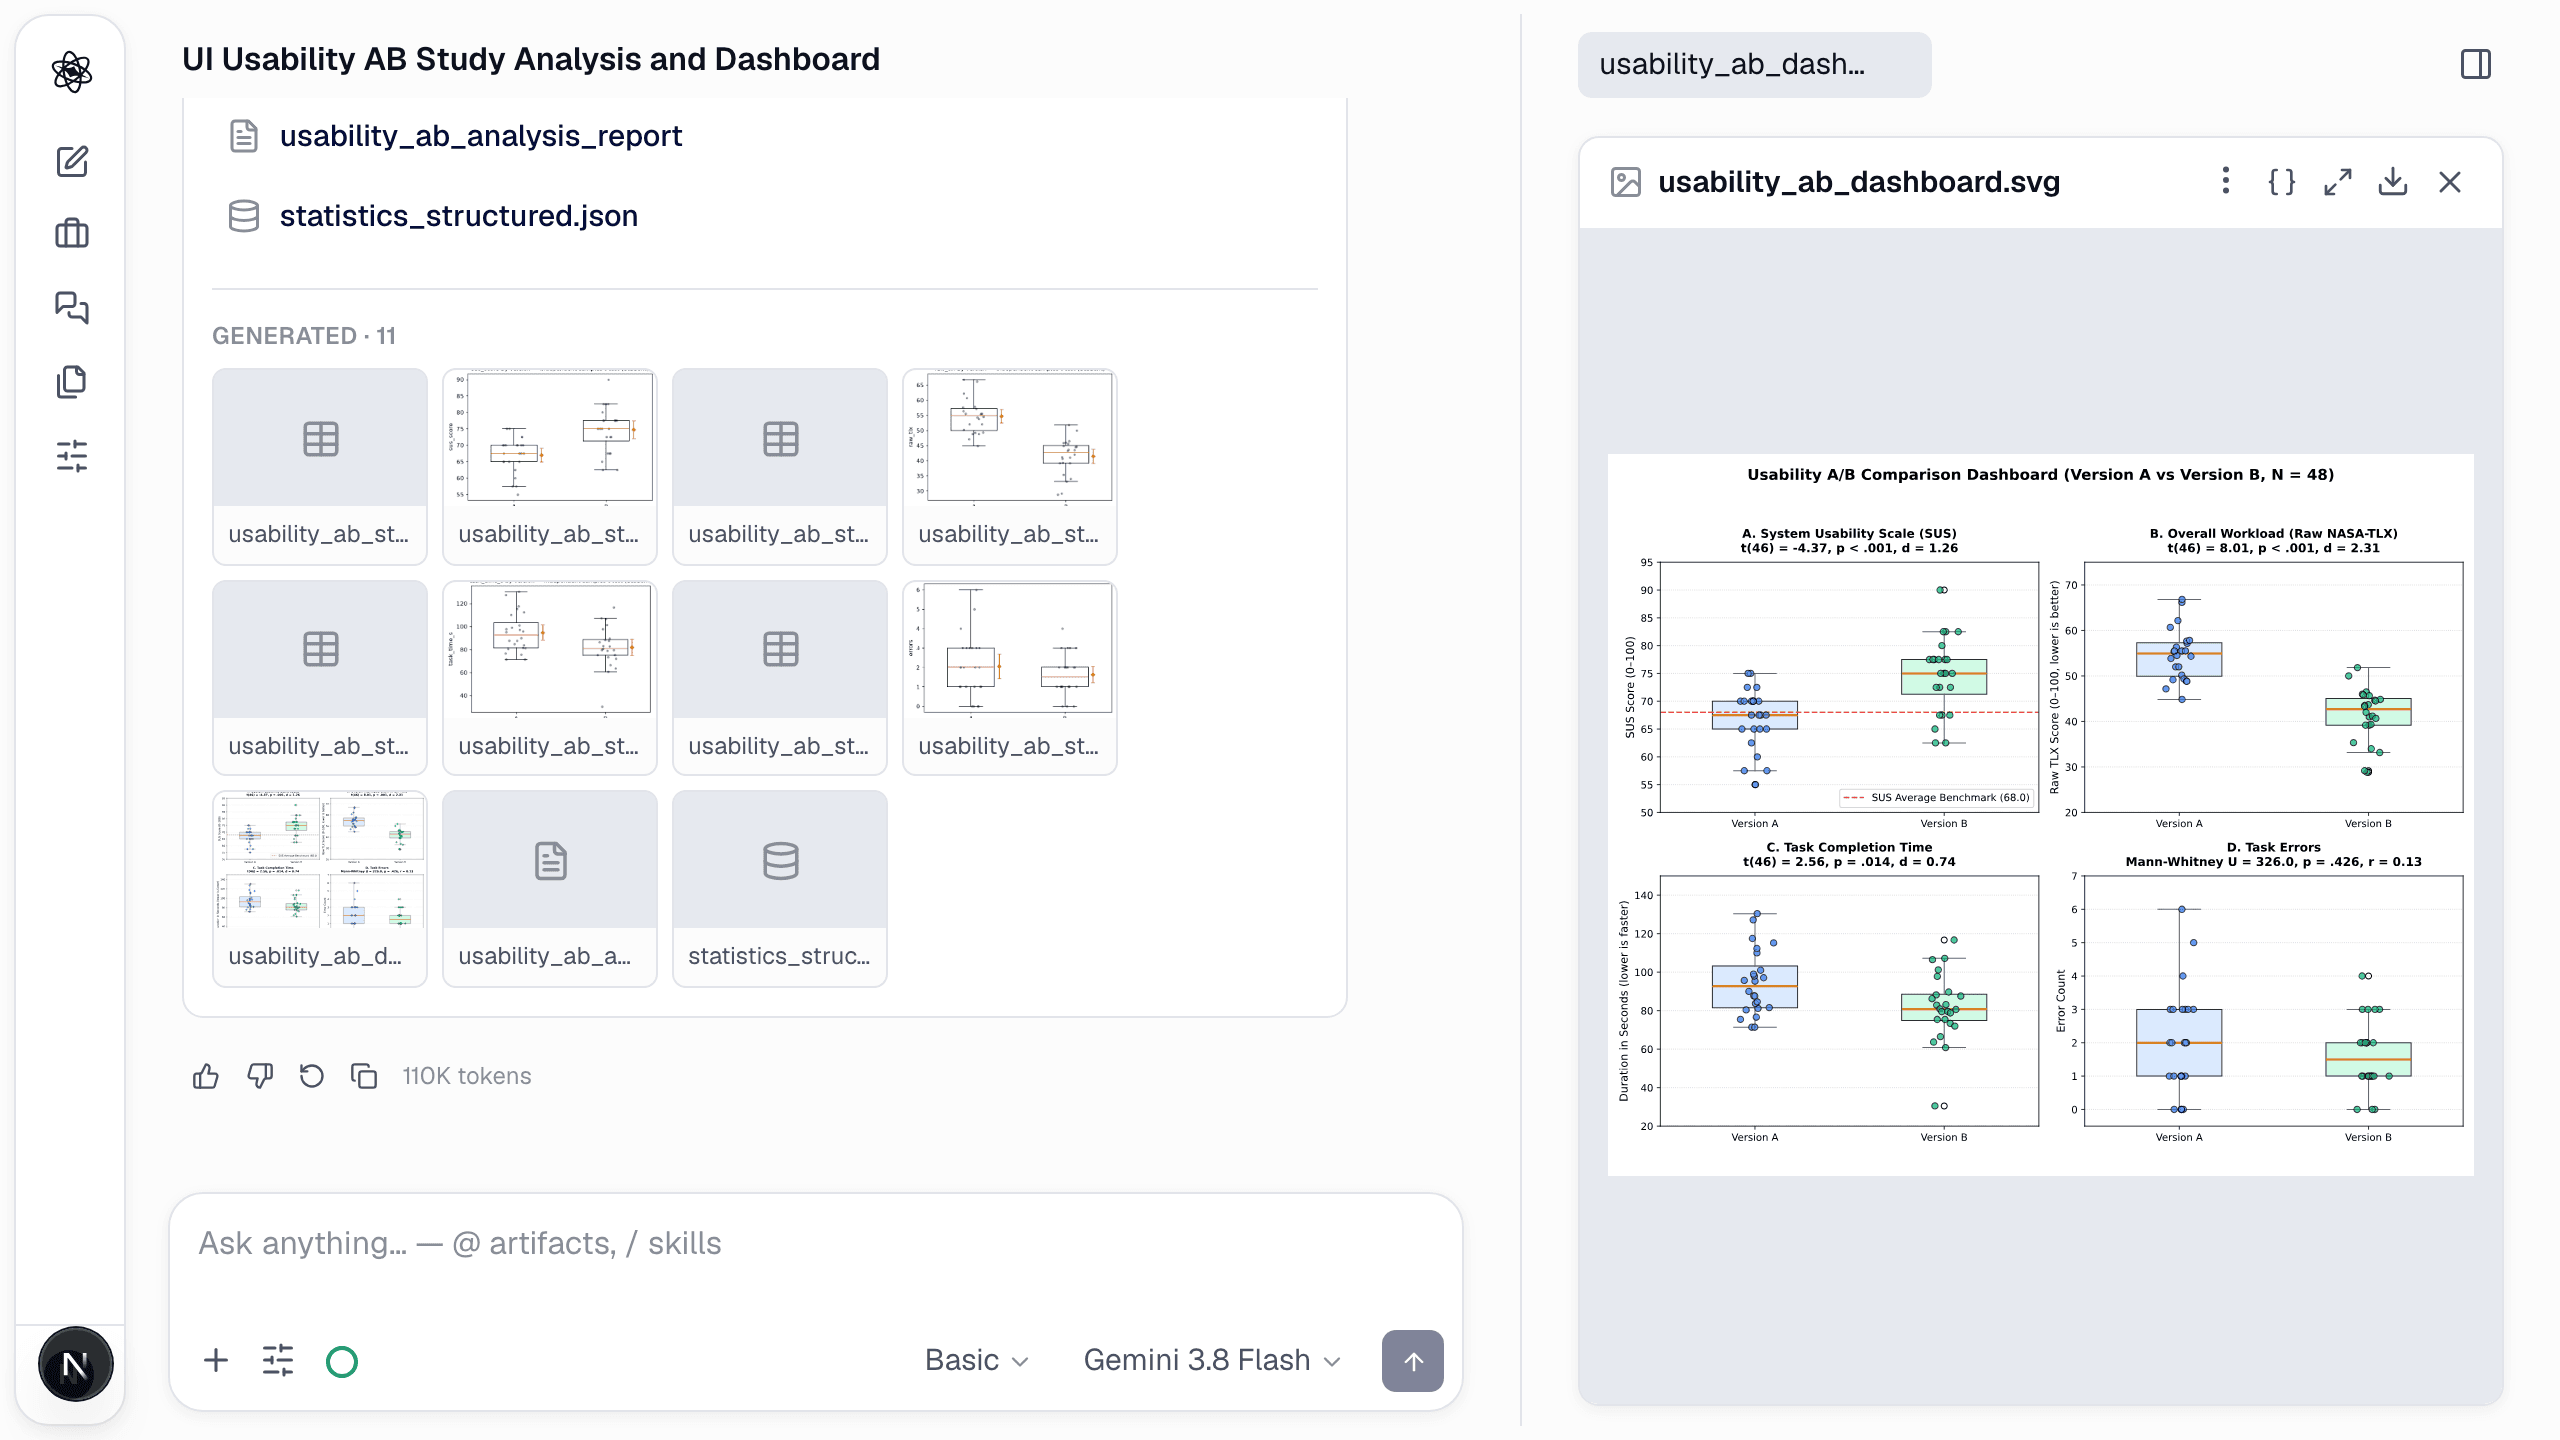
- The analysis report (Markdown) and a structured AnalysisReport (JSON).
- Plots and tables as artifacts, each with its Reproducibility panel (code, data, seed).
Tips
- Say what the columns mean; the plan gets better and the report names the variables correctly.
- For hypothesis tests with assumption audits and power, follow with /stats — the file is already there.