Kansei — emotion — engineering asks a precise question: which physical attributes of a design produce which felt impressions? The classic tools are the semantic differential and Hayashi's quantification theory, and both are tedious by hand. Neutropic runs them from one message. The screenshots are from one real session on four chair designs rated by 60 participants (sample data).
Step 1 — Attach the ratings and the design attributes
The data file holds the SD ratings (eight adjective pairs on 7-point scales) and, per design, the attributes you can actually change: seat material, colour, armrest, backrest height.
/analyze chair_semantic_differential.csv holds semantic differential ratings (8 adjective pairs, 7-point) of four chair designs (A-D) by 60 participants, plus each design's attributes (seat_material, color, armrest, backrest_height). Draw the SD profile plot of the four designs and run a Quantification Theory Type I analysis mapping the 'comfortable' and 'luxurious' impressions onto the design attributes.
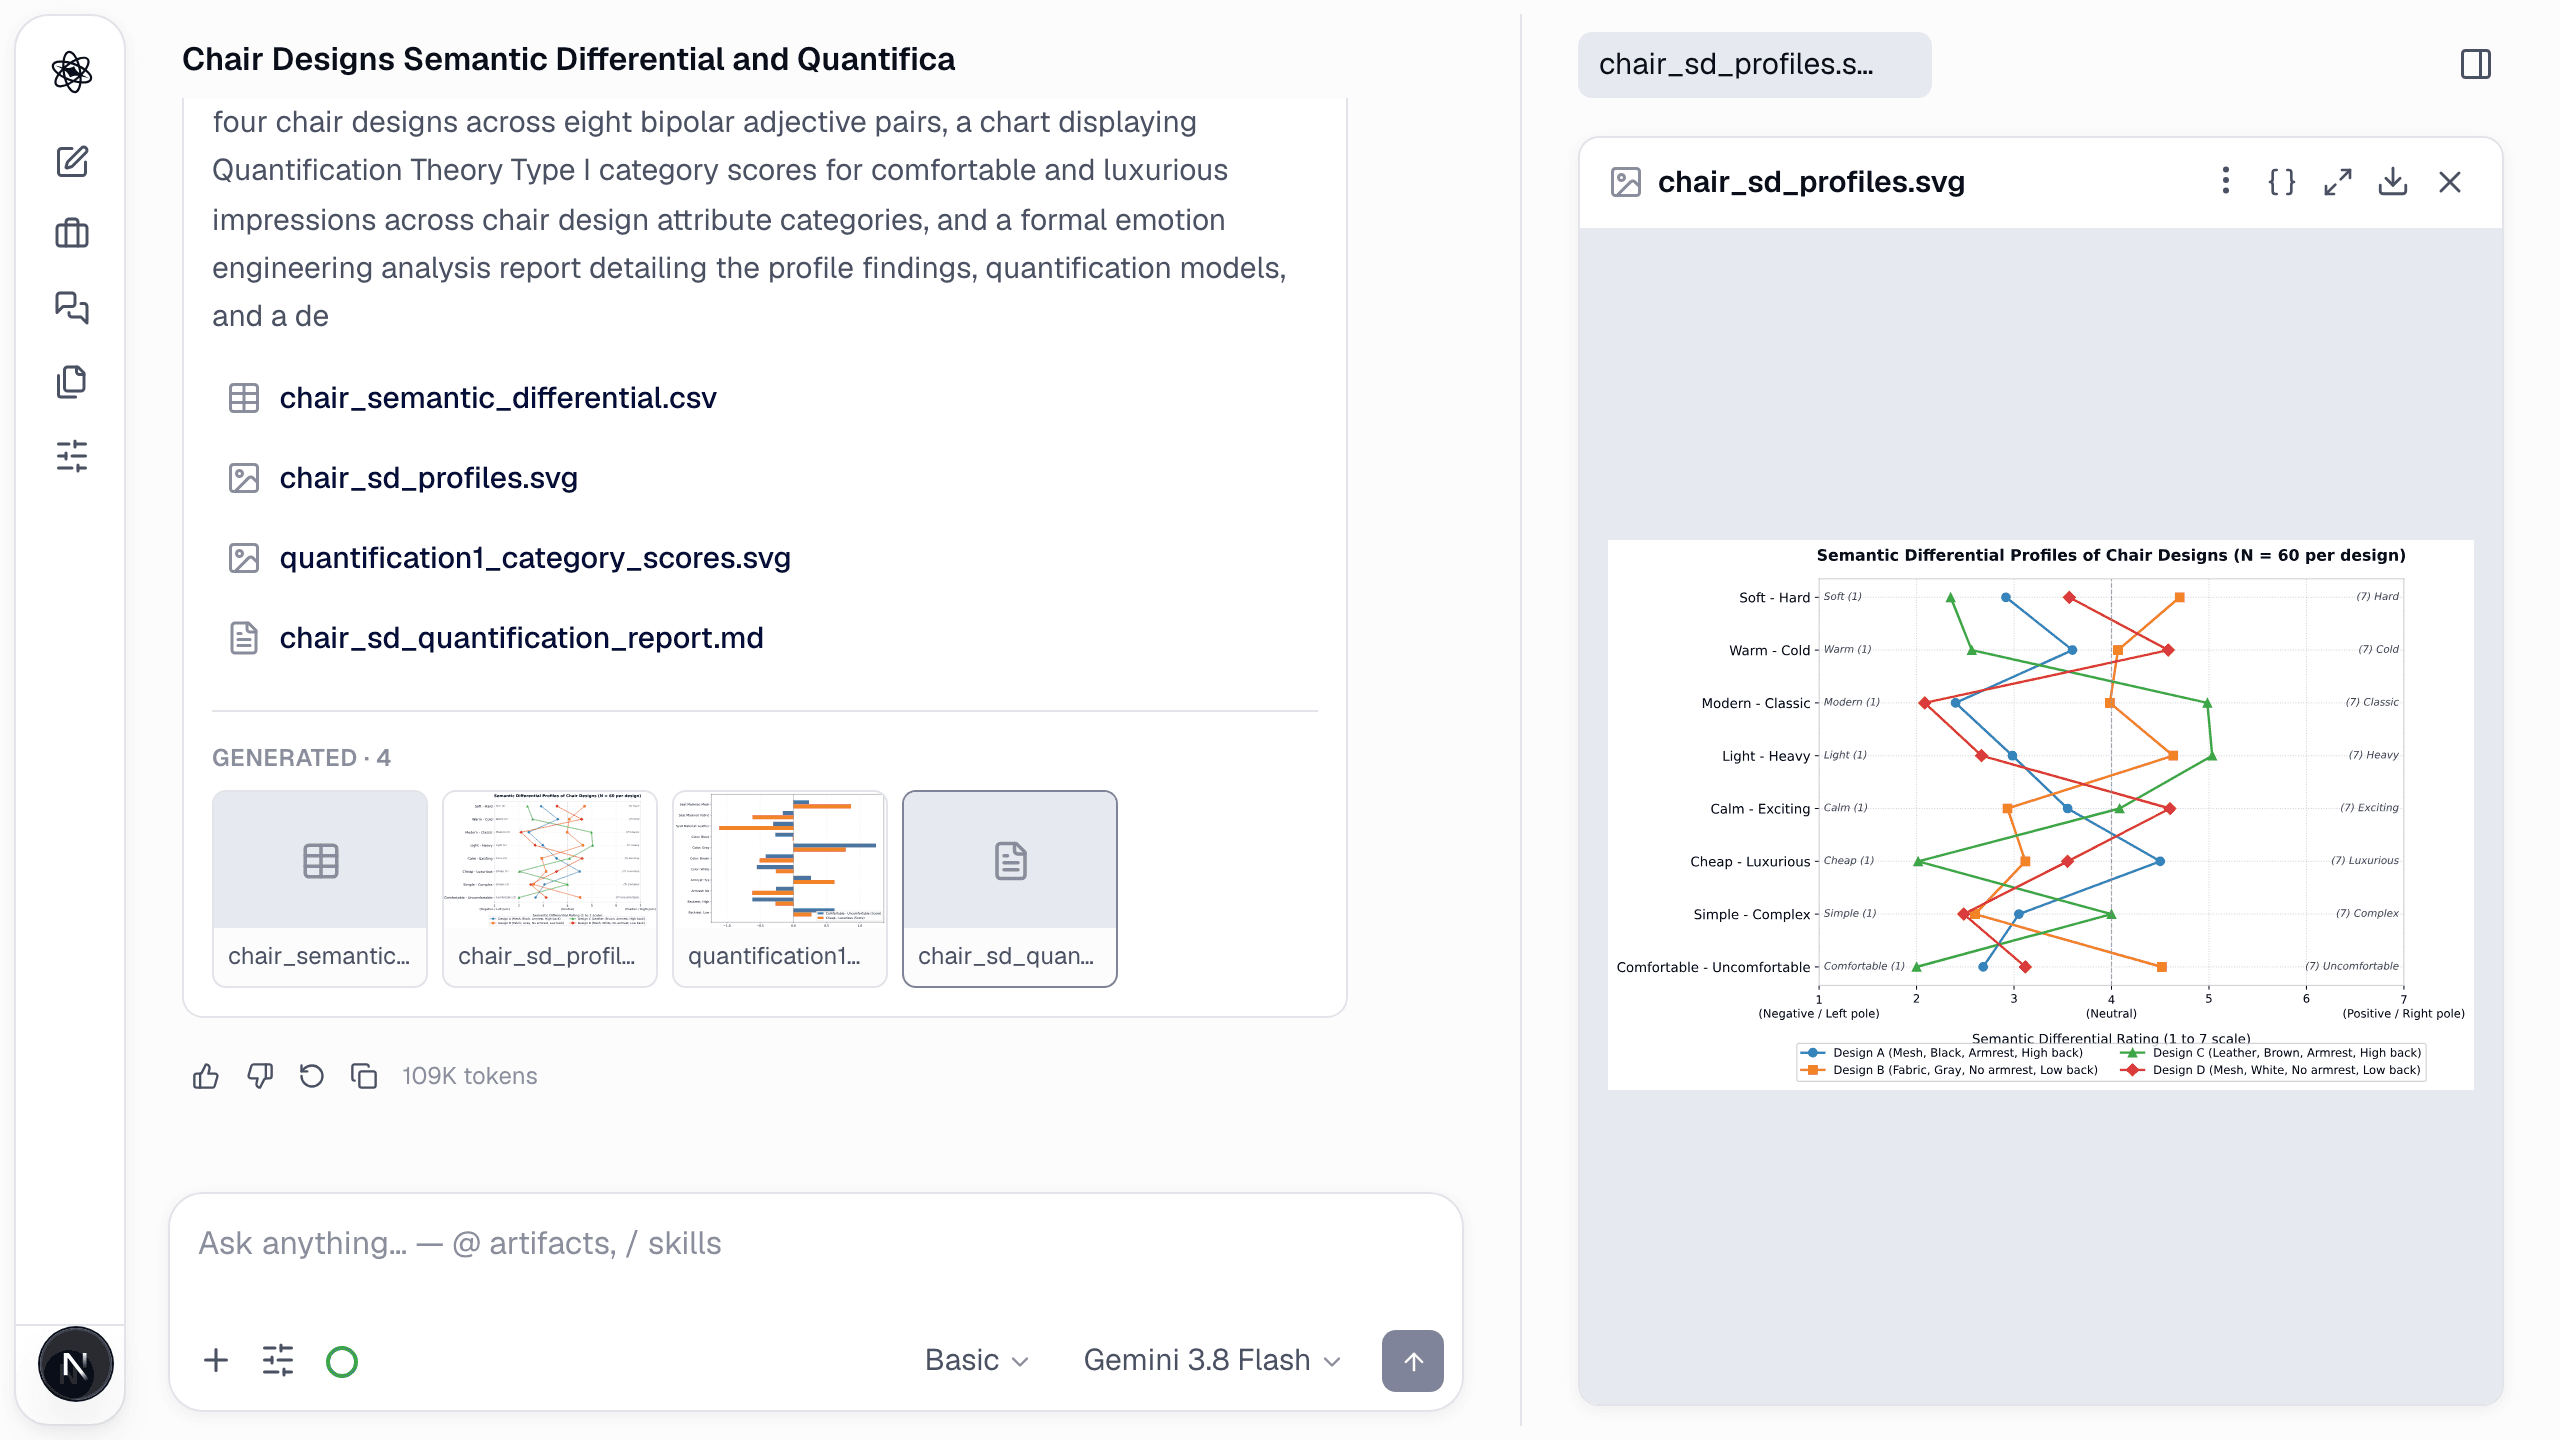
Step 2 — The semantic-differential profile
The profile plot puts the four designs on the same eight bipolar axes, so where they diverge — warm/cold, cheap/luxurious, comfortable/uncomfortable — is visible at a glance.
Step 3 — From impressions to design variables
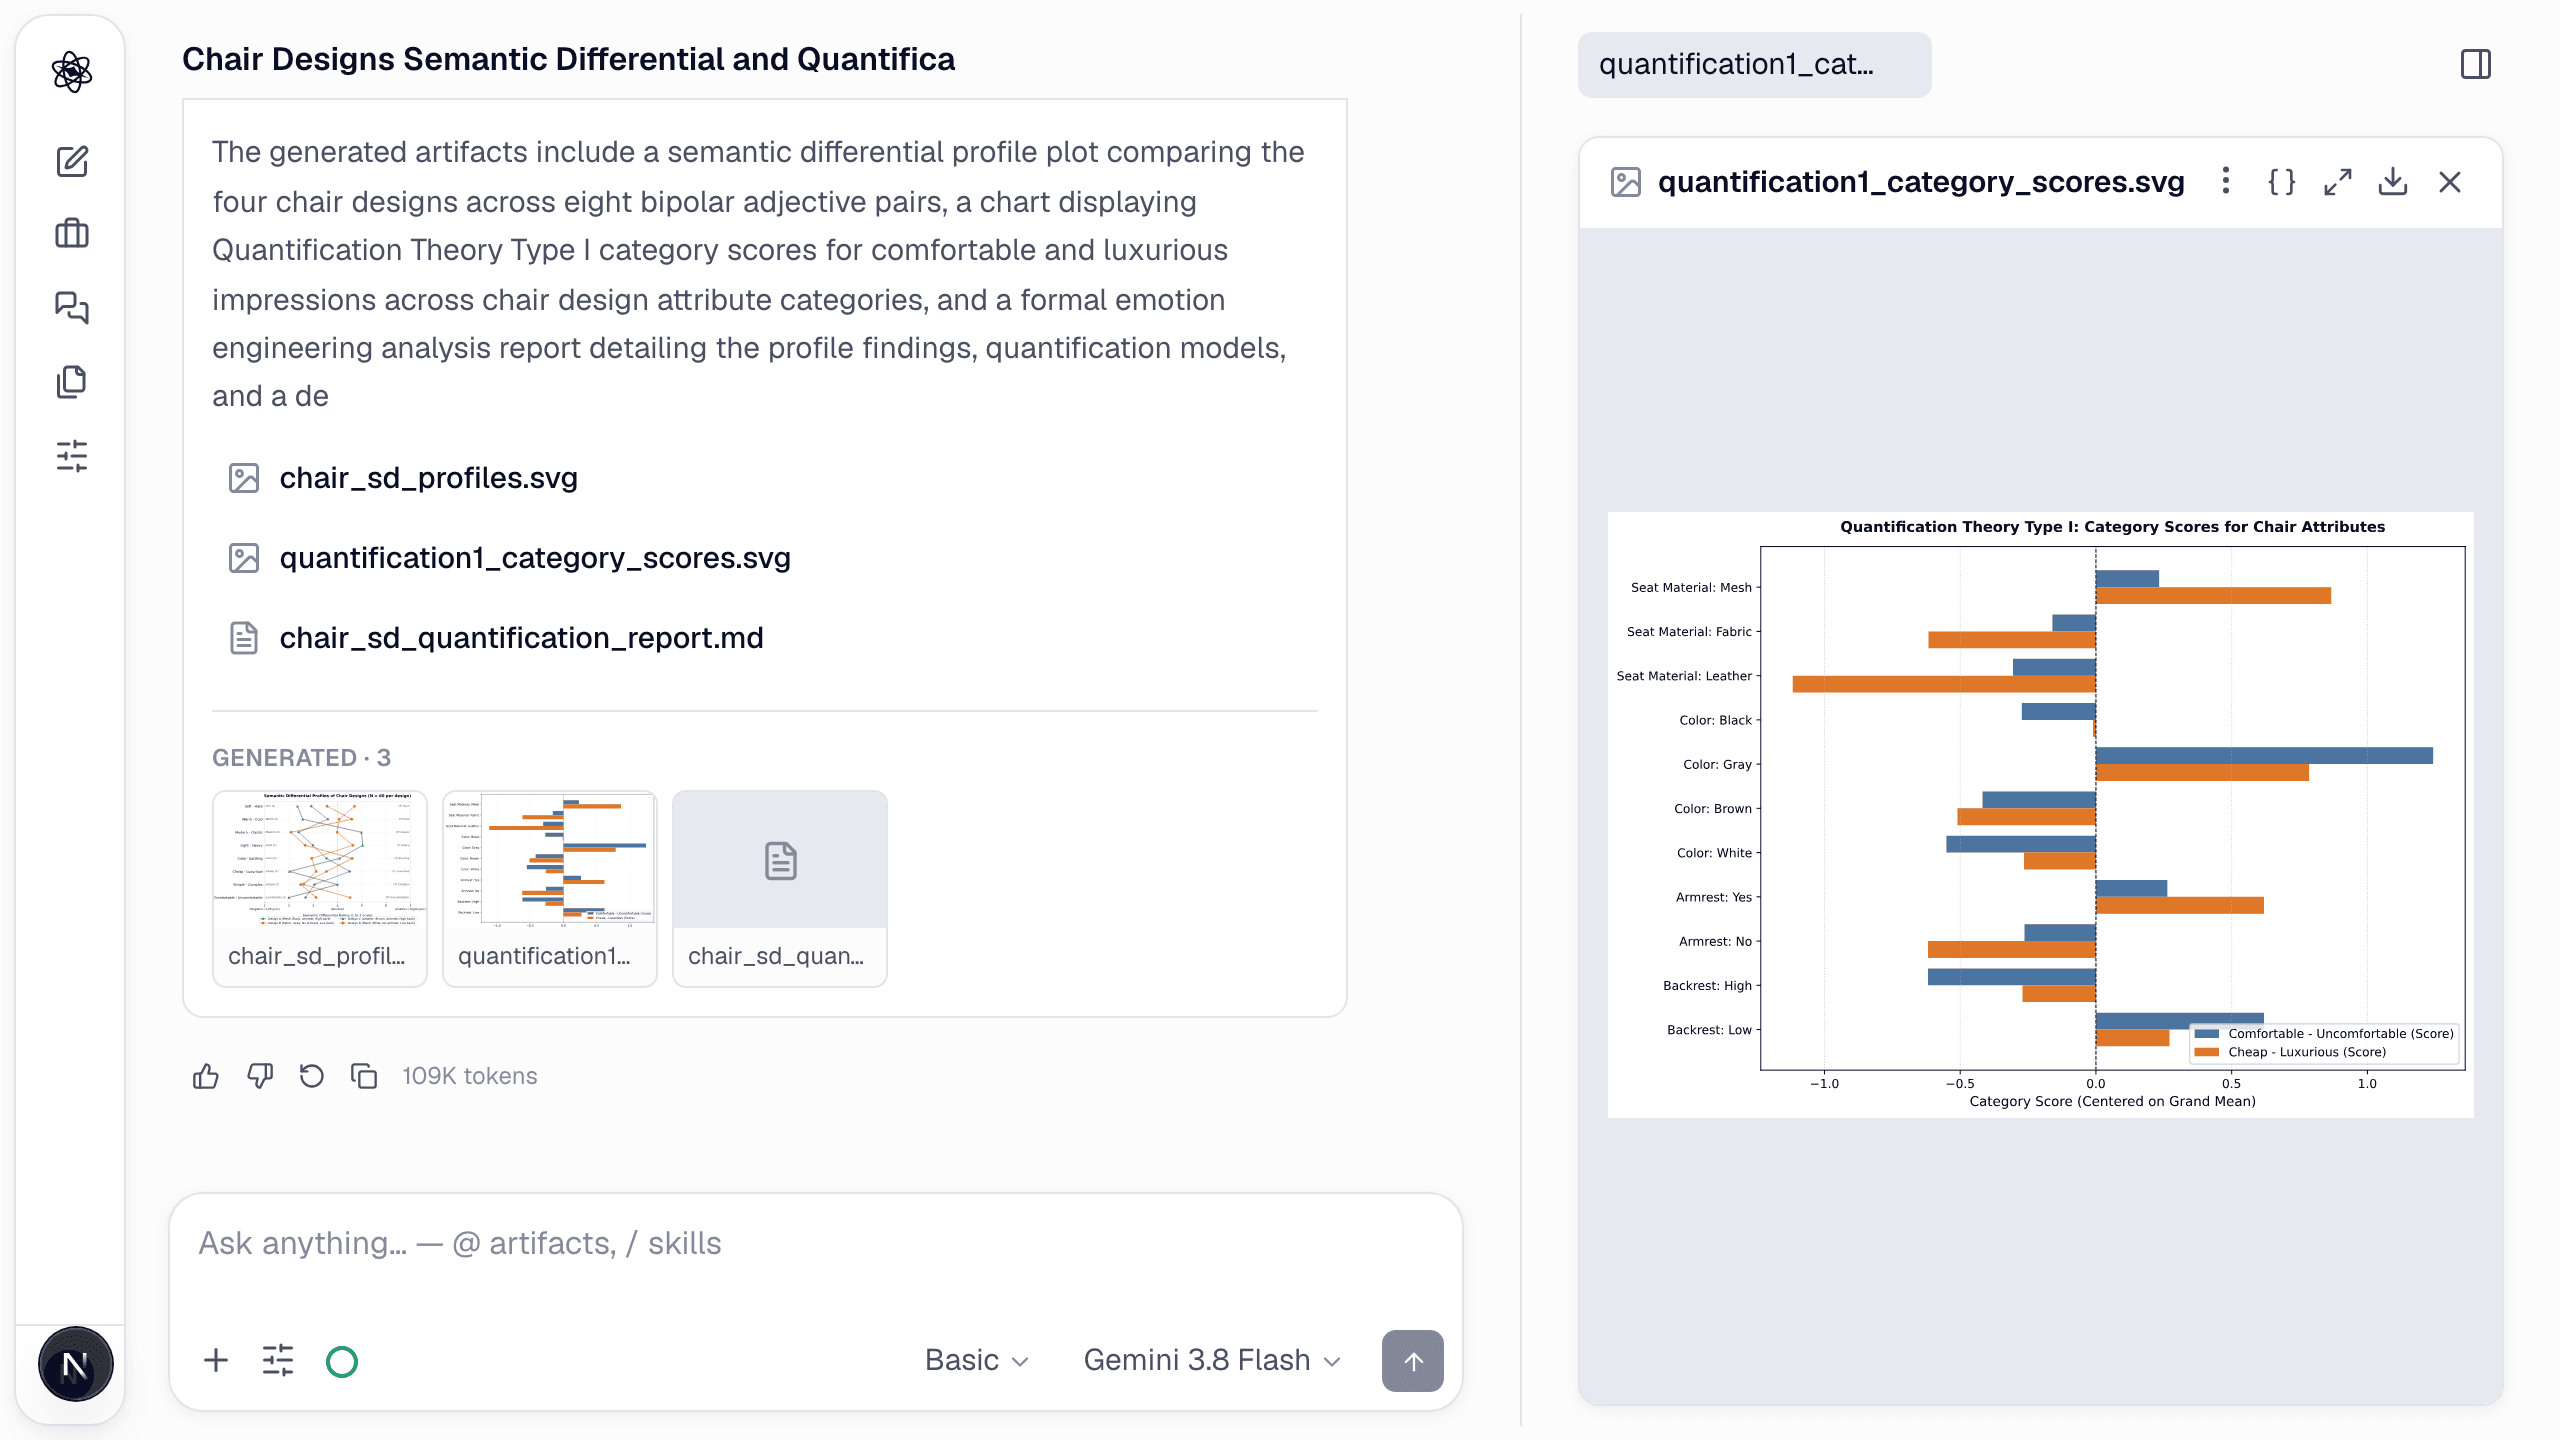
Quantification Theory Type I regresses each target impression on the categorical design attributes and returns category scores and partial correlations: which material, which colour, armrest or not, moves "comfortable" and "luxurious" — and by how much.
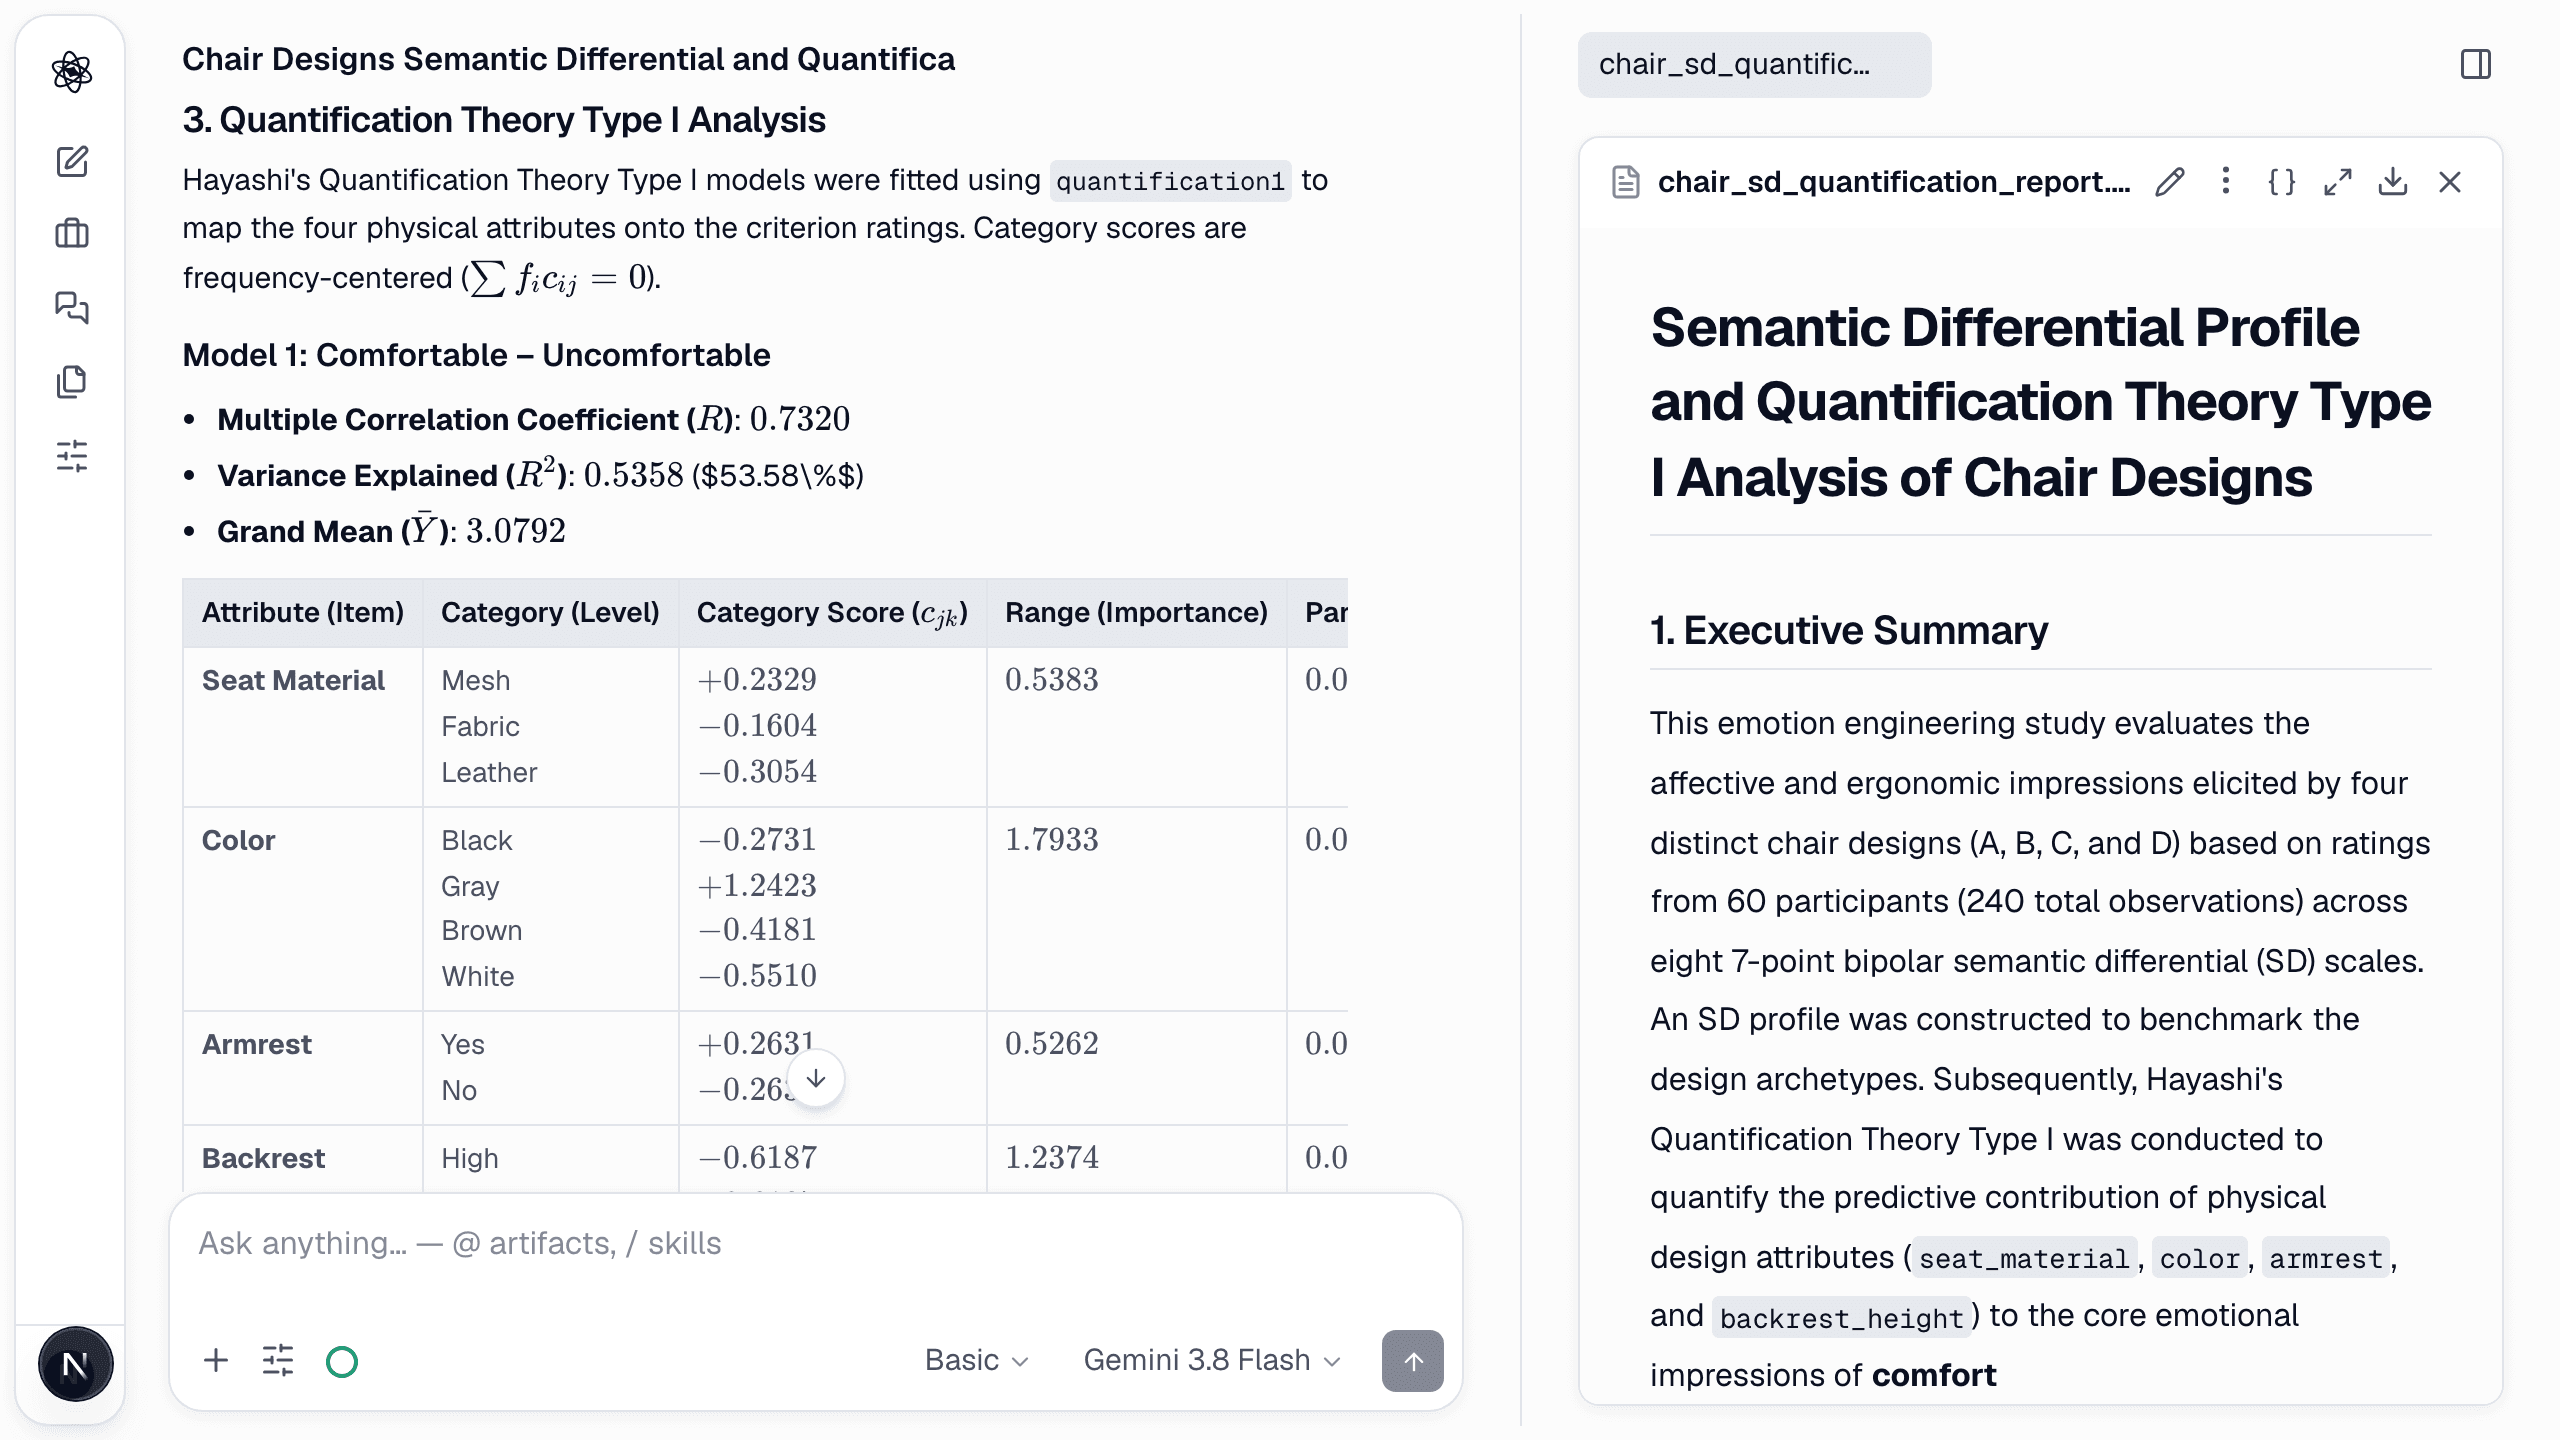
Step 4 — A report you can hand to the design team
The report explains the profile findings, the quantification models and the balance of the design set — with the caveats a small design set implies — so the recommendation ("mesh seat, high backrest, with armrests") comes with the numbers behind it.
Also native
- Conjoint analysis for trade-offs between attributes.
- Factor analysis of the SD scales to recover the underlying affective dimensions.
- Physiological complements — facial expression, EDA, HRV — aligned with the rating moments when recordings exist.
Every number traceable
As everywhere in Neutropic, the figures and tables carry the code and data that produced them, and a review agent checks the model assumptions before the recommendation reaches the design review.