One study, start to finish, in one chat
This is a real Neutropic session, shown step by step: a researcher asks whether HRV biofeedback reduces perceived stress, reviews the literature, designs a trial, analyzes the trial data, runs the statistics, draws the figure and drafts the manuscript — six messages in the same chat. Every screenshot below is from that session (on sample data); nothing is mocked up.
Literature review
Start with the question, not with a folder of PDFs
/research Does heart rate variability (HRV) biofeedback reduce perceived stress in adults? Focus on randomized controlled trials and report effect sizes.
You type the question into a new chat with the /research command. If the scope is ambiguous, Neutropic first asks a short round of clarifying questions — source types, journal tier, time window — and you can skip them with “Skip the rest — search now”.
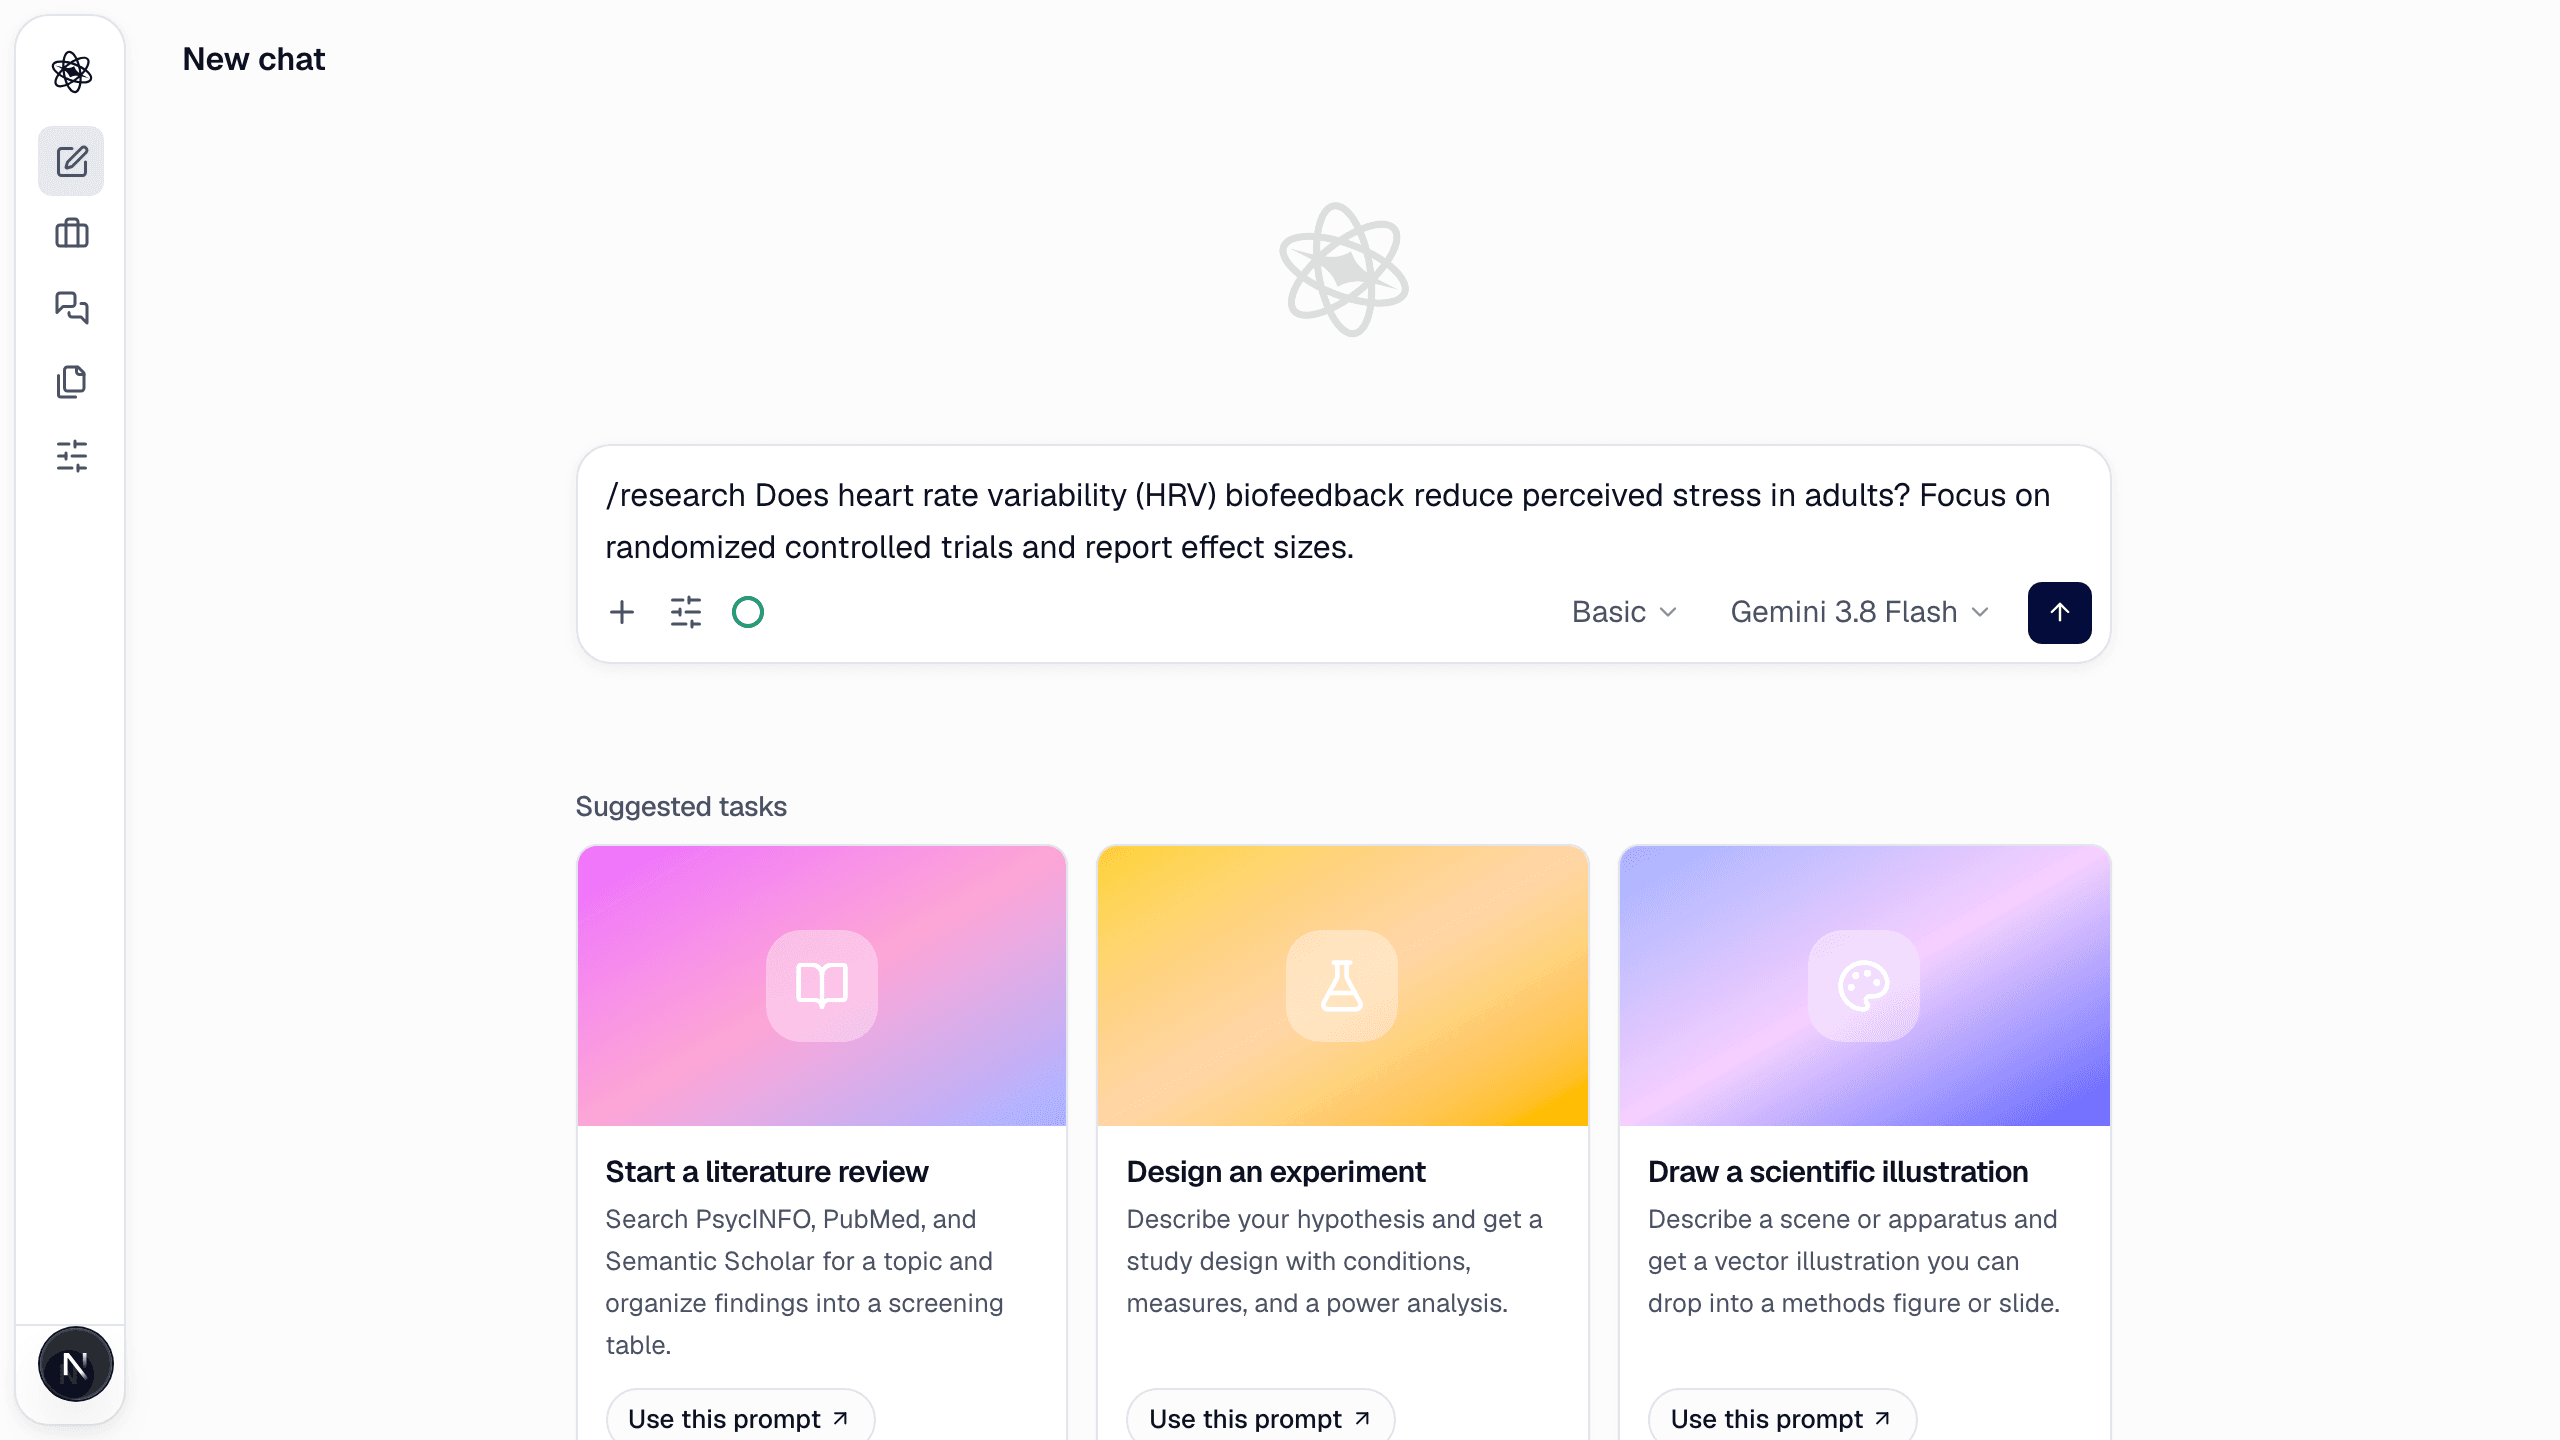
Then it fans out: several searches across OpenAlex, PubMed, Crossref, Semantic Scholar and Europe PMC, a few web searches for the meta-analyses it found by name, and a page read or two. Every search shows its query and result count as it runs, so you can see what was covered.
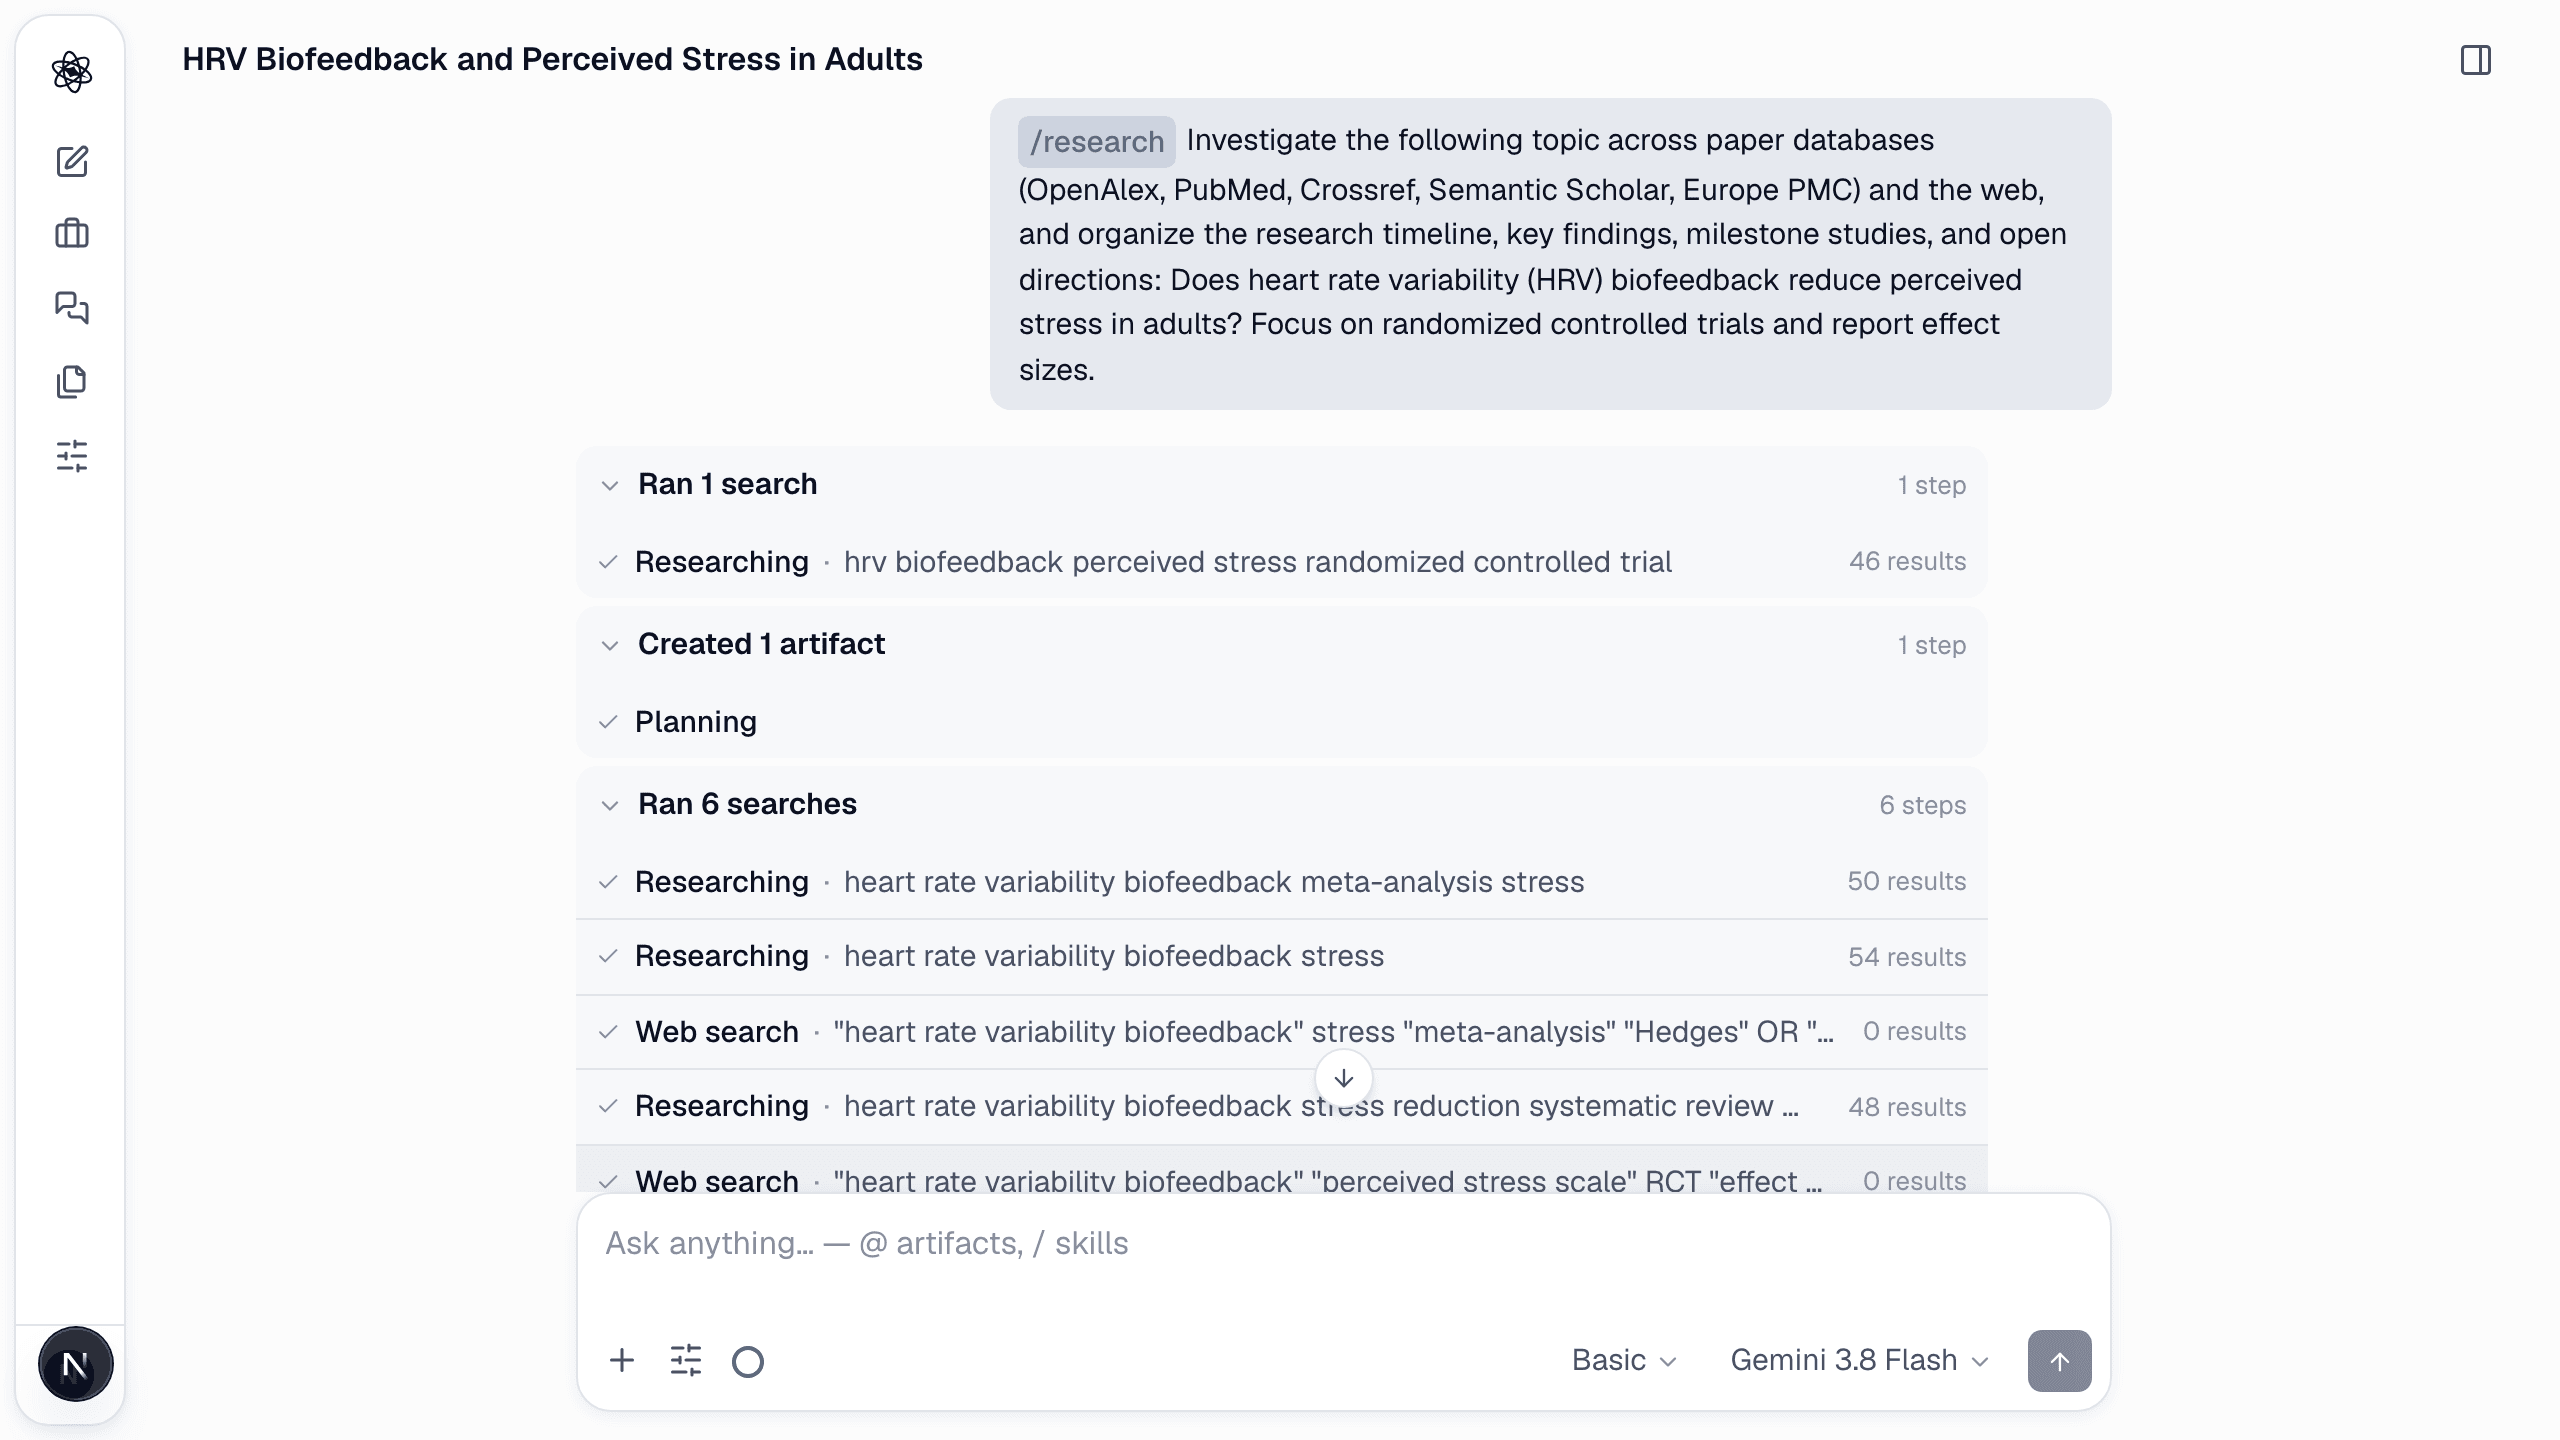
It finishes by writing a report where every sentence carries an [n] citation. Click a sentence to see which sources support it; a screening table, a sources-by-year chart, a citation graph and a research mind map are generated alongside.
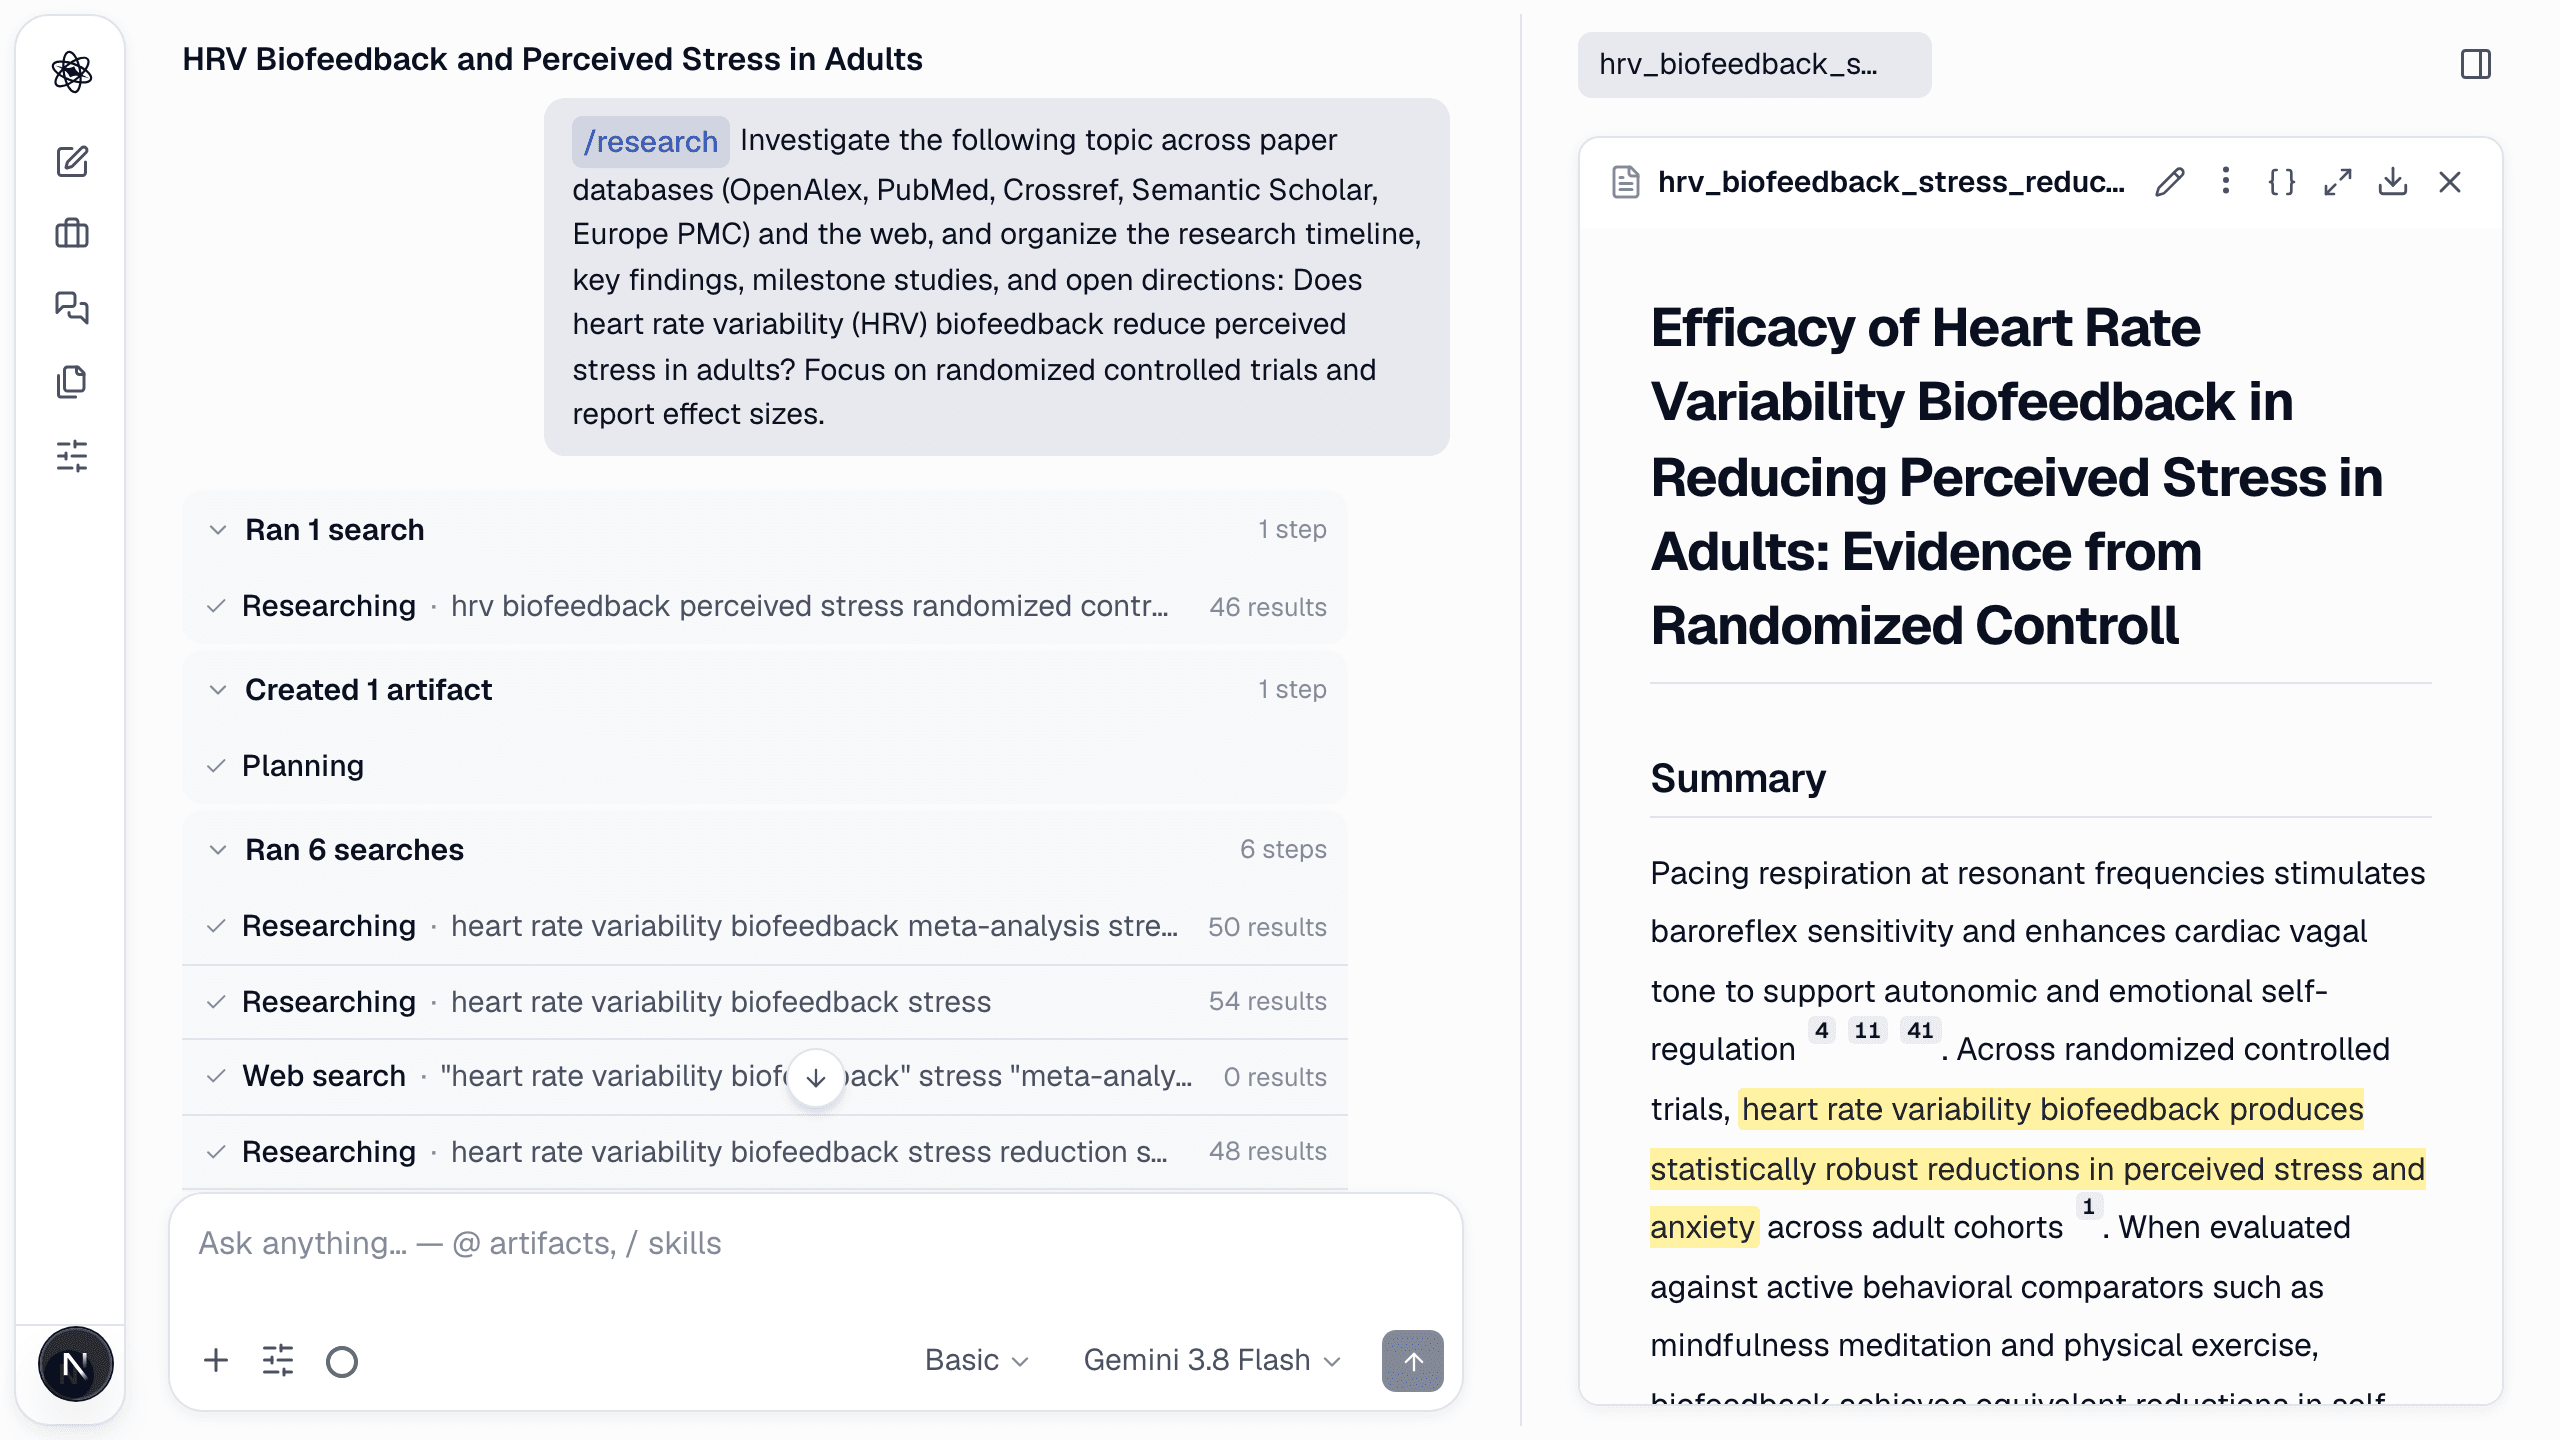
Tip · The first message sets the language of the whole session — ask in English and the report and the manuscript come back in English.
Research design
Turn the gap you found into a study you can defend
/experiment-design Design a two-arm randomized experiment testing whether a 4-week HRV biofeedback program lowers perceived stress (PSS-10) in university students compared with an active control. Include participants, measures, protocol flow, and a power analysis.
Same chat, next message. Because the literature is already in the session, the agent knows what “active control” usually means in this field — so it settles the control condition, how sessions are delivered and which secondary measures from what comparable trials do, and records each of those choices as an assumption in the design basis. Nothing to answer first.
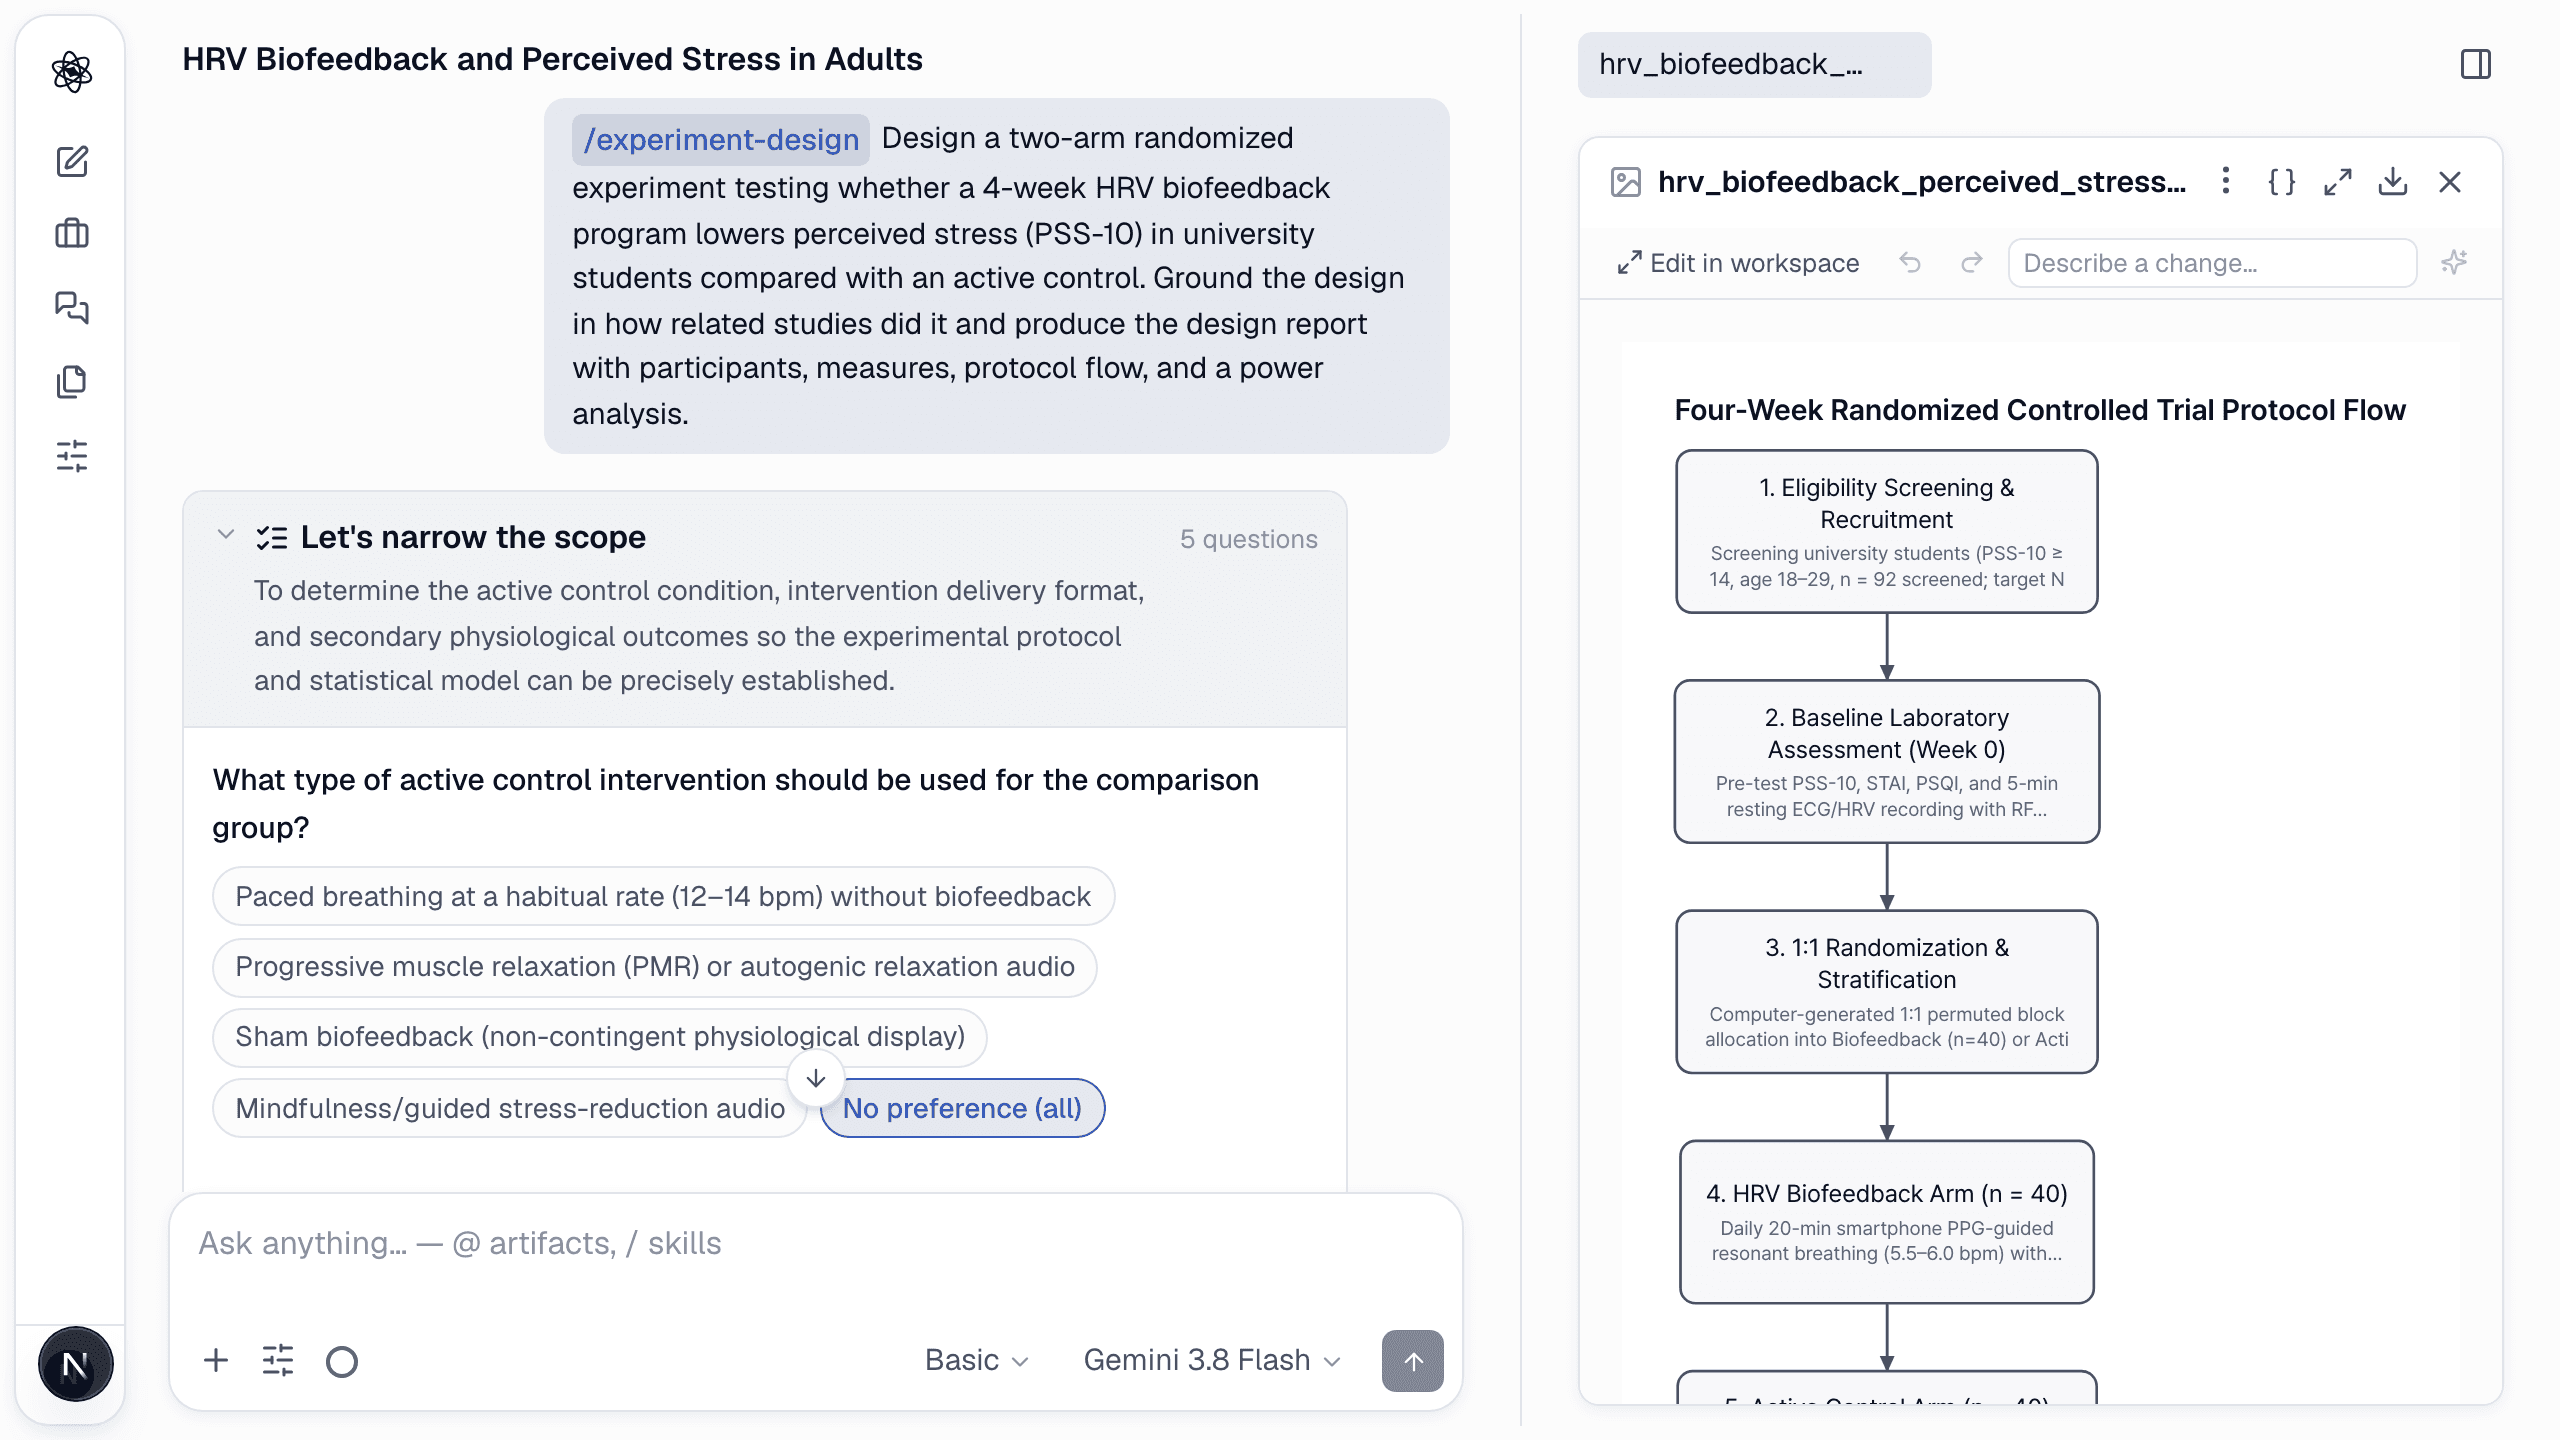
It then surveys how comparable trials designed theirs and writes a design report — goal, framework, participants, measures, constraints — with the reference study cited next to each choice.
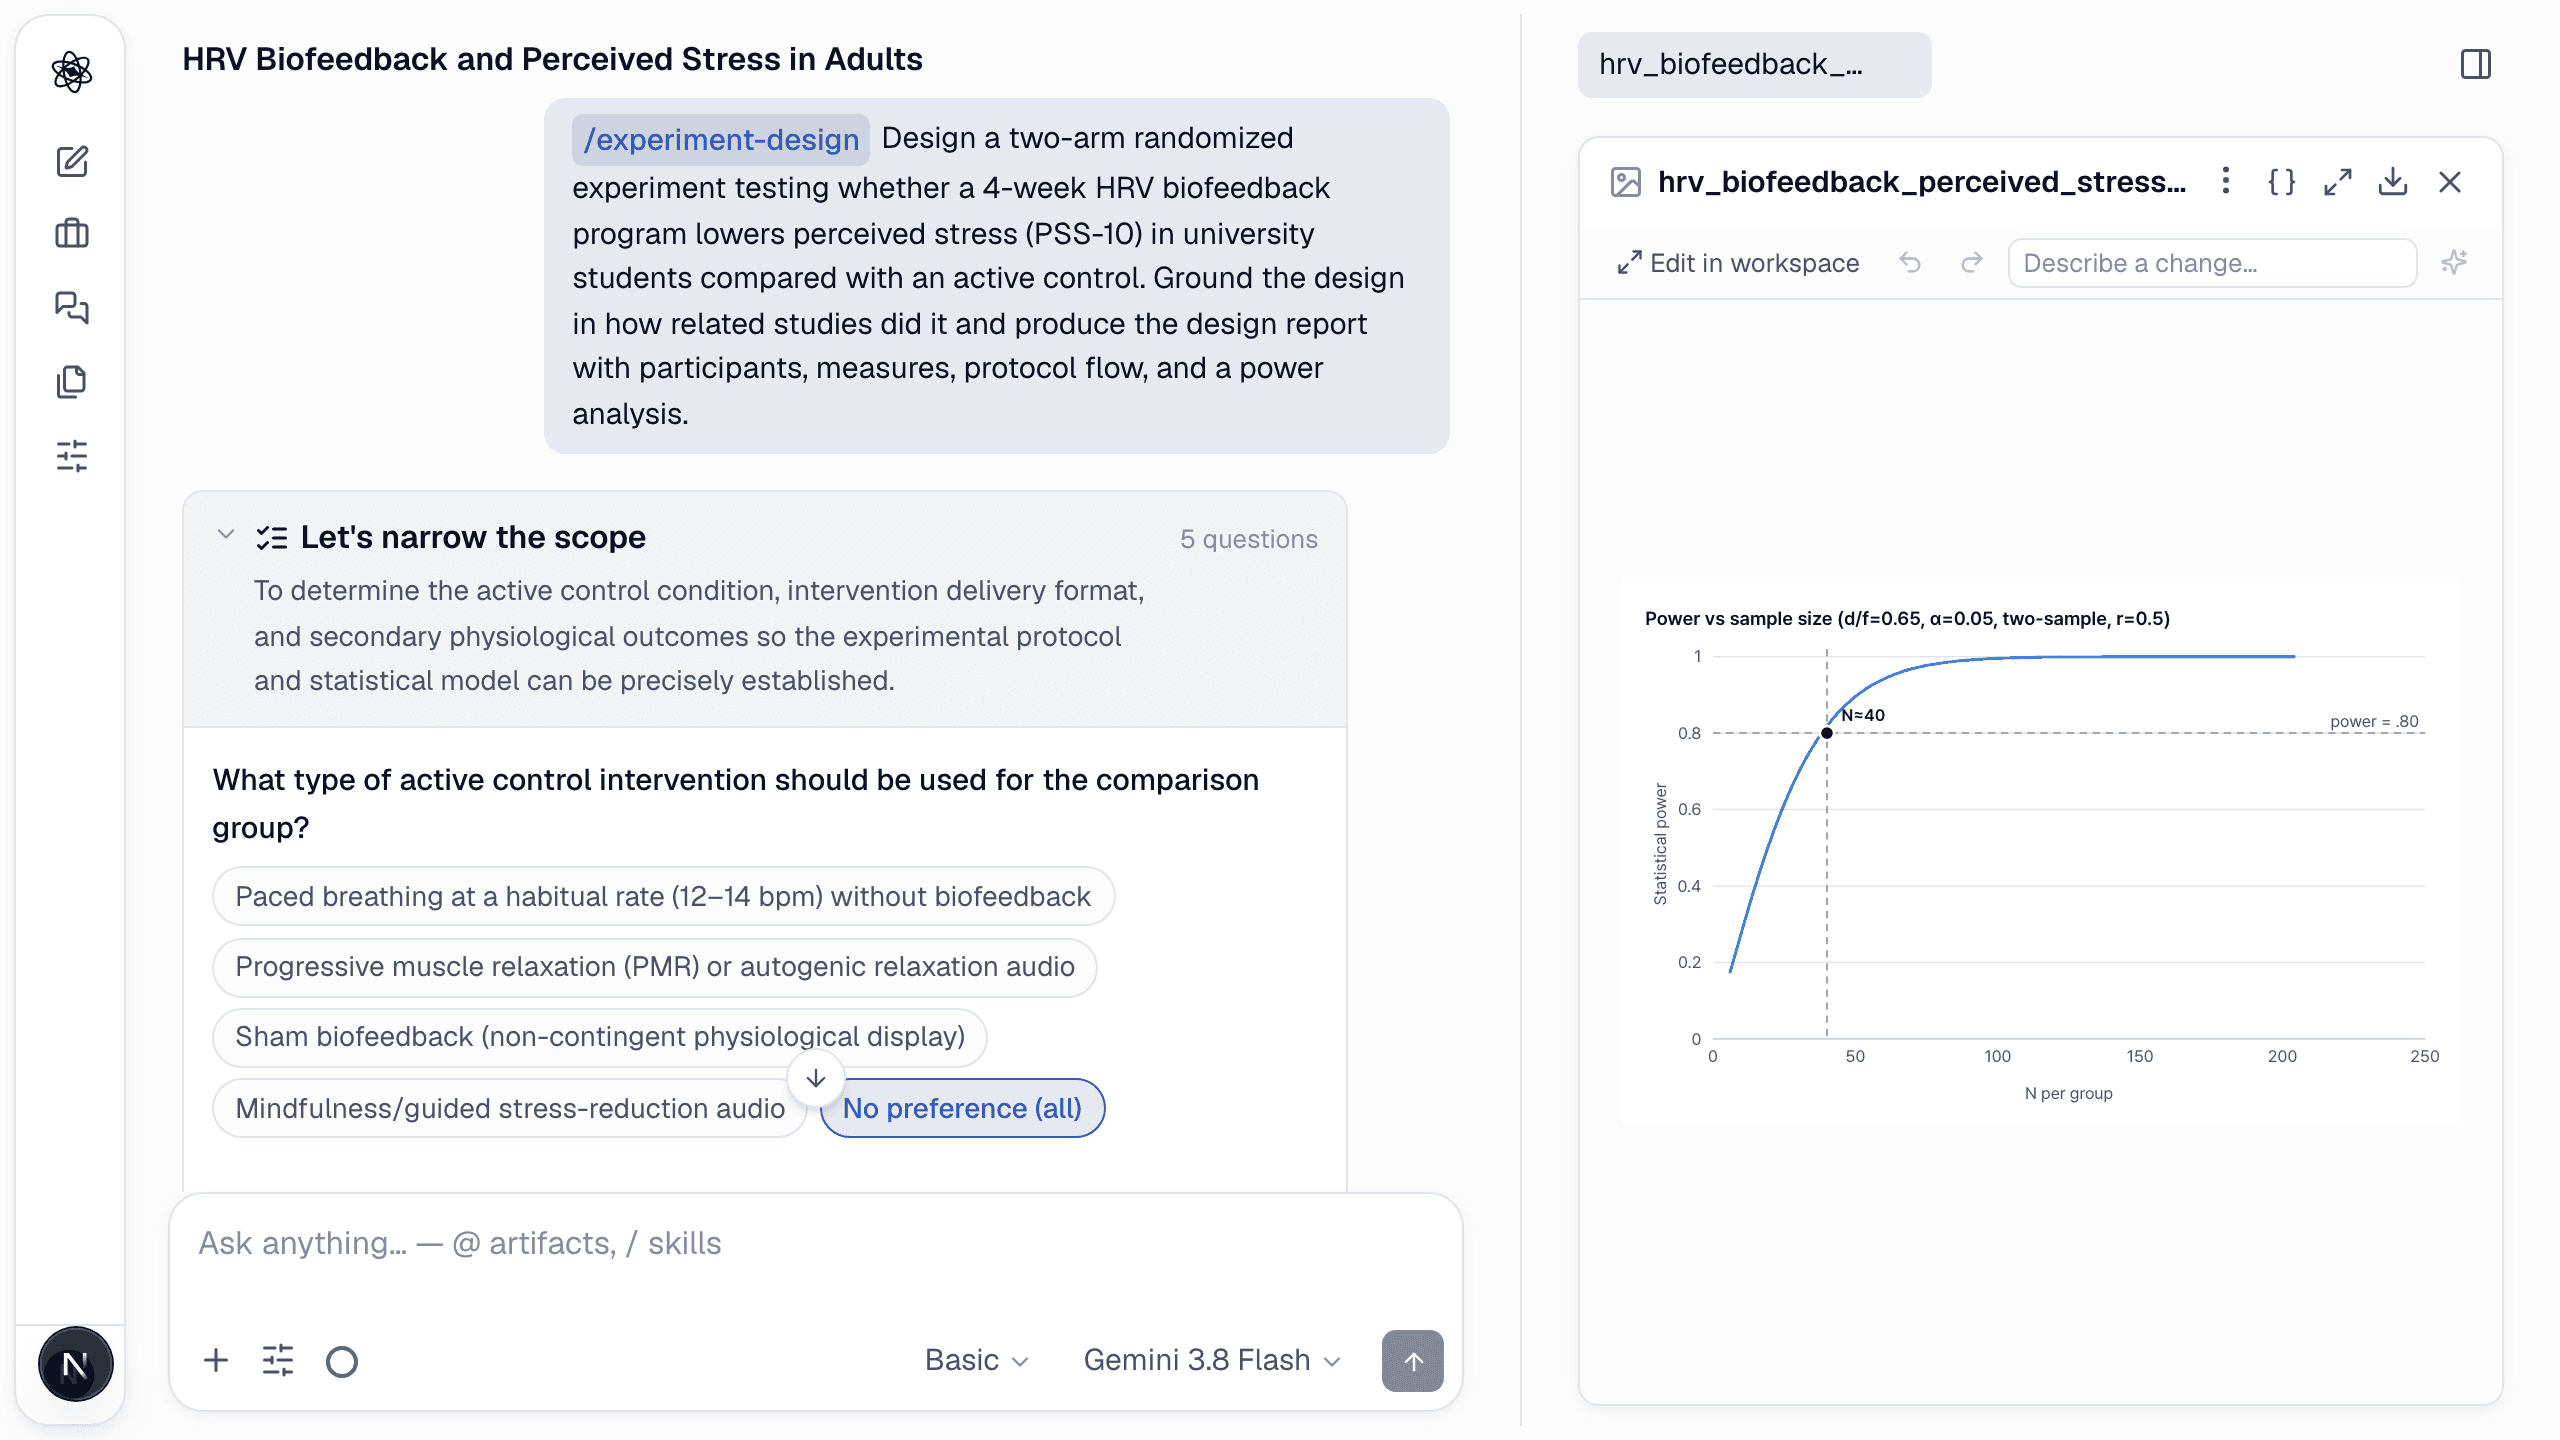
Three figures come with it: a protocol flow diagram, an expected-results chart and a power curve. In this run the curve shows that n = 64 per group reaches 80% power for d = 0.5.
Tip · Hand the design document to your IRB or to Qualtrics/PsychoPy as is — the rationale and the source for every choice are already in it.
Data analysis
Bring the data in once, then work by reference
/data-analysis Inspect the uploaded pss_trial.xlsx (two groups, PSS-10 pre/post). Check data quality and baseline balance, compute change scores, and deliver a reproducible analysis report with plots.
You attach the spreadsheet with the + button (Excel, CSV, recordings and biosignal exports all work) and describe what you want checked. The file stays in the session, so later steps refer to it by name.
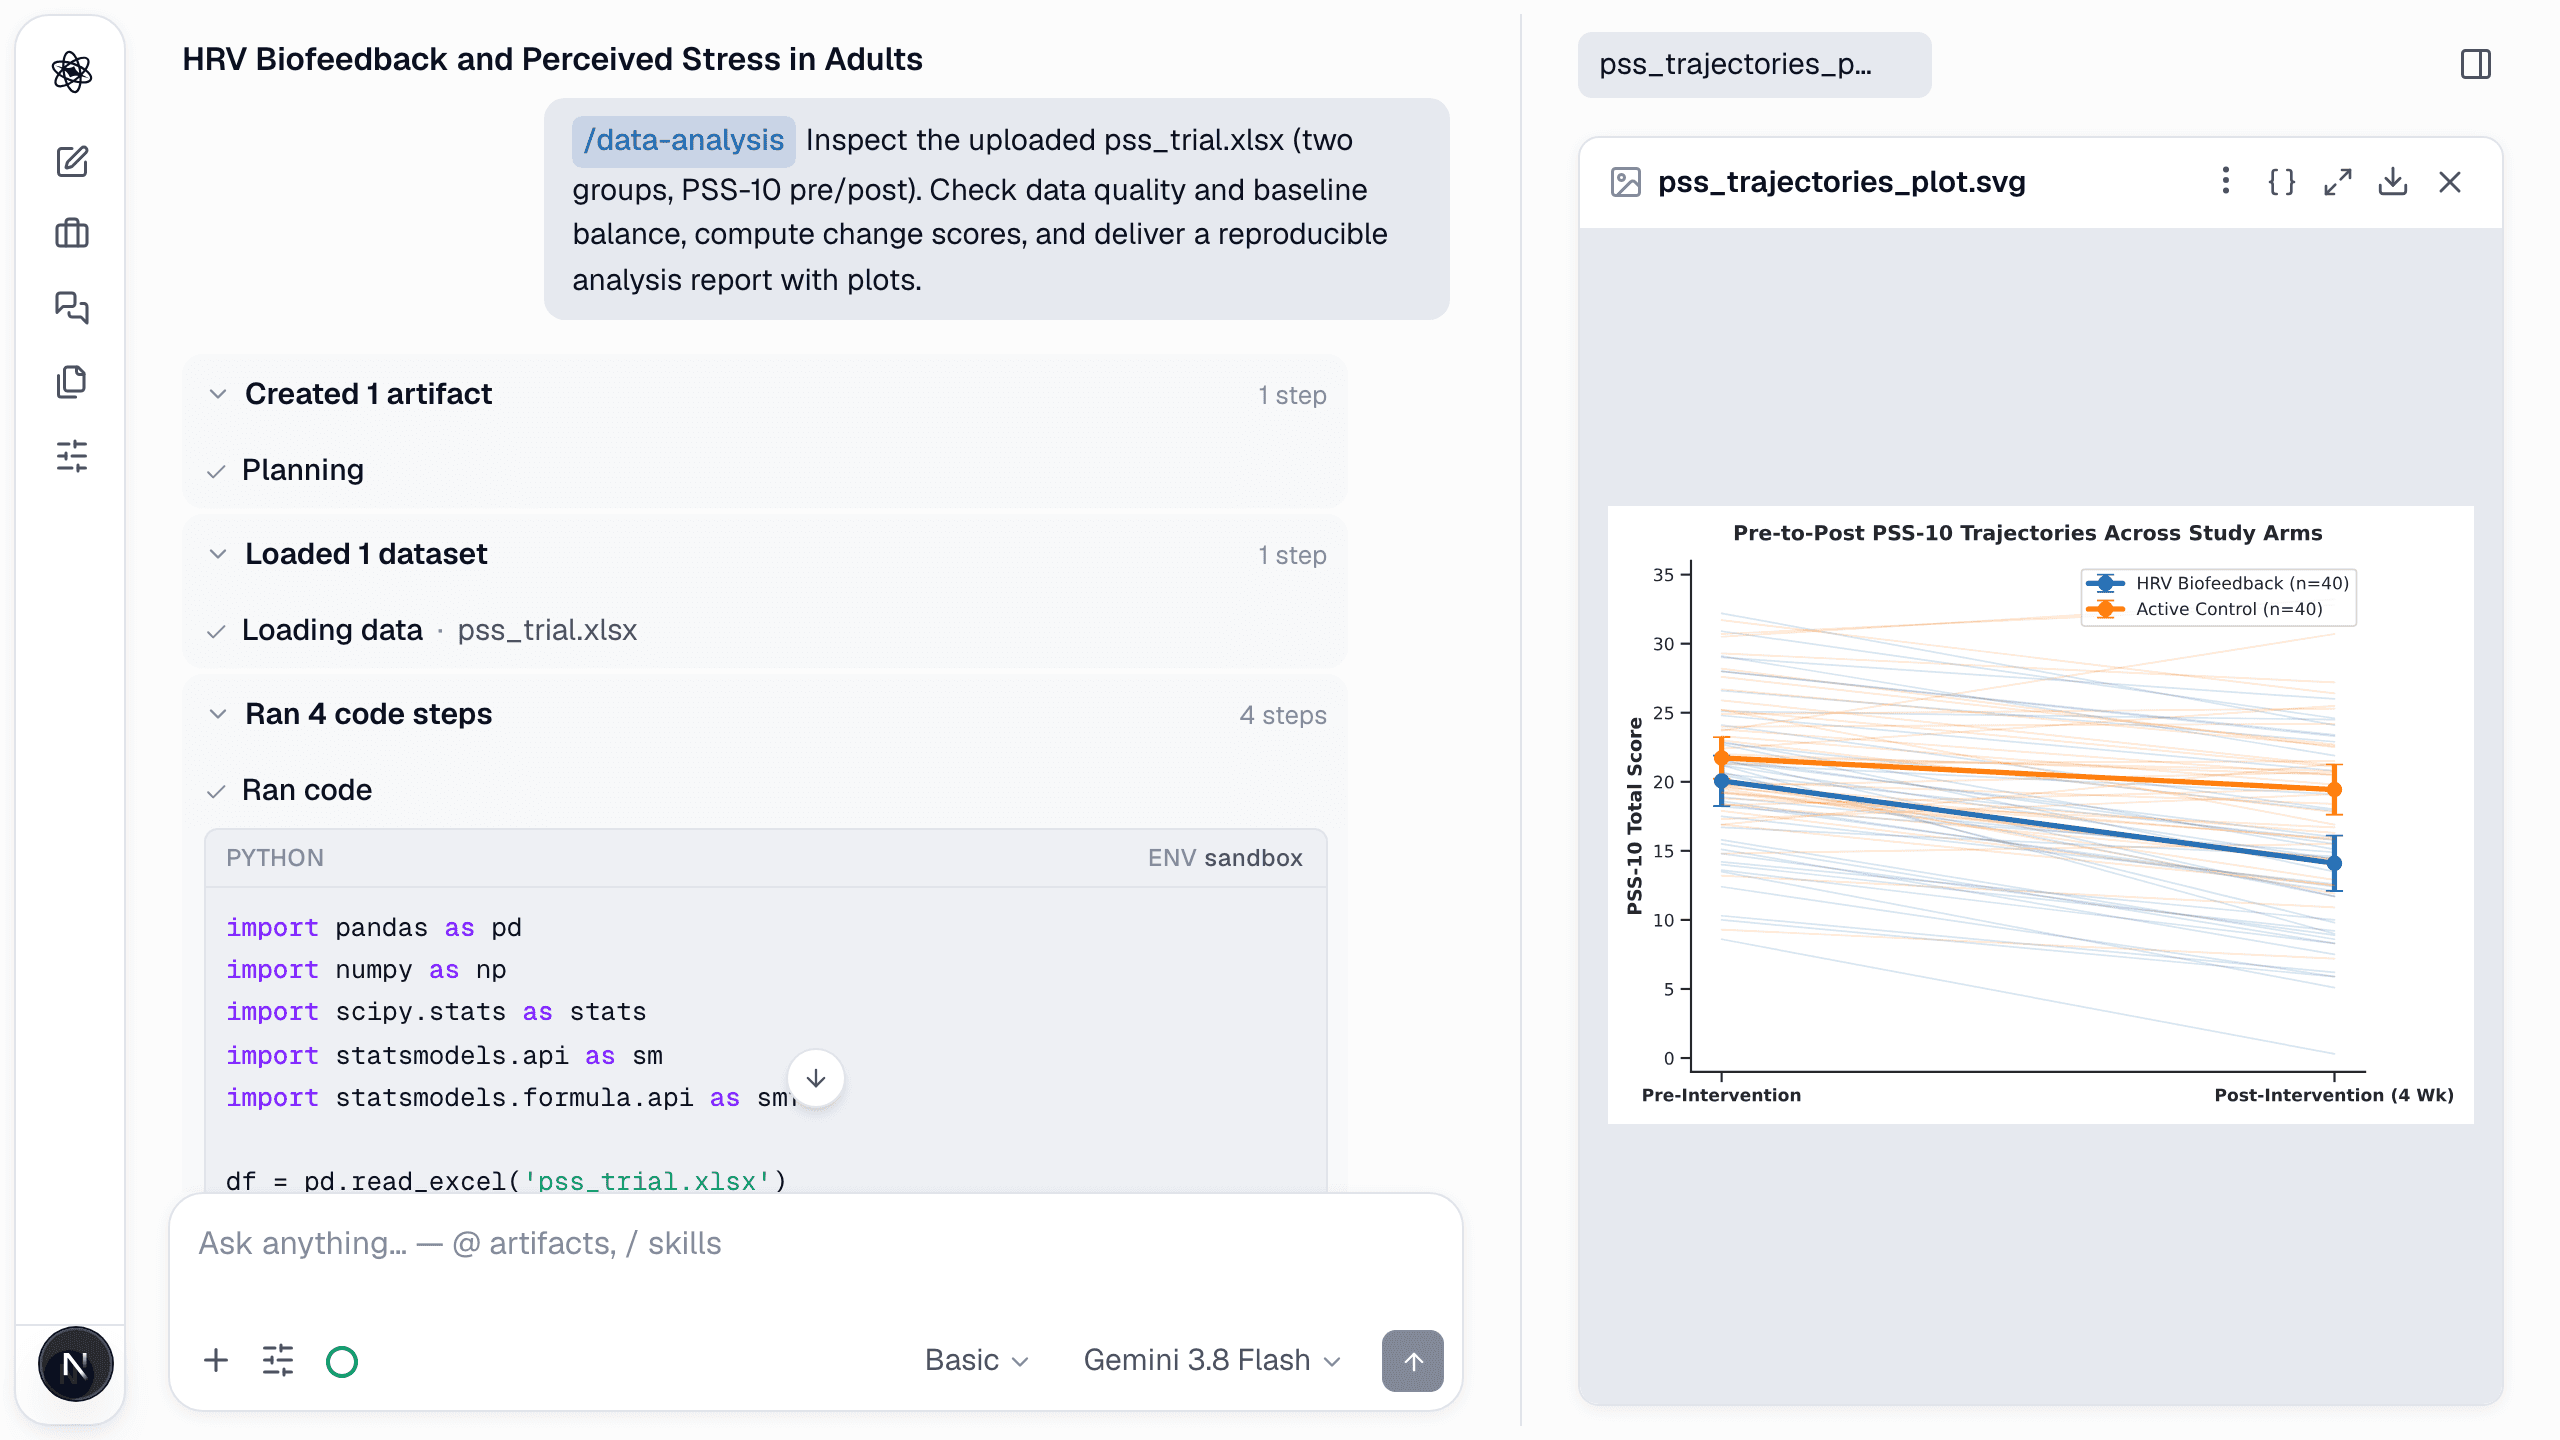
The agent inspects the structure first — 80 rows, 5 columns, no missing values, PSS-10 within range — writes an explicit analysis plan, then runs it in a sandbox. Each code step is visible and expandable.
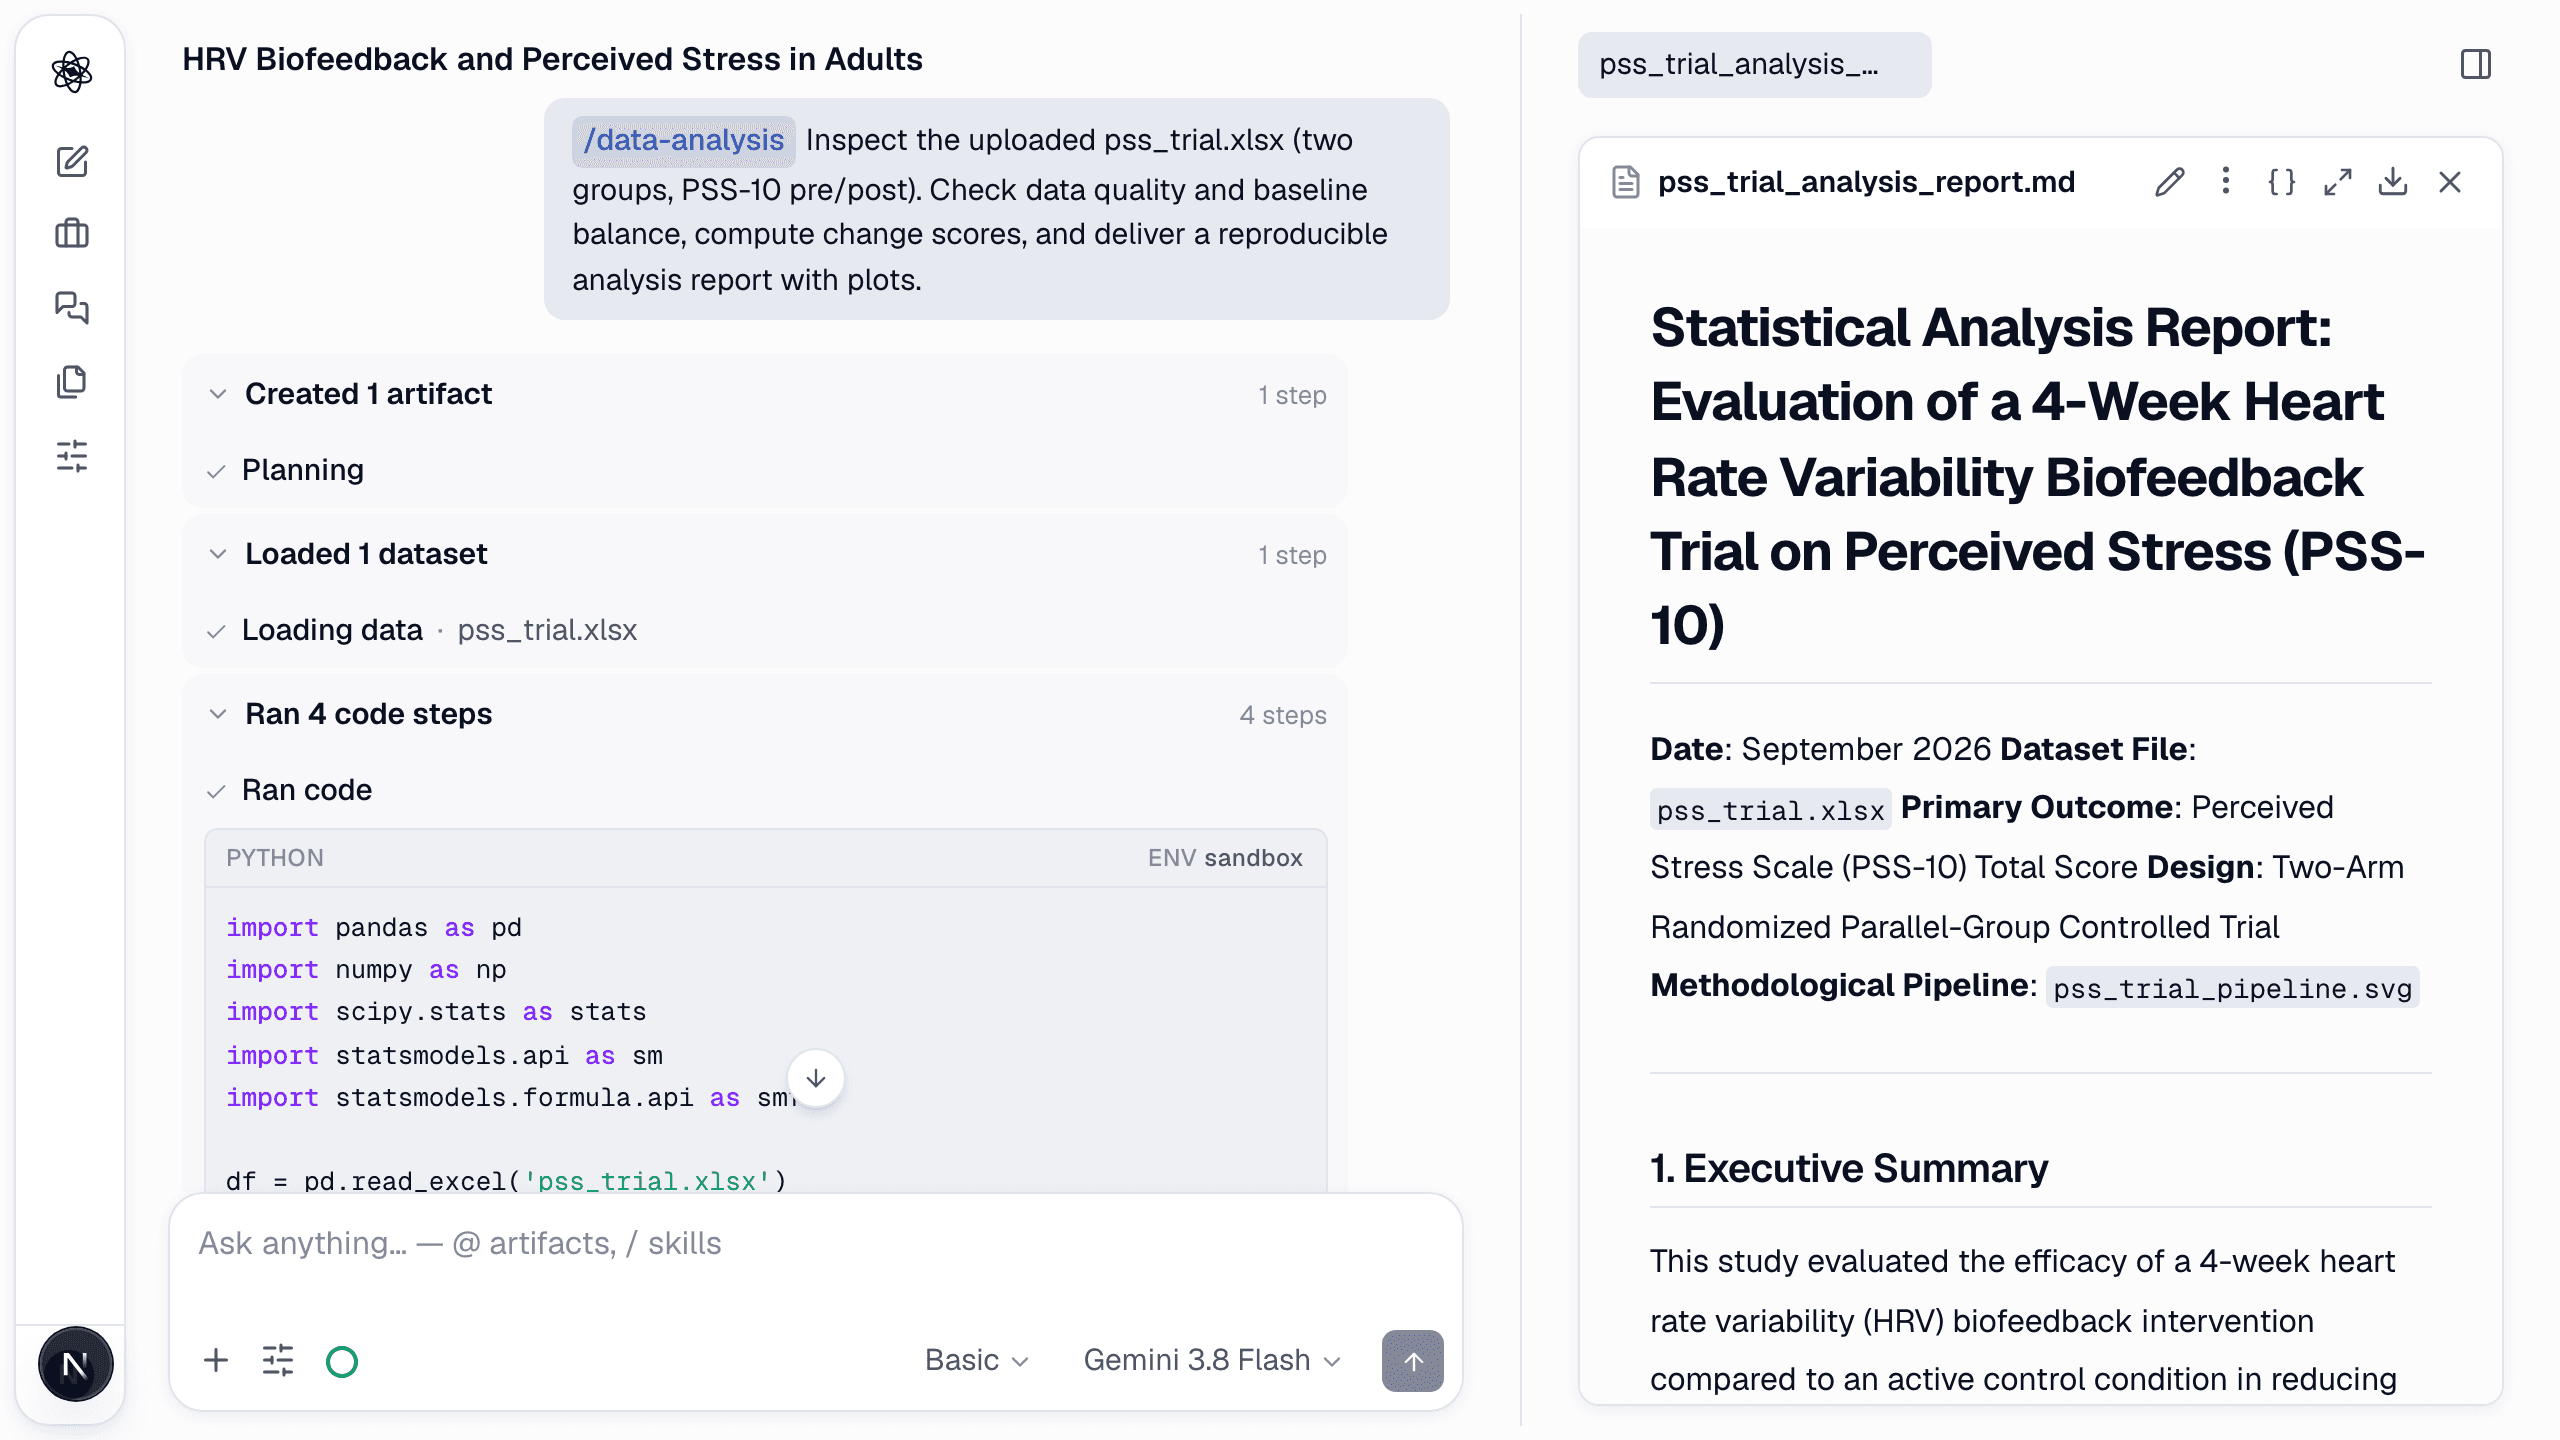
You get a data-quality report with baseline balance, individual pre-to-post trajectories, change-score distributions, an ANCOVA fit and a pipeline diagram of what was done to the data.
Statistical analysis
The right test, with the assumptions checked before the p-value
/statistics Using pss_trial.xlsx, test whether the biofeedback group shows a larger PSS-10 reduction than control. Check assumptions, choose the appropriate test, and report the effect size with a 95% CI and achieved power.
No re-upload — the file is already here. The agent identifies the design (two independent groups, pre/post), audits normality and variance, and only then picks the test: Welch's t alongside Student's t, plus a baseline-adjusted ANCOVA.
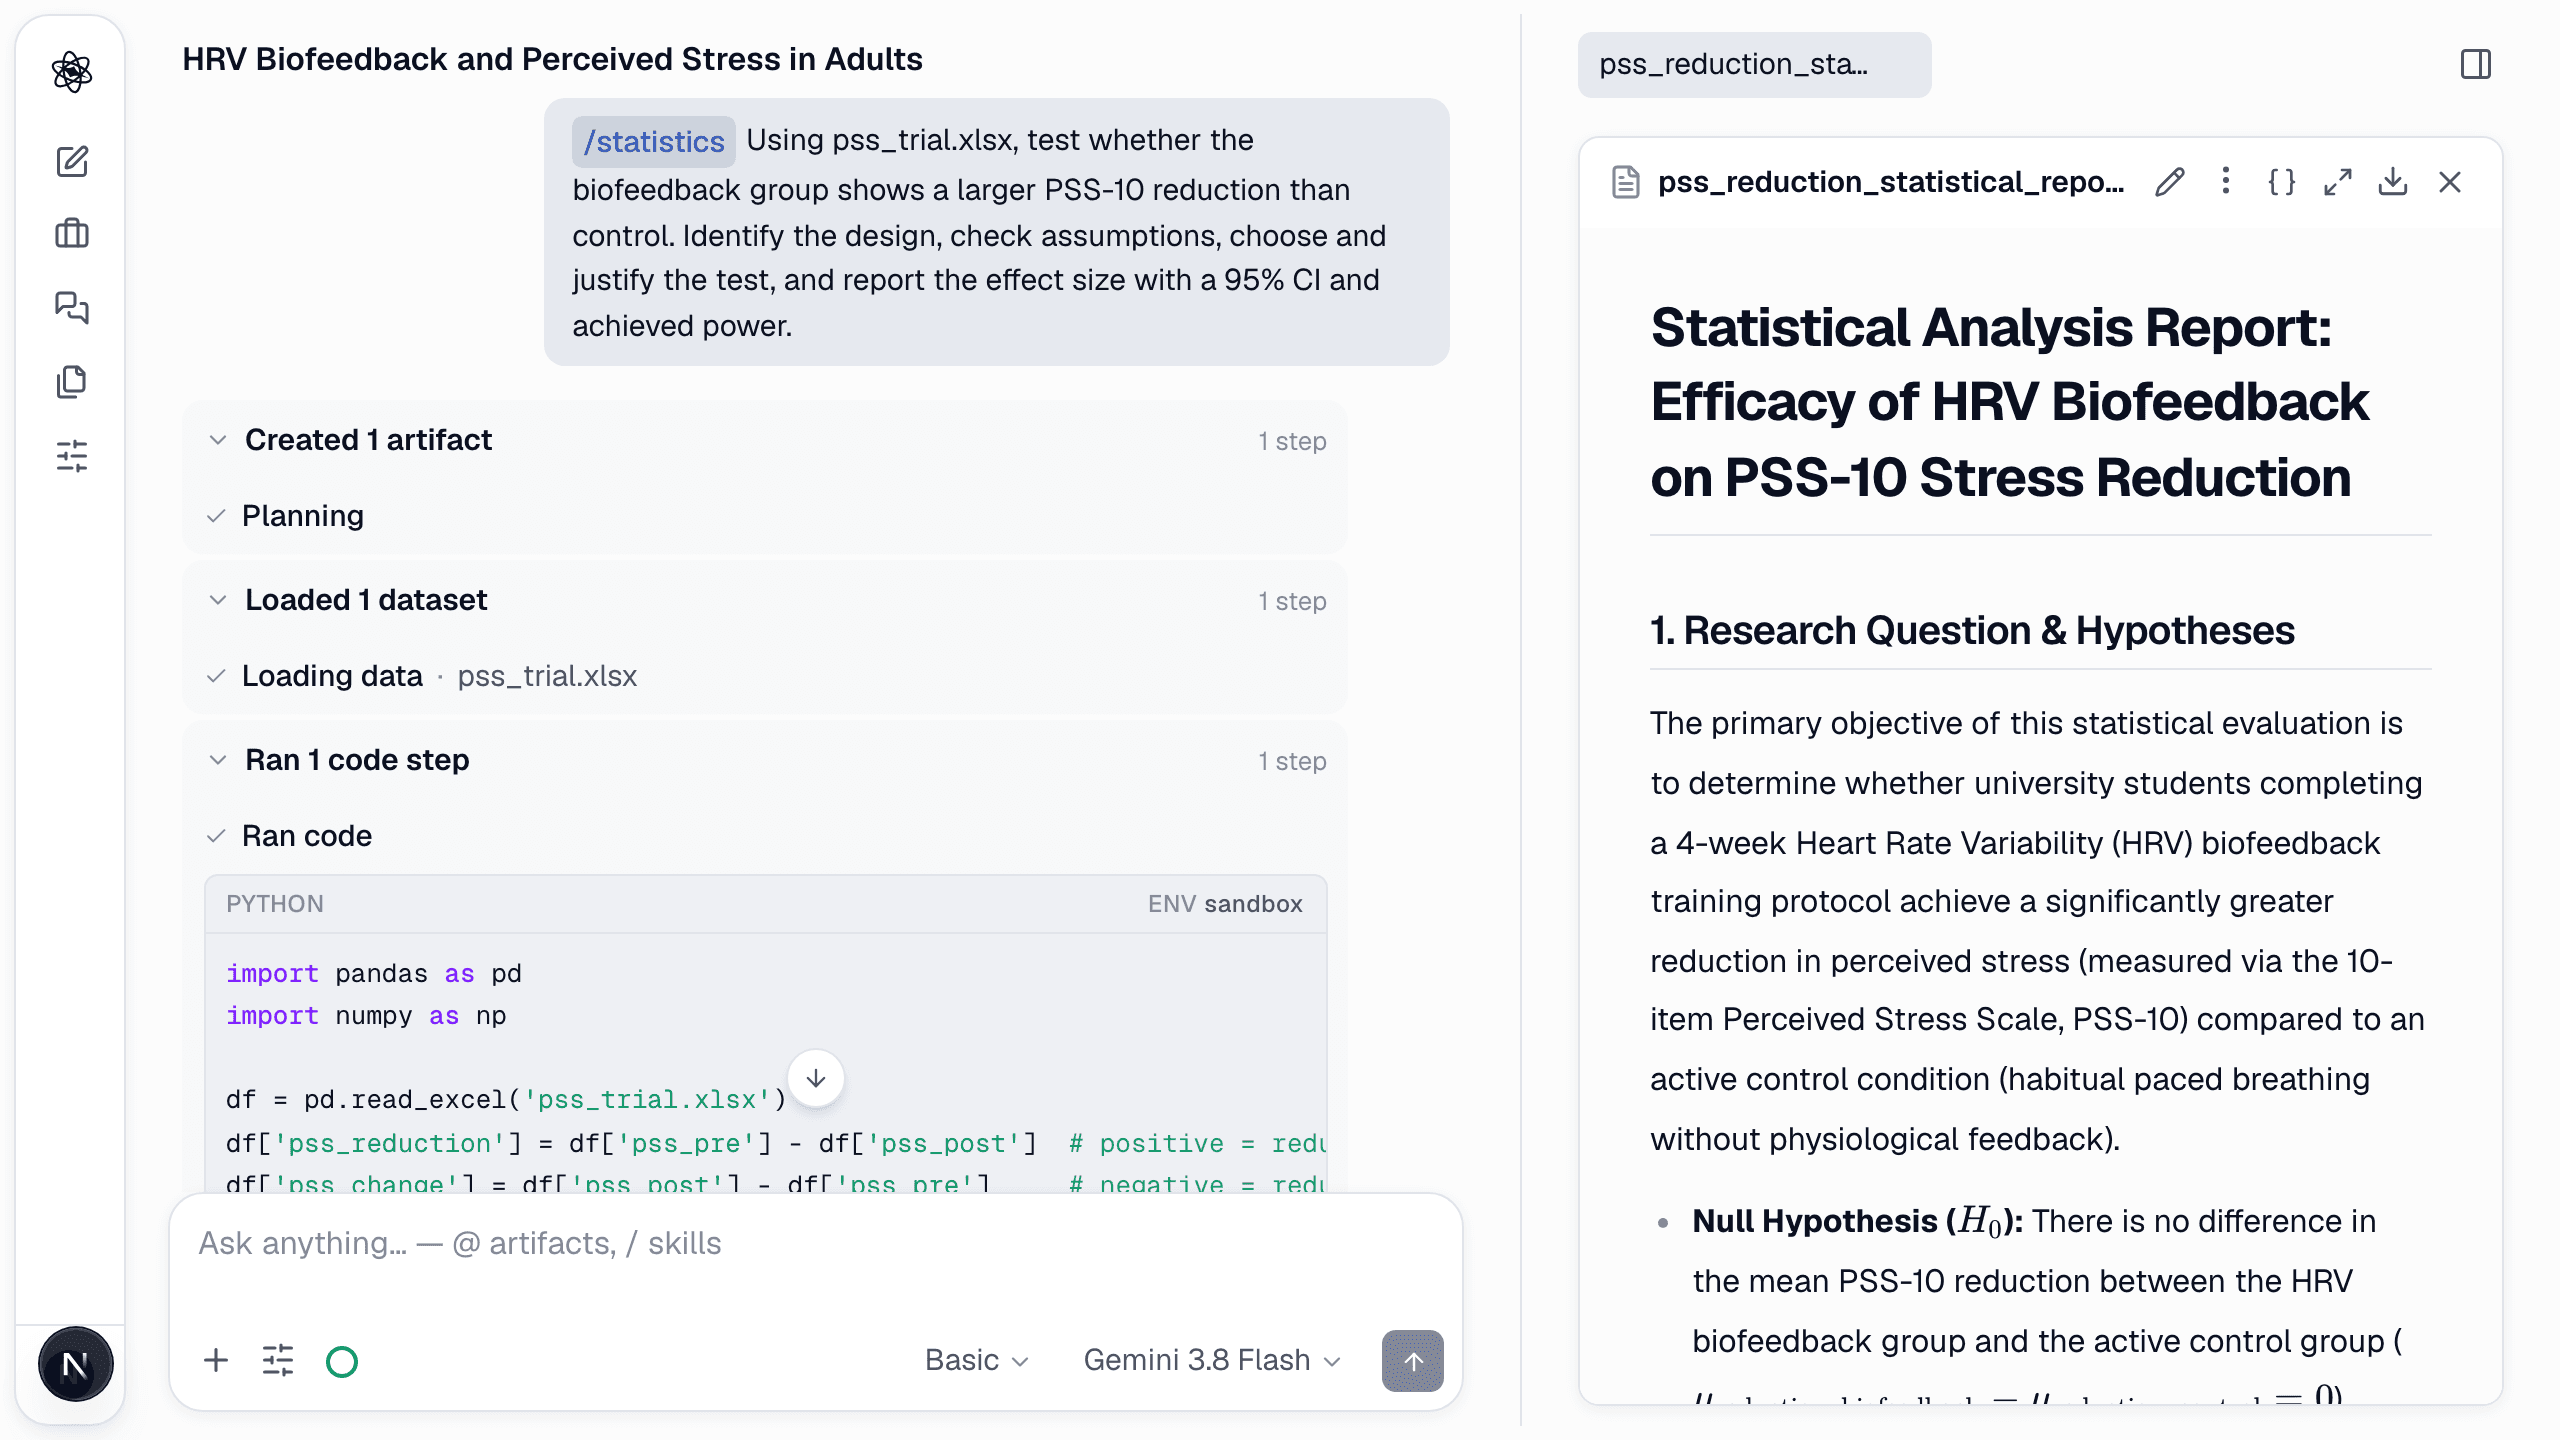
Results come with uncertainty attached: Cohen's d = 1.23 with a 95% CI, Hedges' g, partial η², achieved power and the smallest effect the design could detect. Every number is produced by code you can open.
The statistical report is a separate document from the data report, so the two can be cited independently in the manuscript.
Tip · Choose Deep effort when it matters: an independent review agent then re-checks assumptions, multiple comparisons and sample size before the result reaches your report.
Figures
Draw the figure once — keep editing it until submission
/figure Draw the study flow diagram for the experiment designed in this session: recruitment → screening → randomization → HRV biofeedback (4 weeks) vs active control → post-test (PSS-10) → 3-month follow-up. Use a journal template.
The agent reads the design from earlier in the session and draws a native vector figure — grouped phases, arms, sample sizes on the arrows — in a journal template.
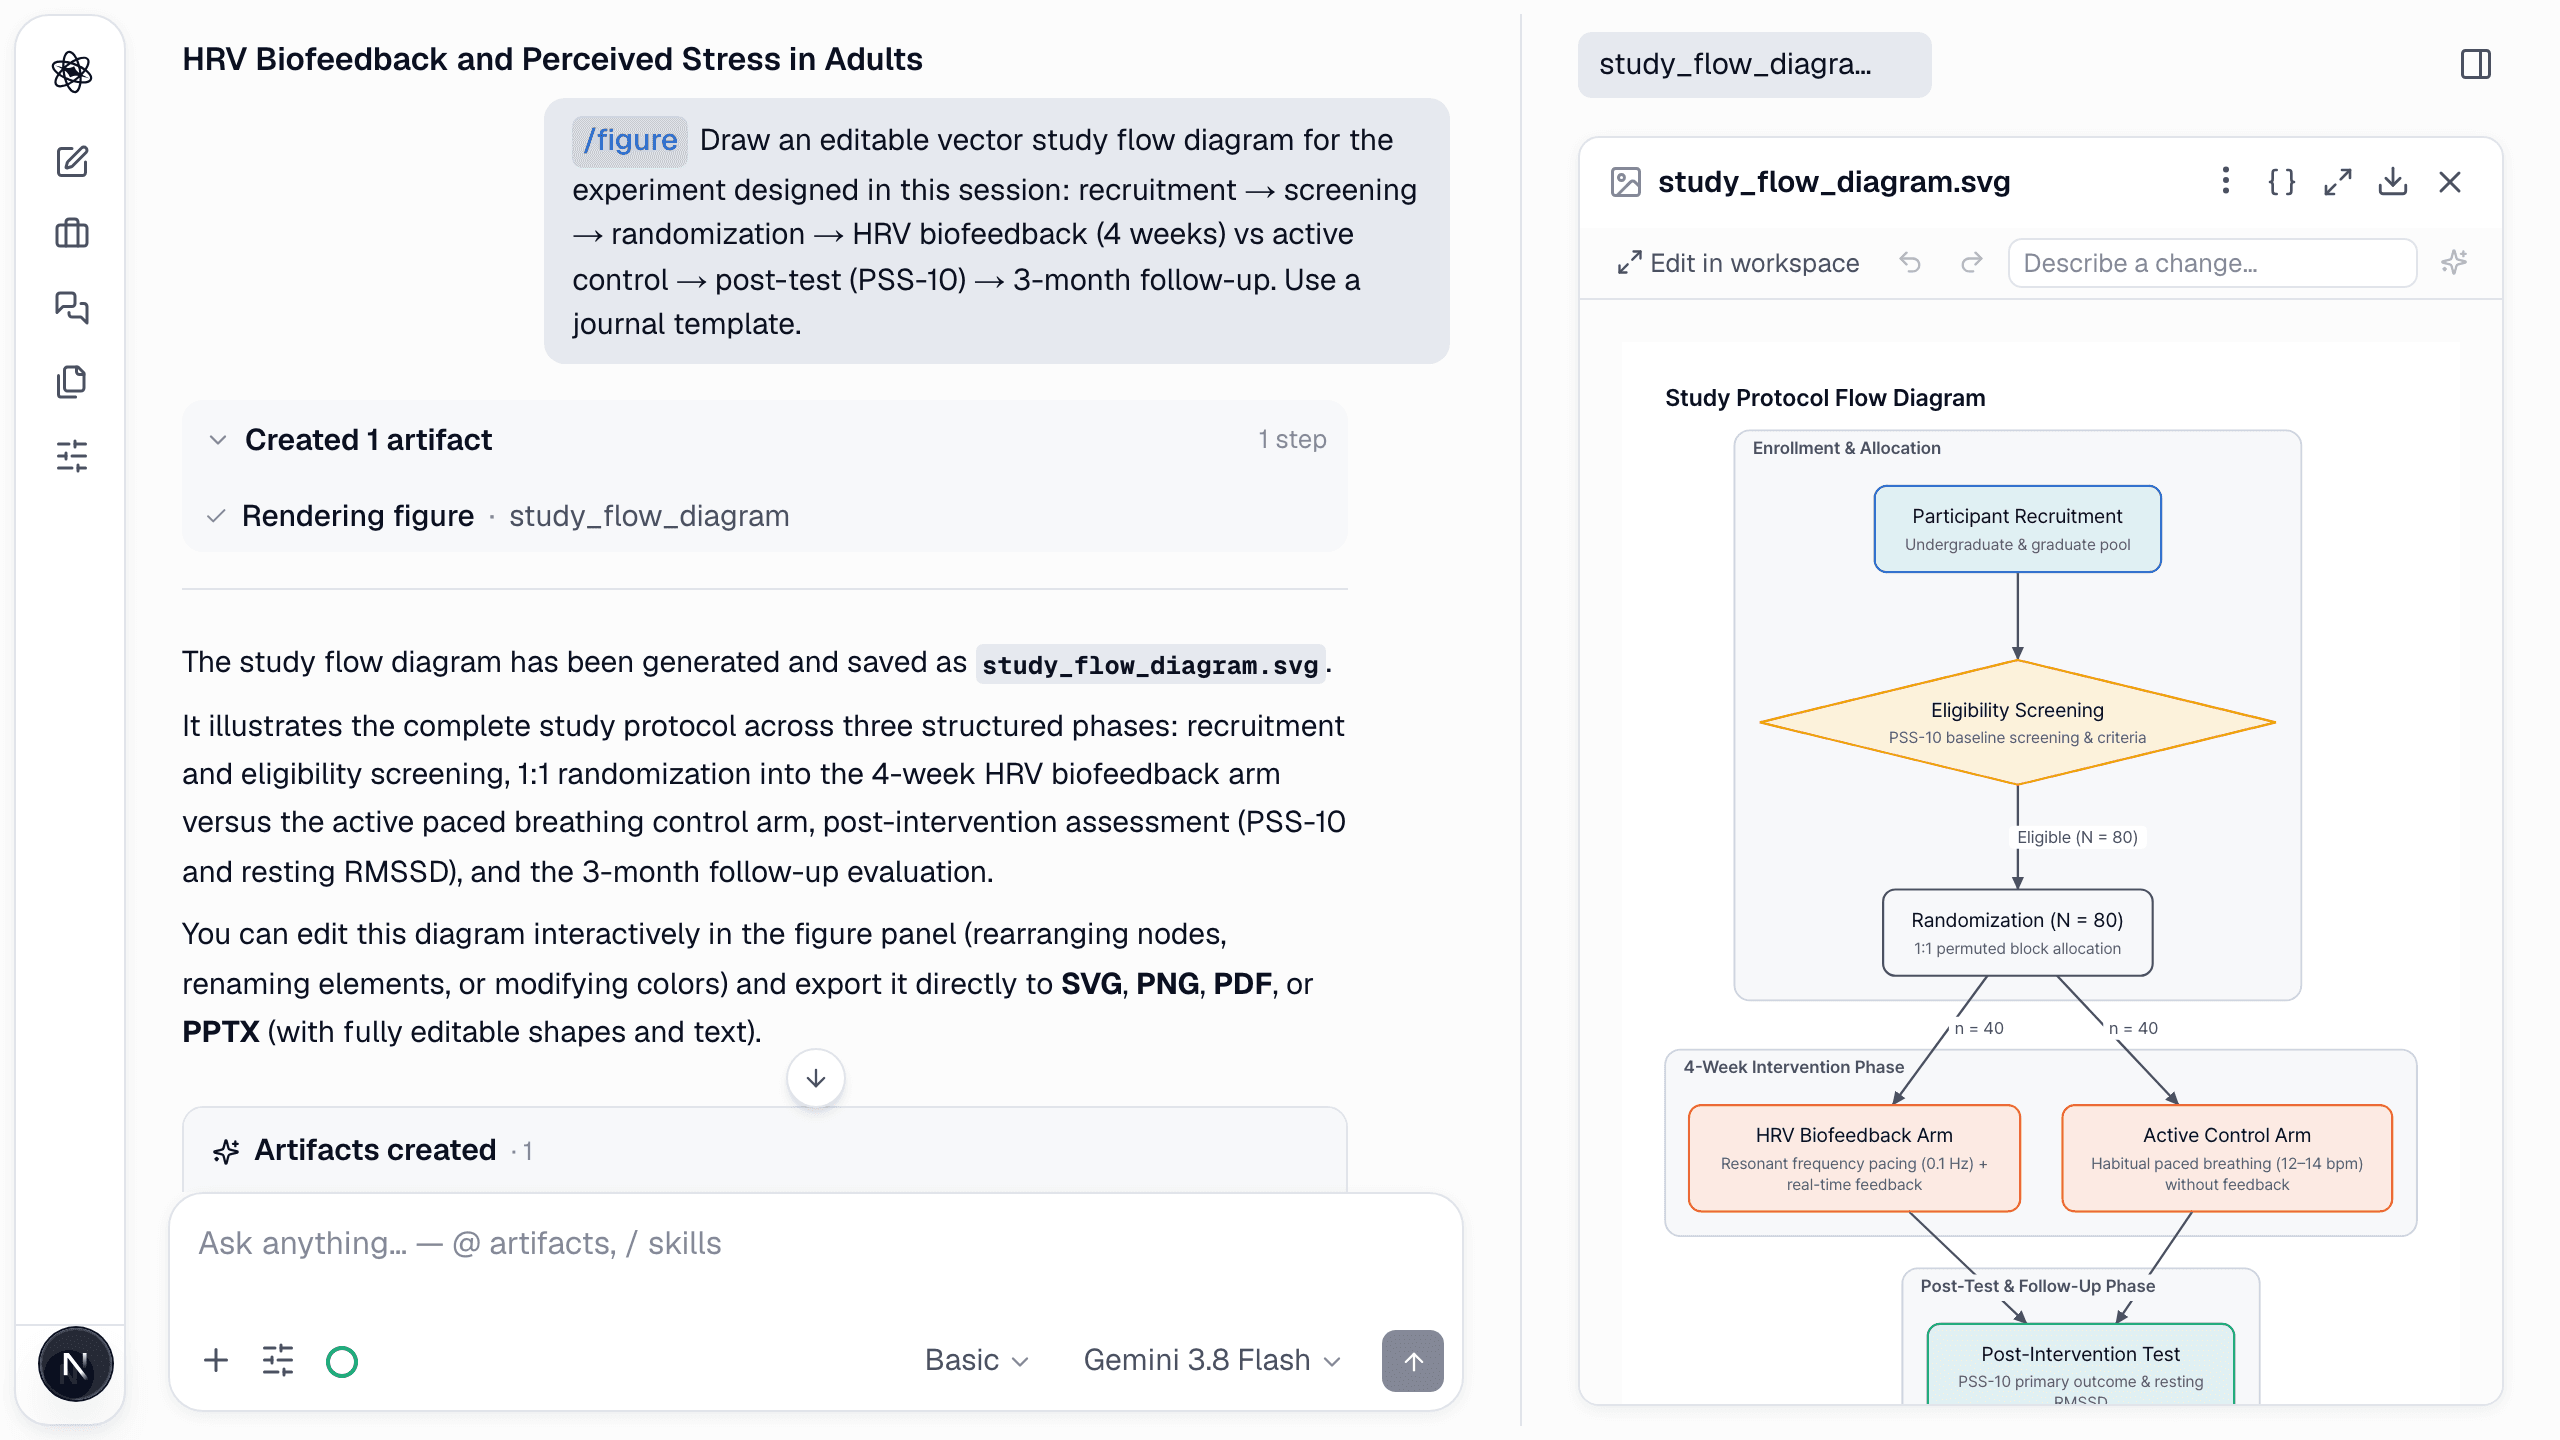
The panel is an editor, not a preview: drag nodes, rename labels, or type a change in plain language (“make the follow-up box green”) and the figure is revised in place. Undo and redo are there.
Export as SVG, PNG, PDF or PPTX with the shapes and text still editable.
Paper writing
A manuscript that cannot drift from what you actually found
/paper-writing Write the Methods and Results sections of a manuscript from the literature, design, and analyses in this session, with every claim cited or tied to a session result.
The agent gathers what the session holds — the cited sources, the design document, the analysis and statistics reports, the figures — and writes IMRaD sections from them.
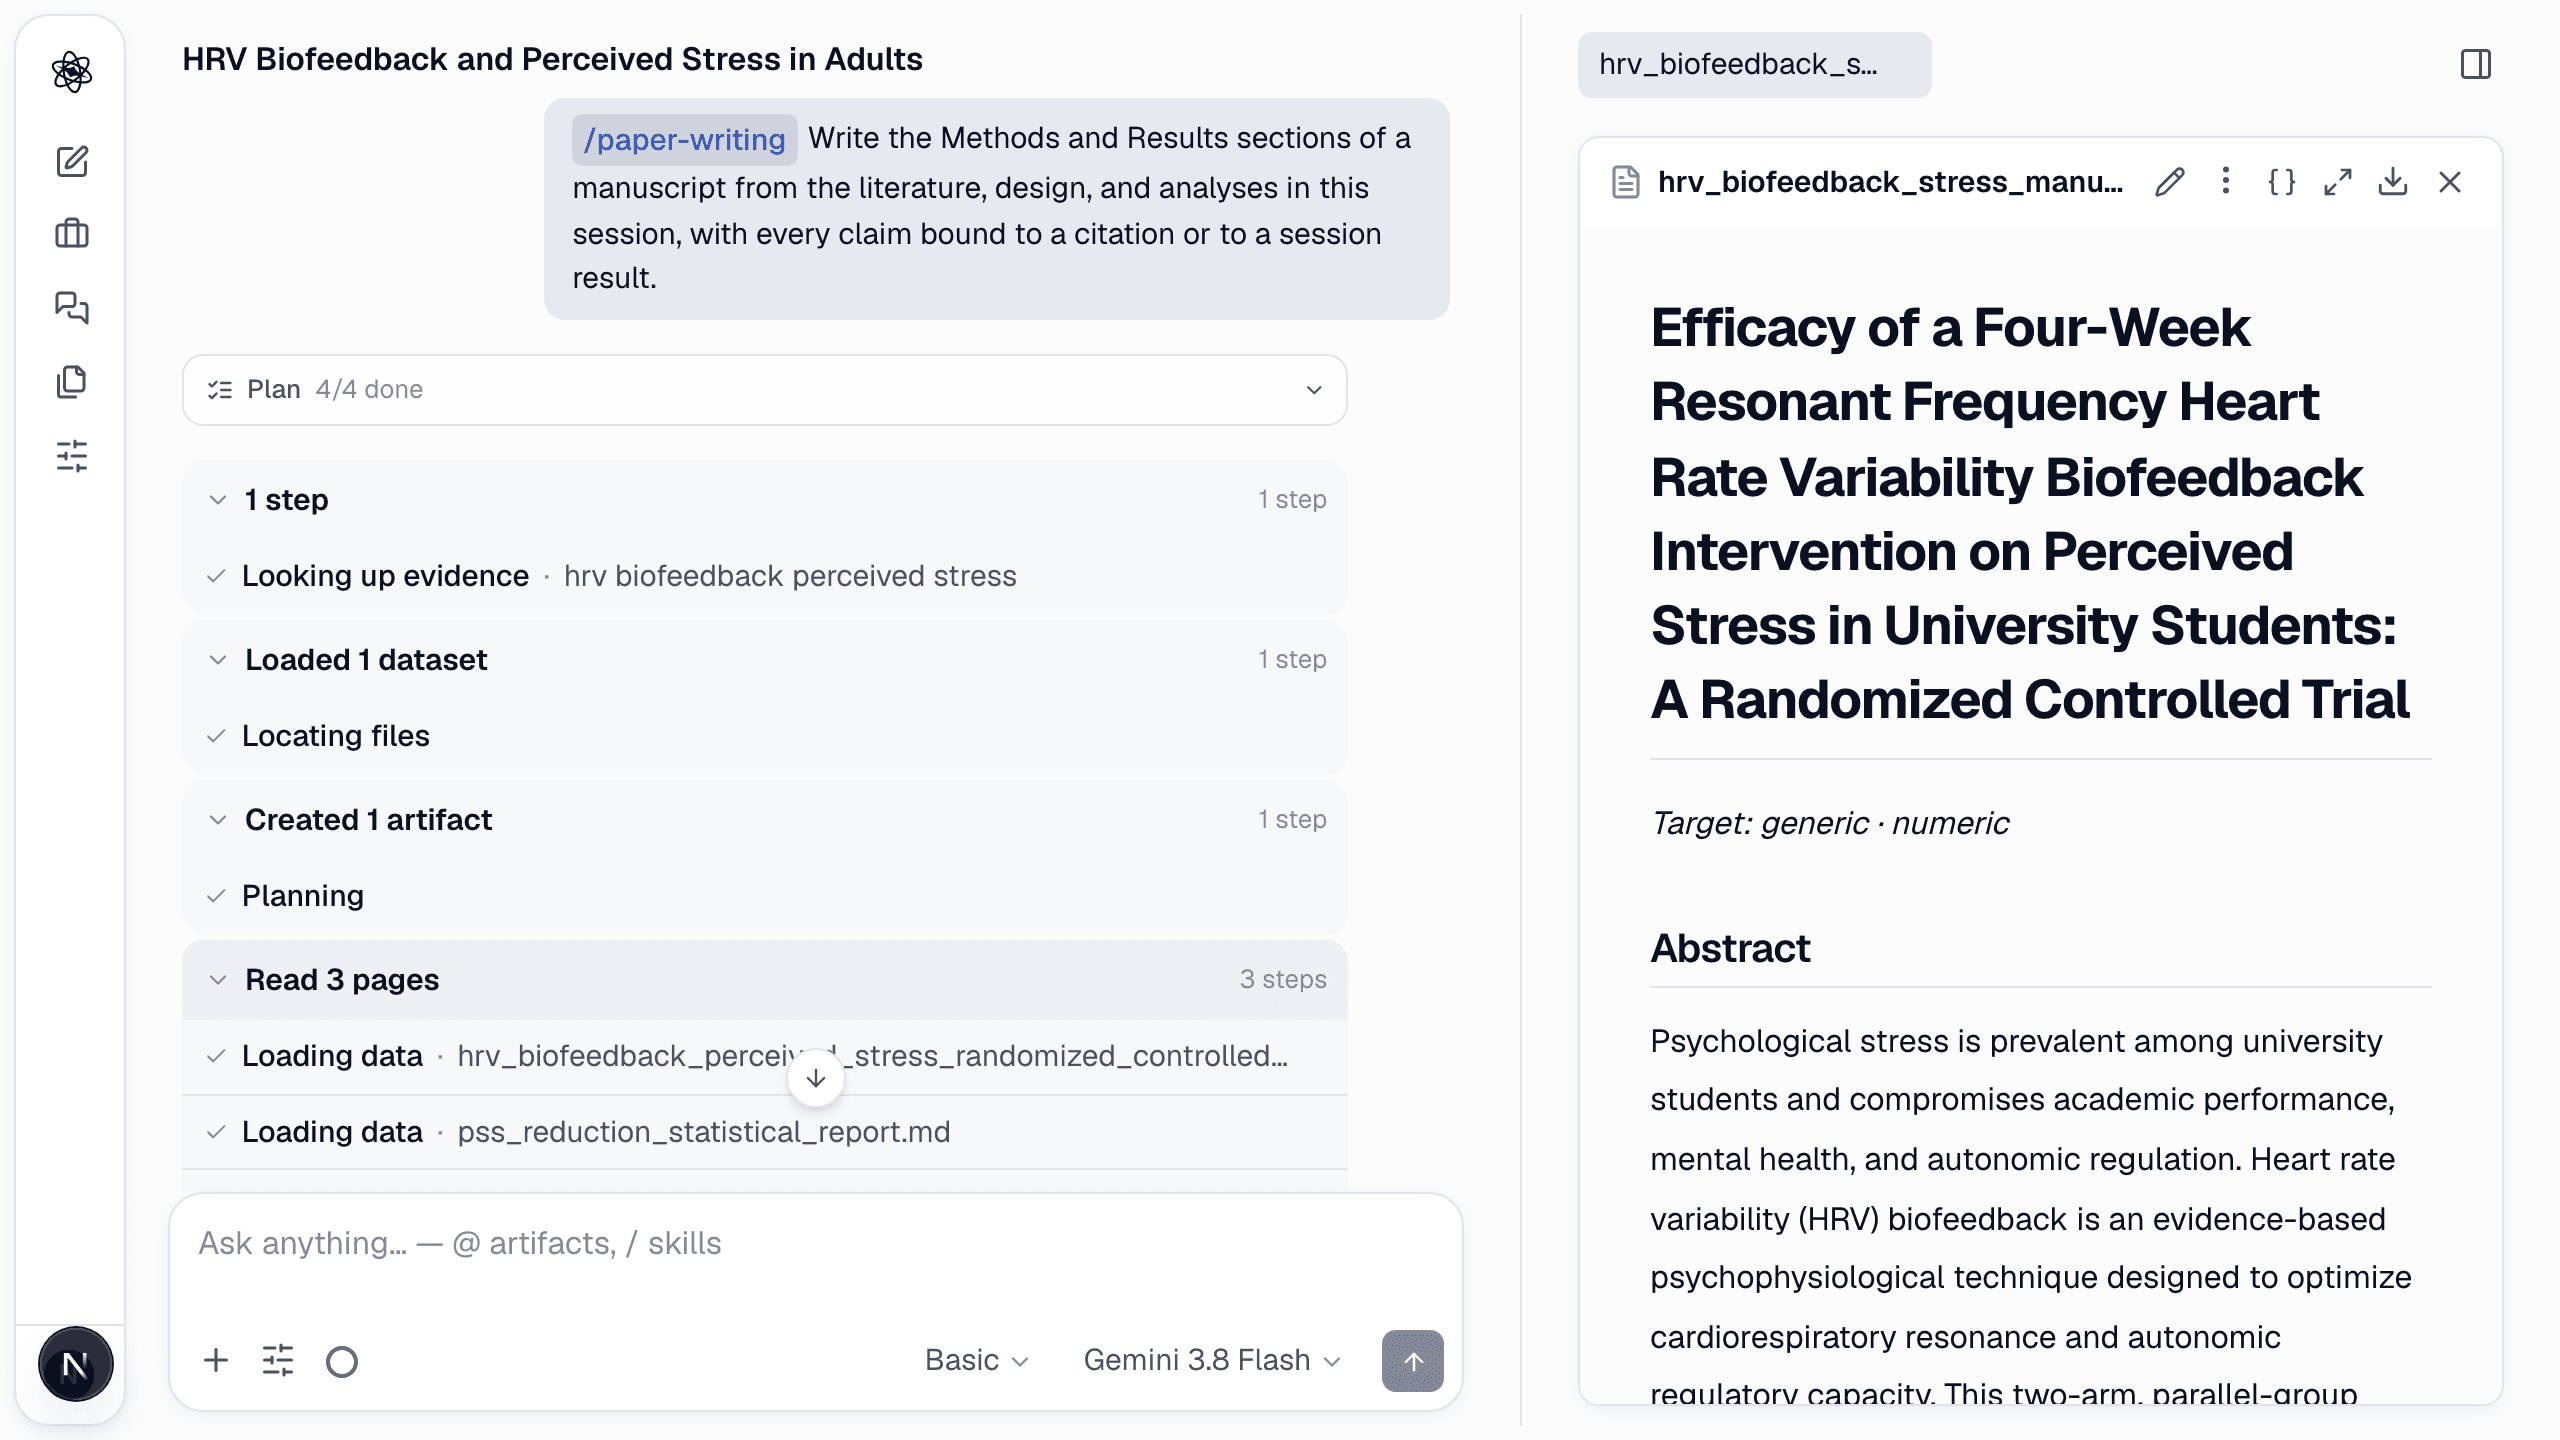
Every empirical sentence is bound to a session result (N = 80, t(78) = 5.51, d = 1.23, ANCOVA F(1, 77) = 29.2) and every background claim to a [n] citation. The reference list is rebuilt from the stored sources so it matches exactly what is cited.
Anything the session cannot support is disclosed instead of smoothed over — here, secondary outcomes that were in the design but not in the dataset are flagged as future endpoints.
Tip · Revise in the same panel: select a paragraph and describe the change, or ask for the Discussion next — the evidence stays attached.