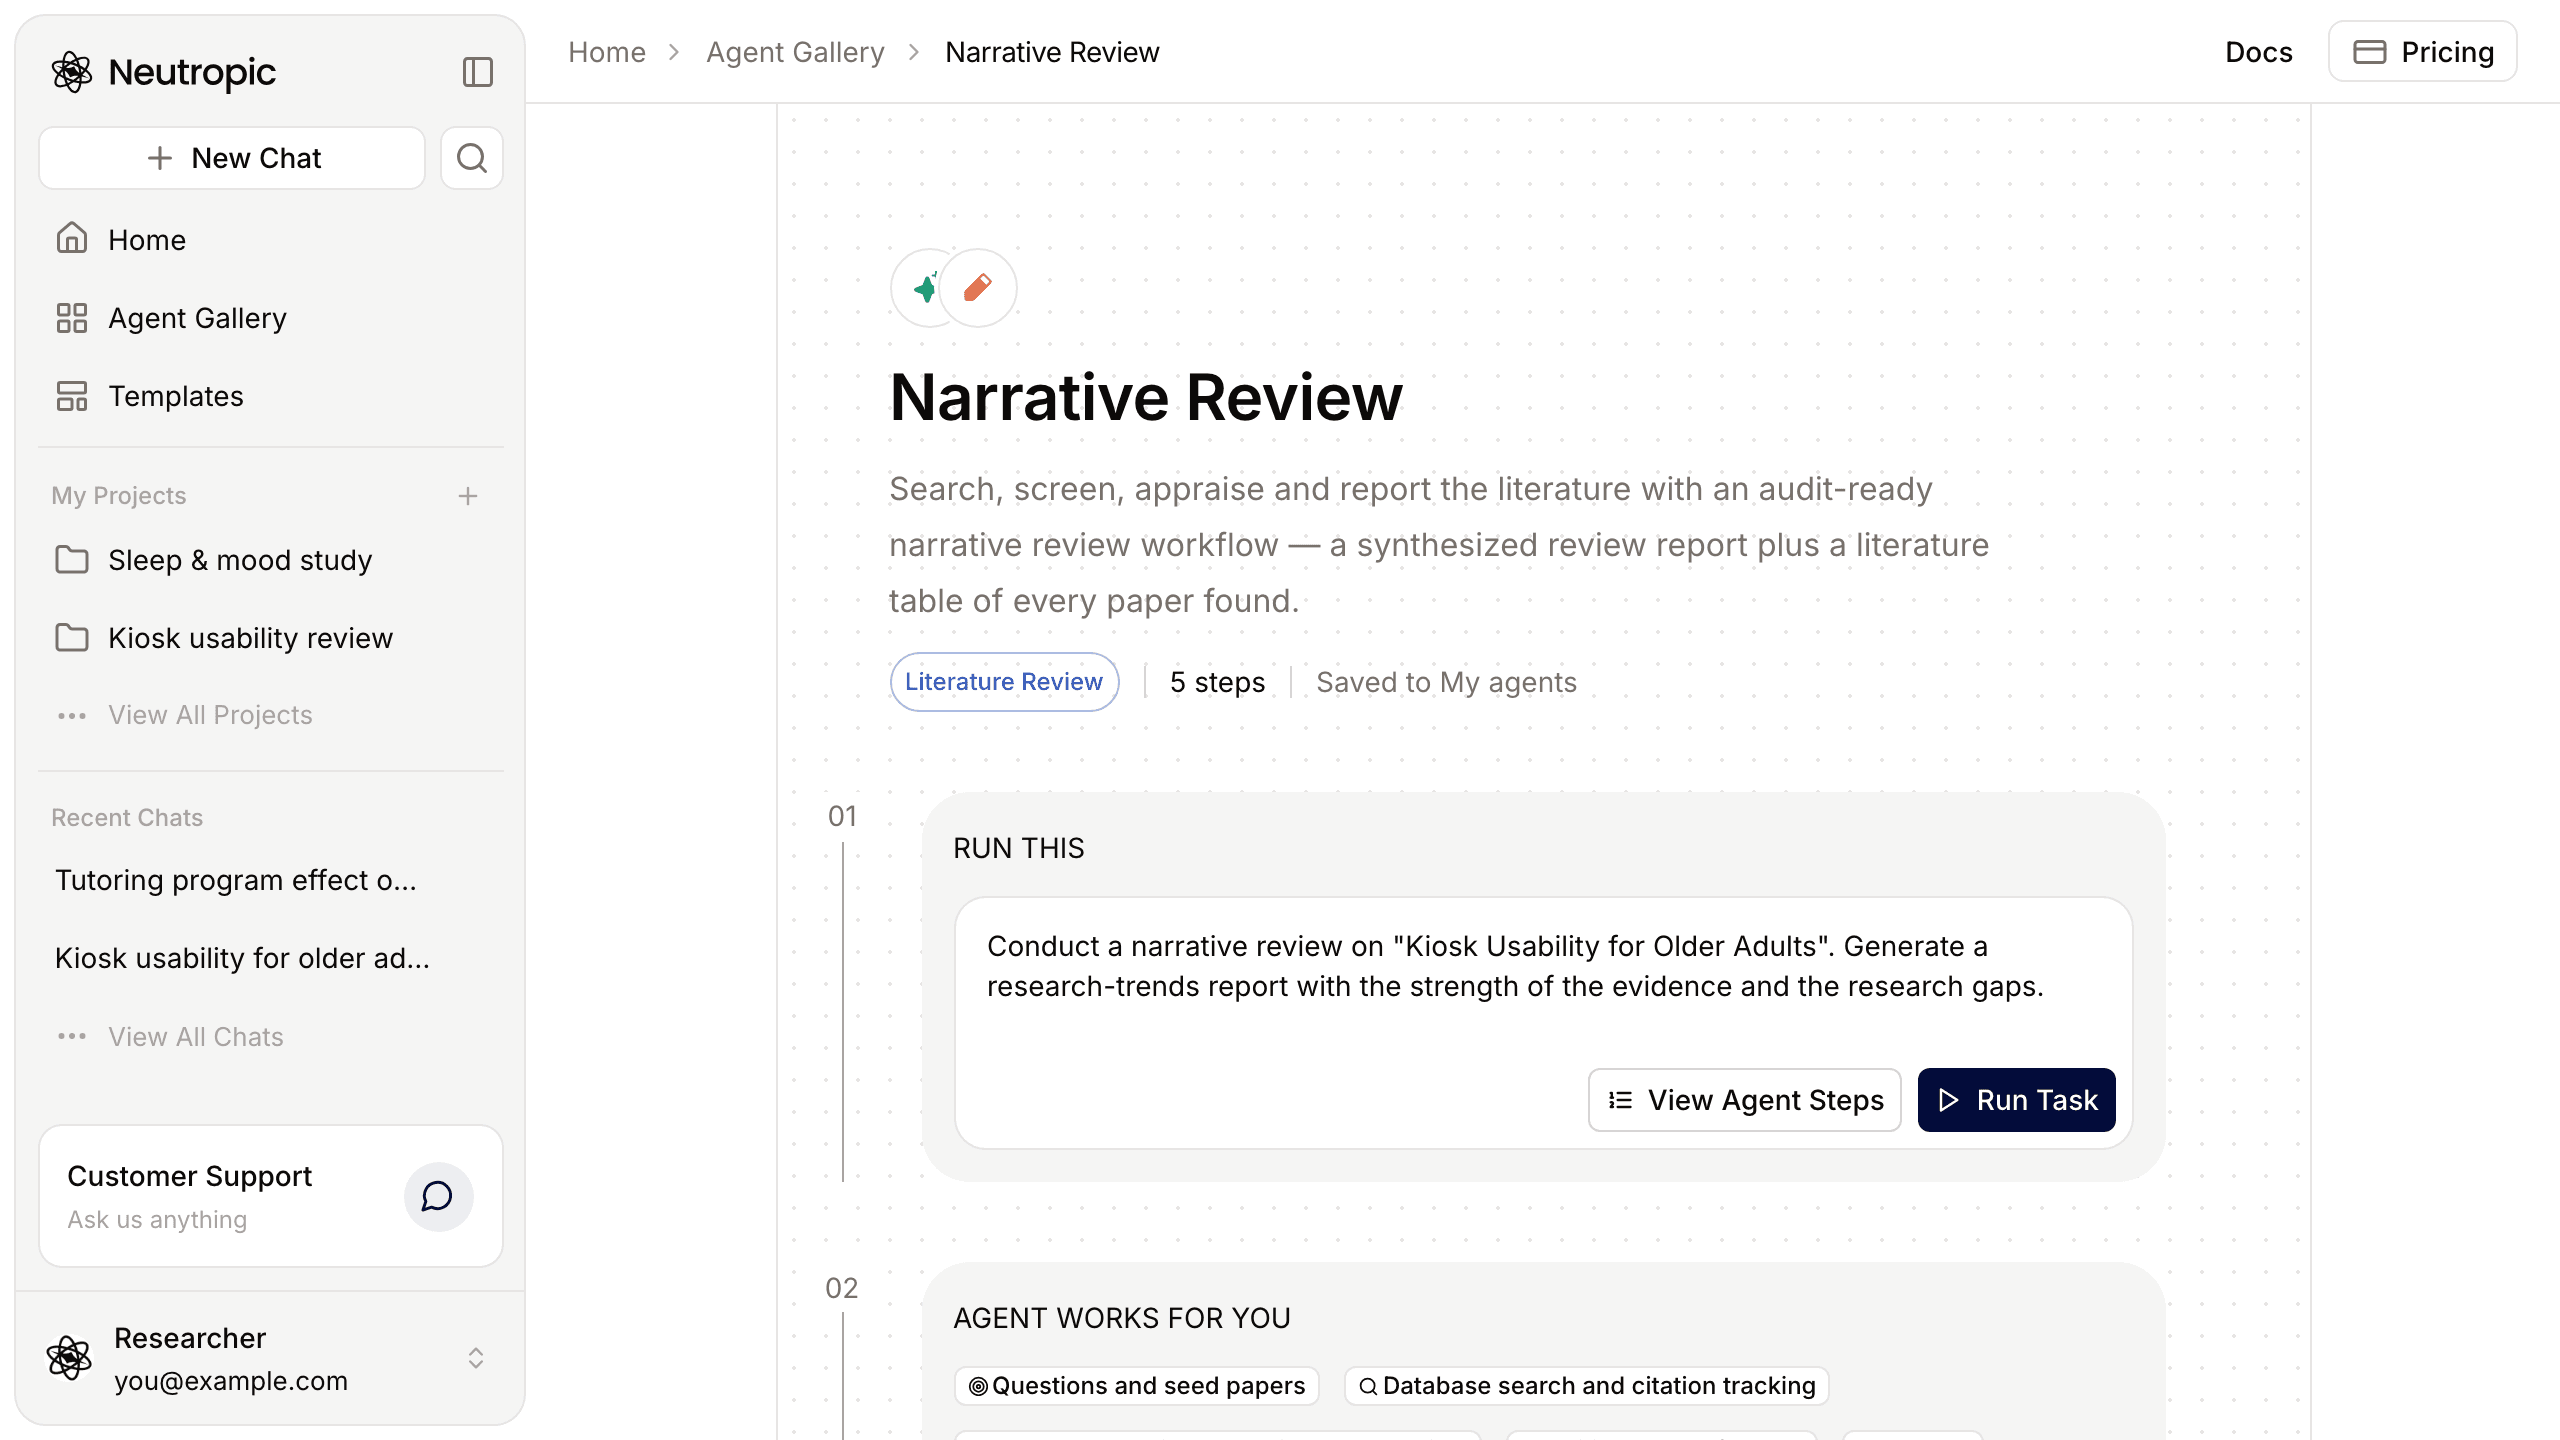
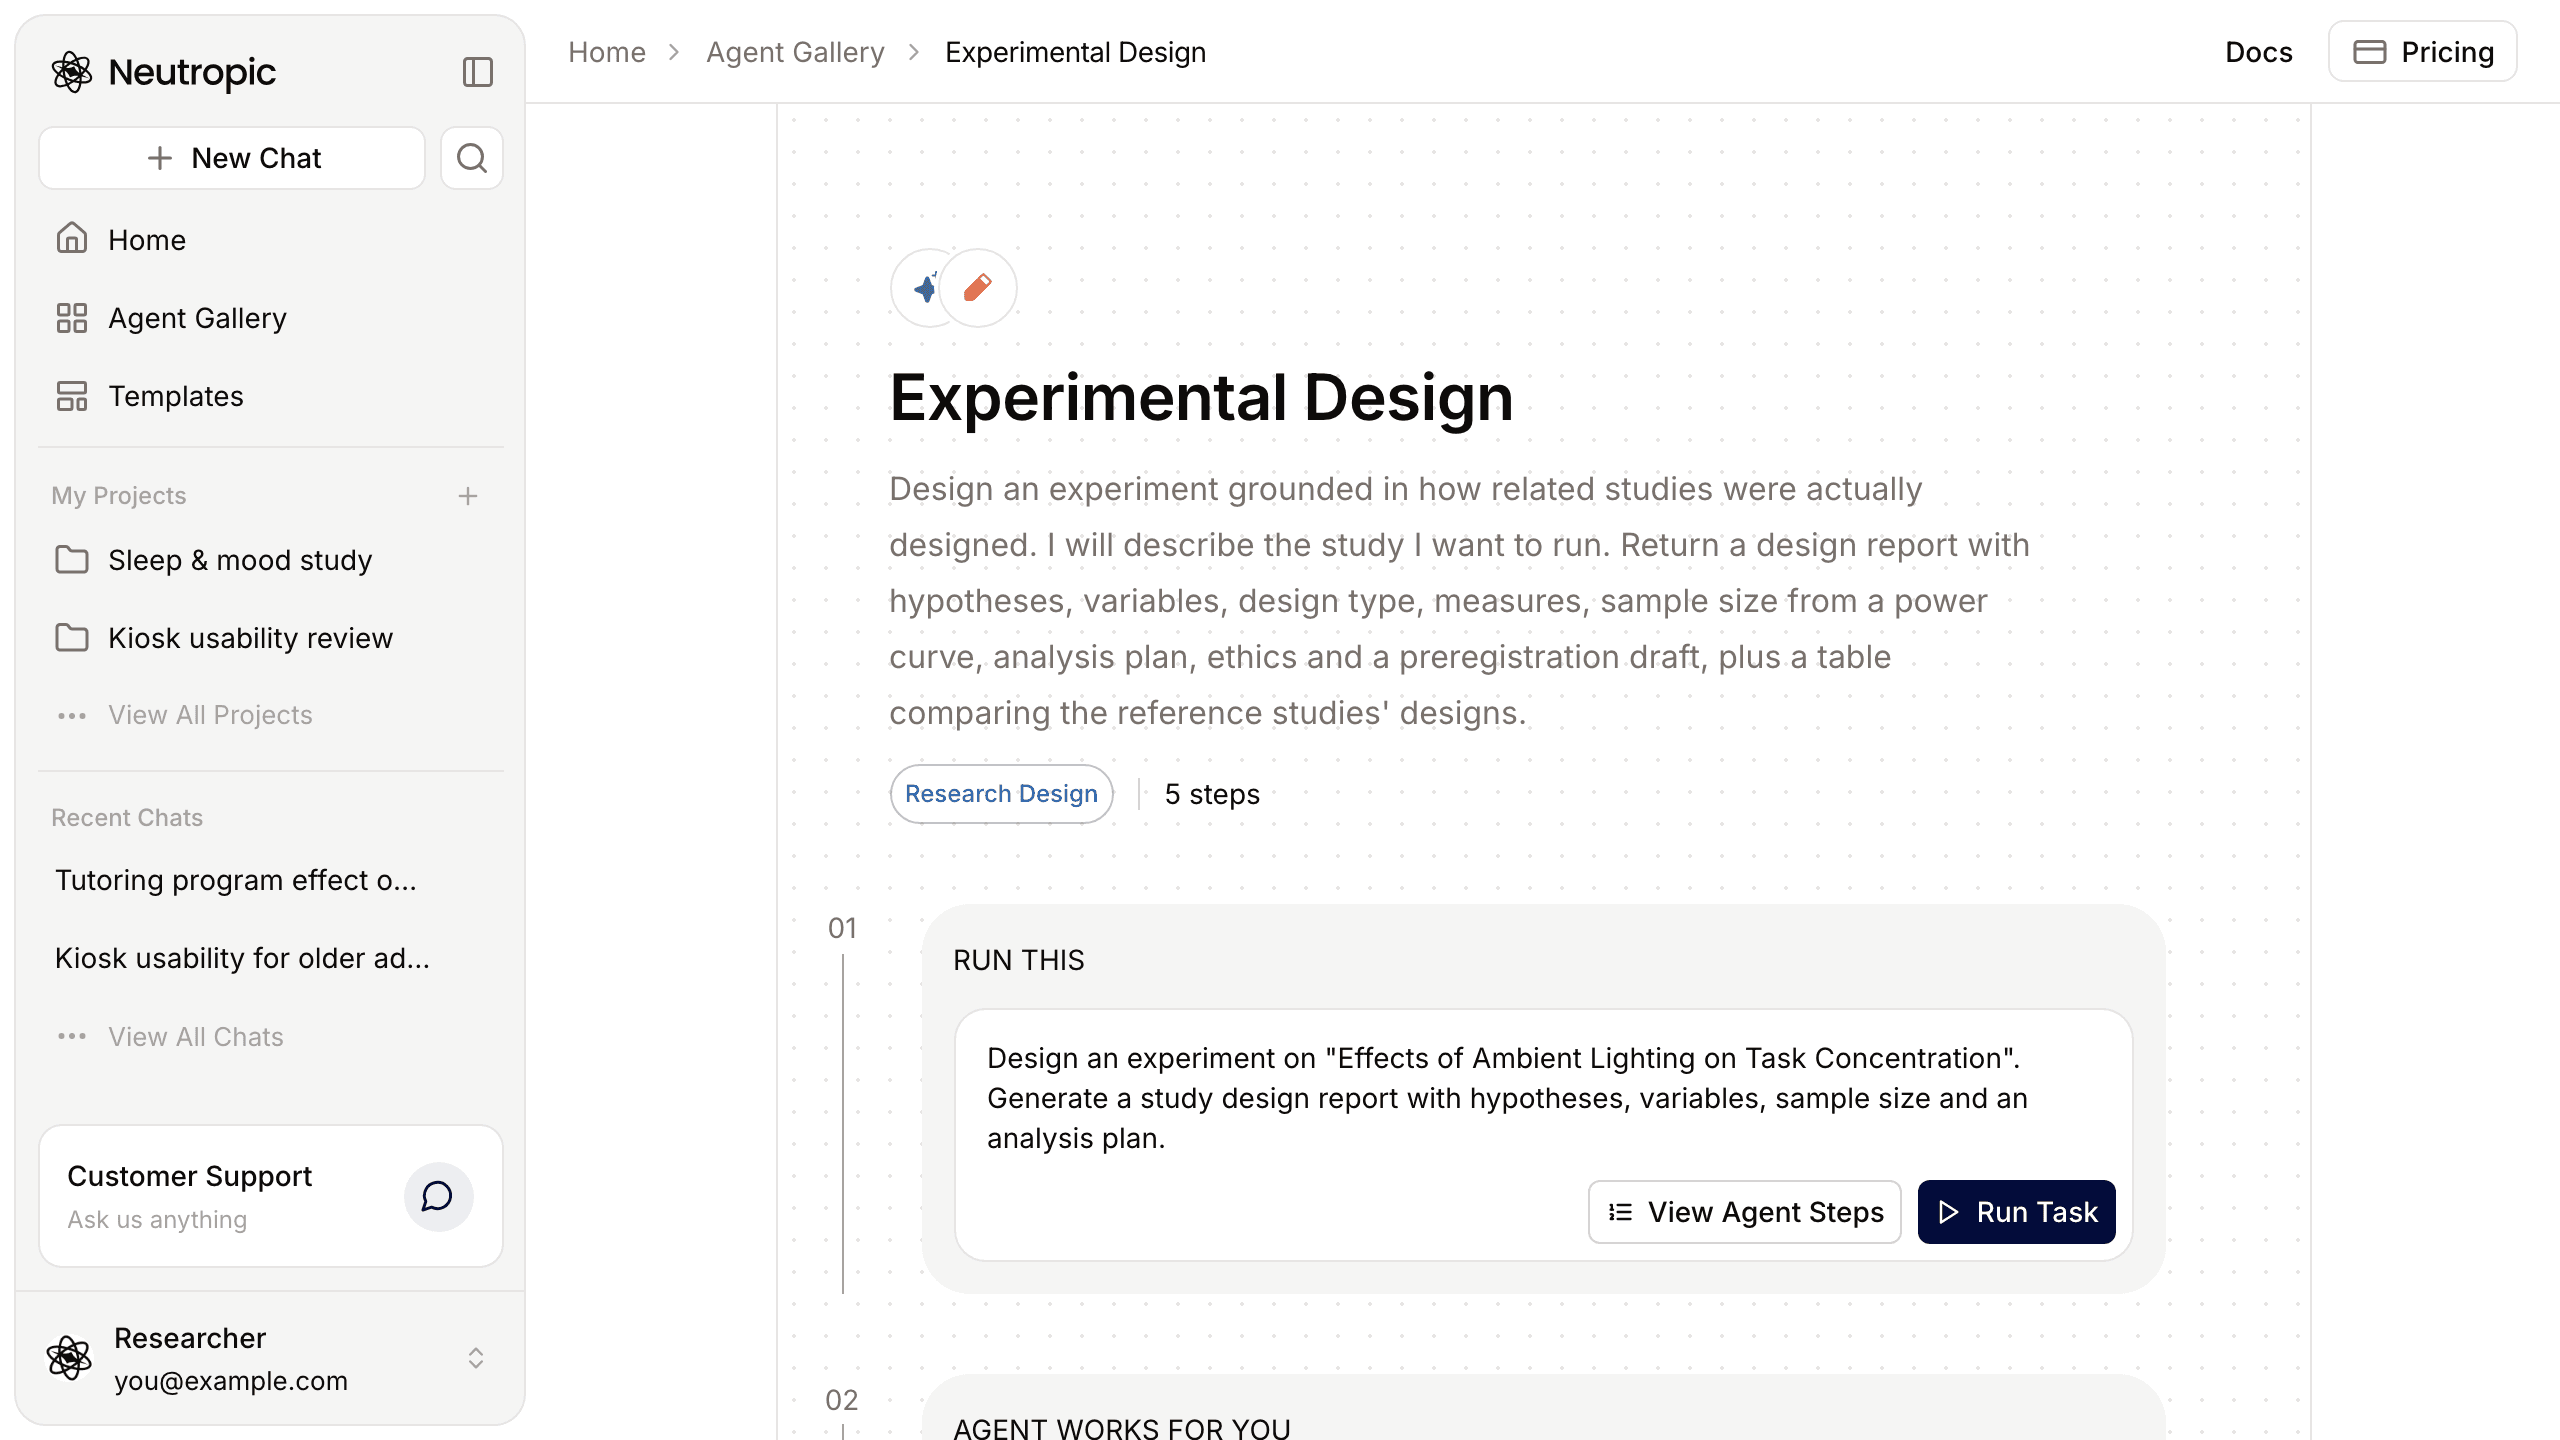
Most datasets go through the same questions in roughly the same order. What is in here, and is it clean? What does the sample look like? Do the groups differ the way I predicted? Did the programme actually cause the change, or can I only predict who changes? And finally — given all that, what should we do?
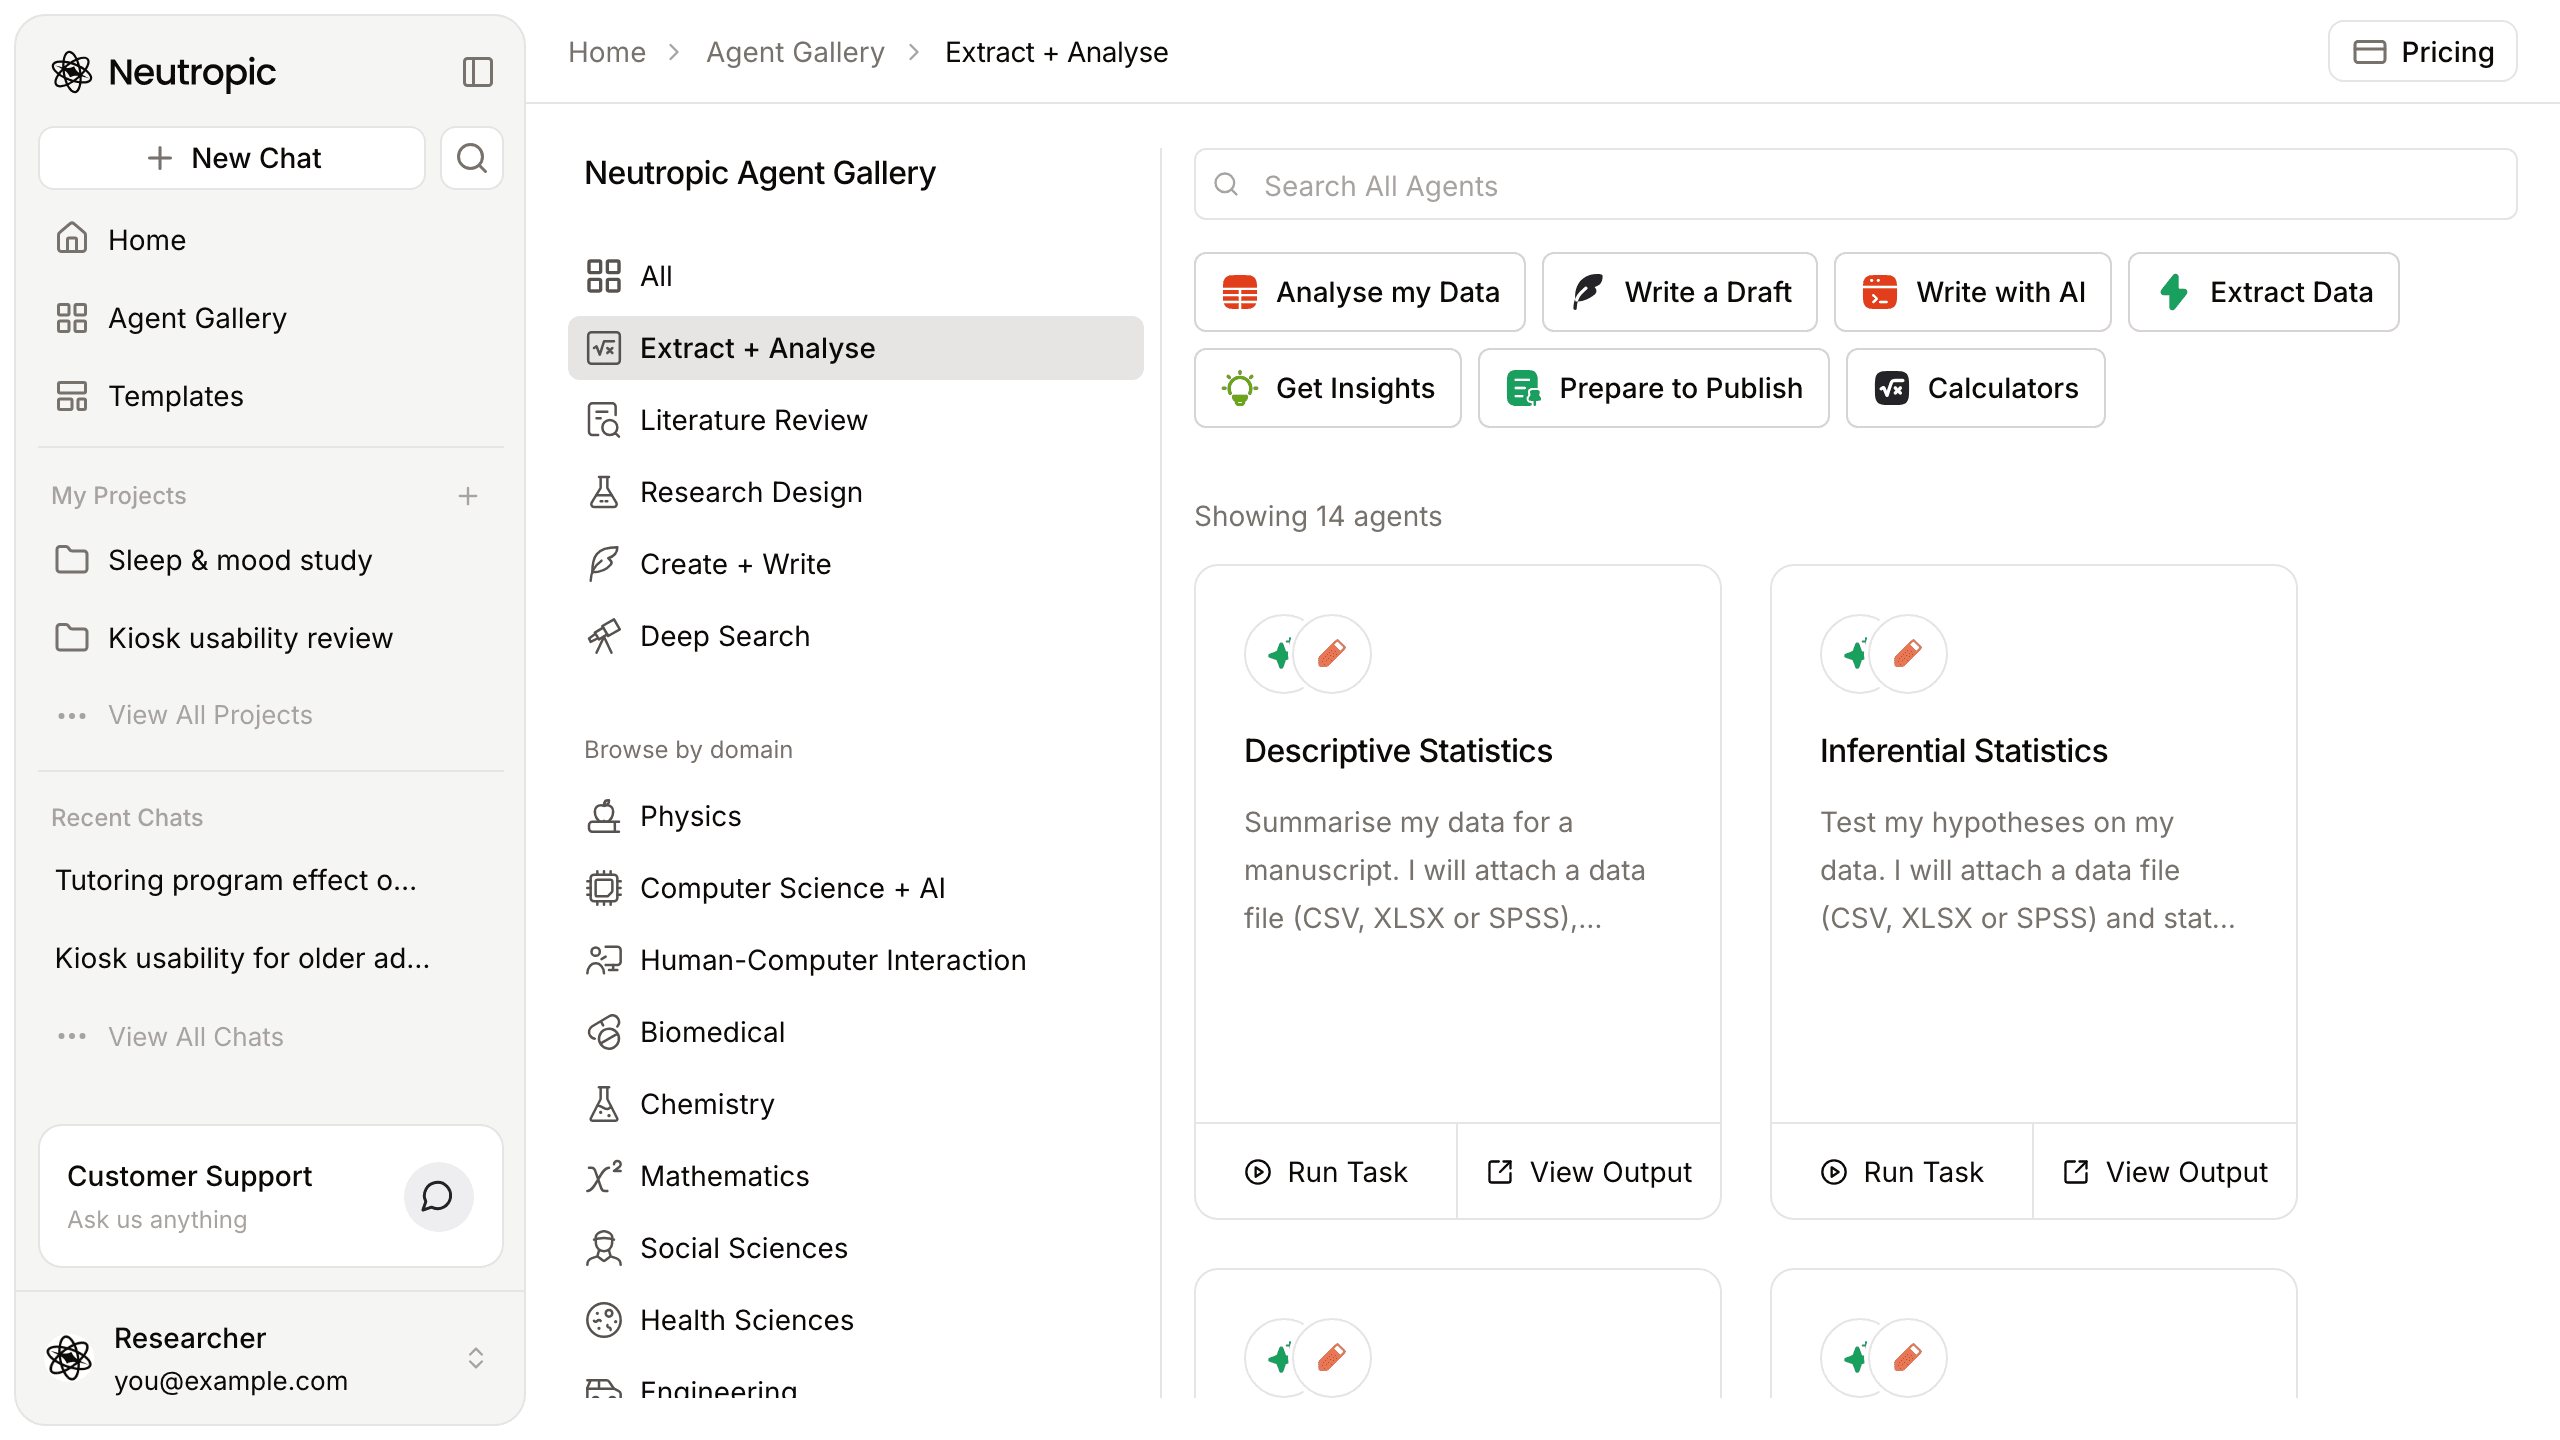
Neutropic 2.5 has one agent for each of those questions. All six live in the Extract + Analyse category of the Agent Gallery, all six take the same data files, and each one follows fixed steps so the same request is analysed the same careful way every time.
Which agent for which question
| Your question | Agent | What you get |
|---|---|---|
| What does my sample look like? | Descriptive Statistics | A Table 1 with summaries chosen by variable type, group columns with standardised mean differences, missing data, distribution figures and a sample-description paragraph |
| I don't know what to test yet | Exploratory Data Analysis | Data-quality problems ranked by severity, missing-data patterns, distributions and outliers, relationships (including ones that reverse within subgroups), clusters, and hypothesis candidates with the next analysis for each |
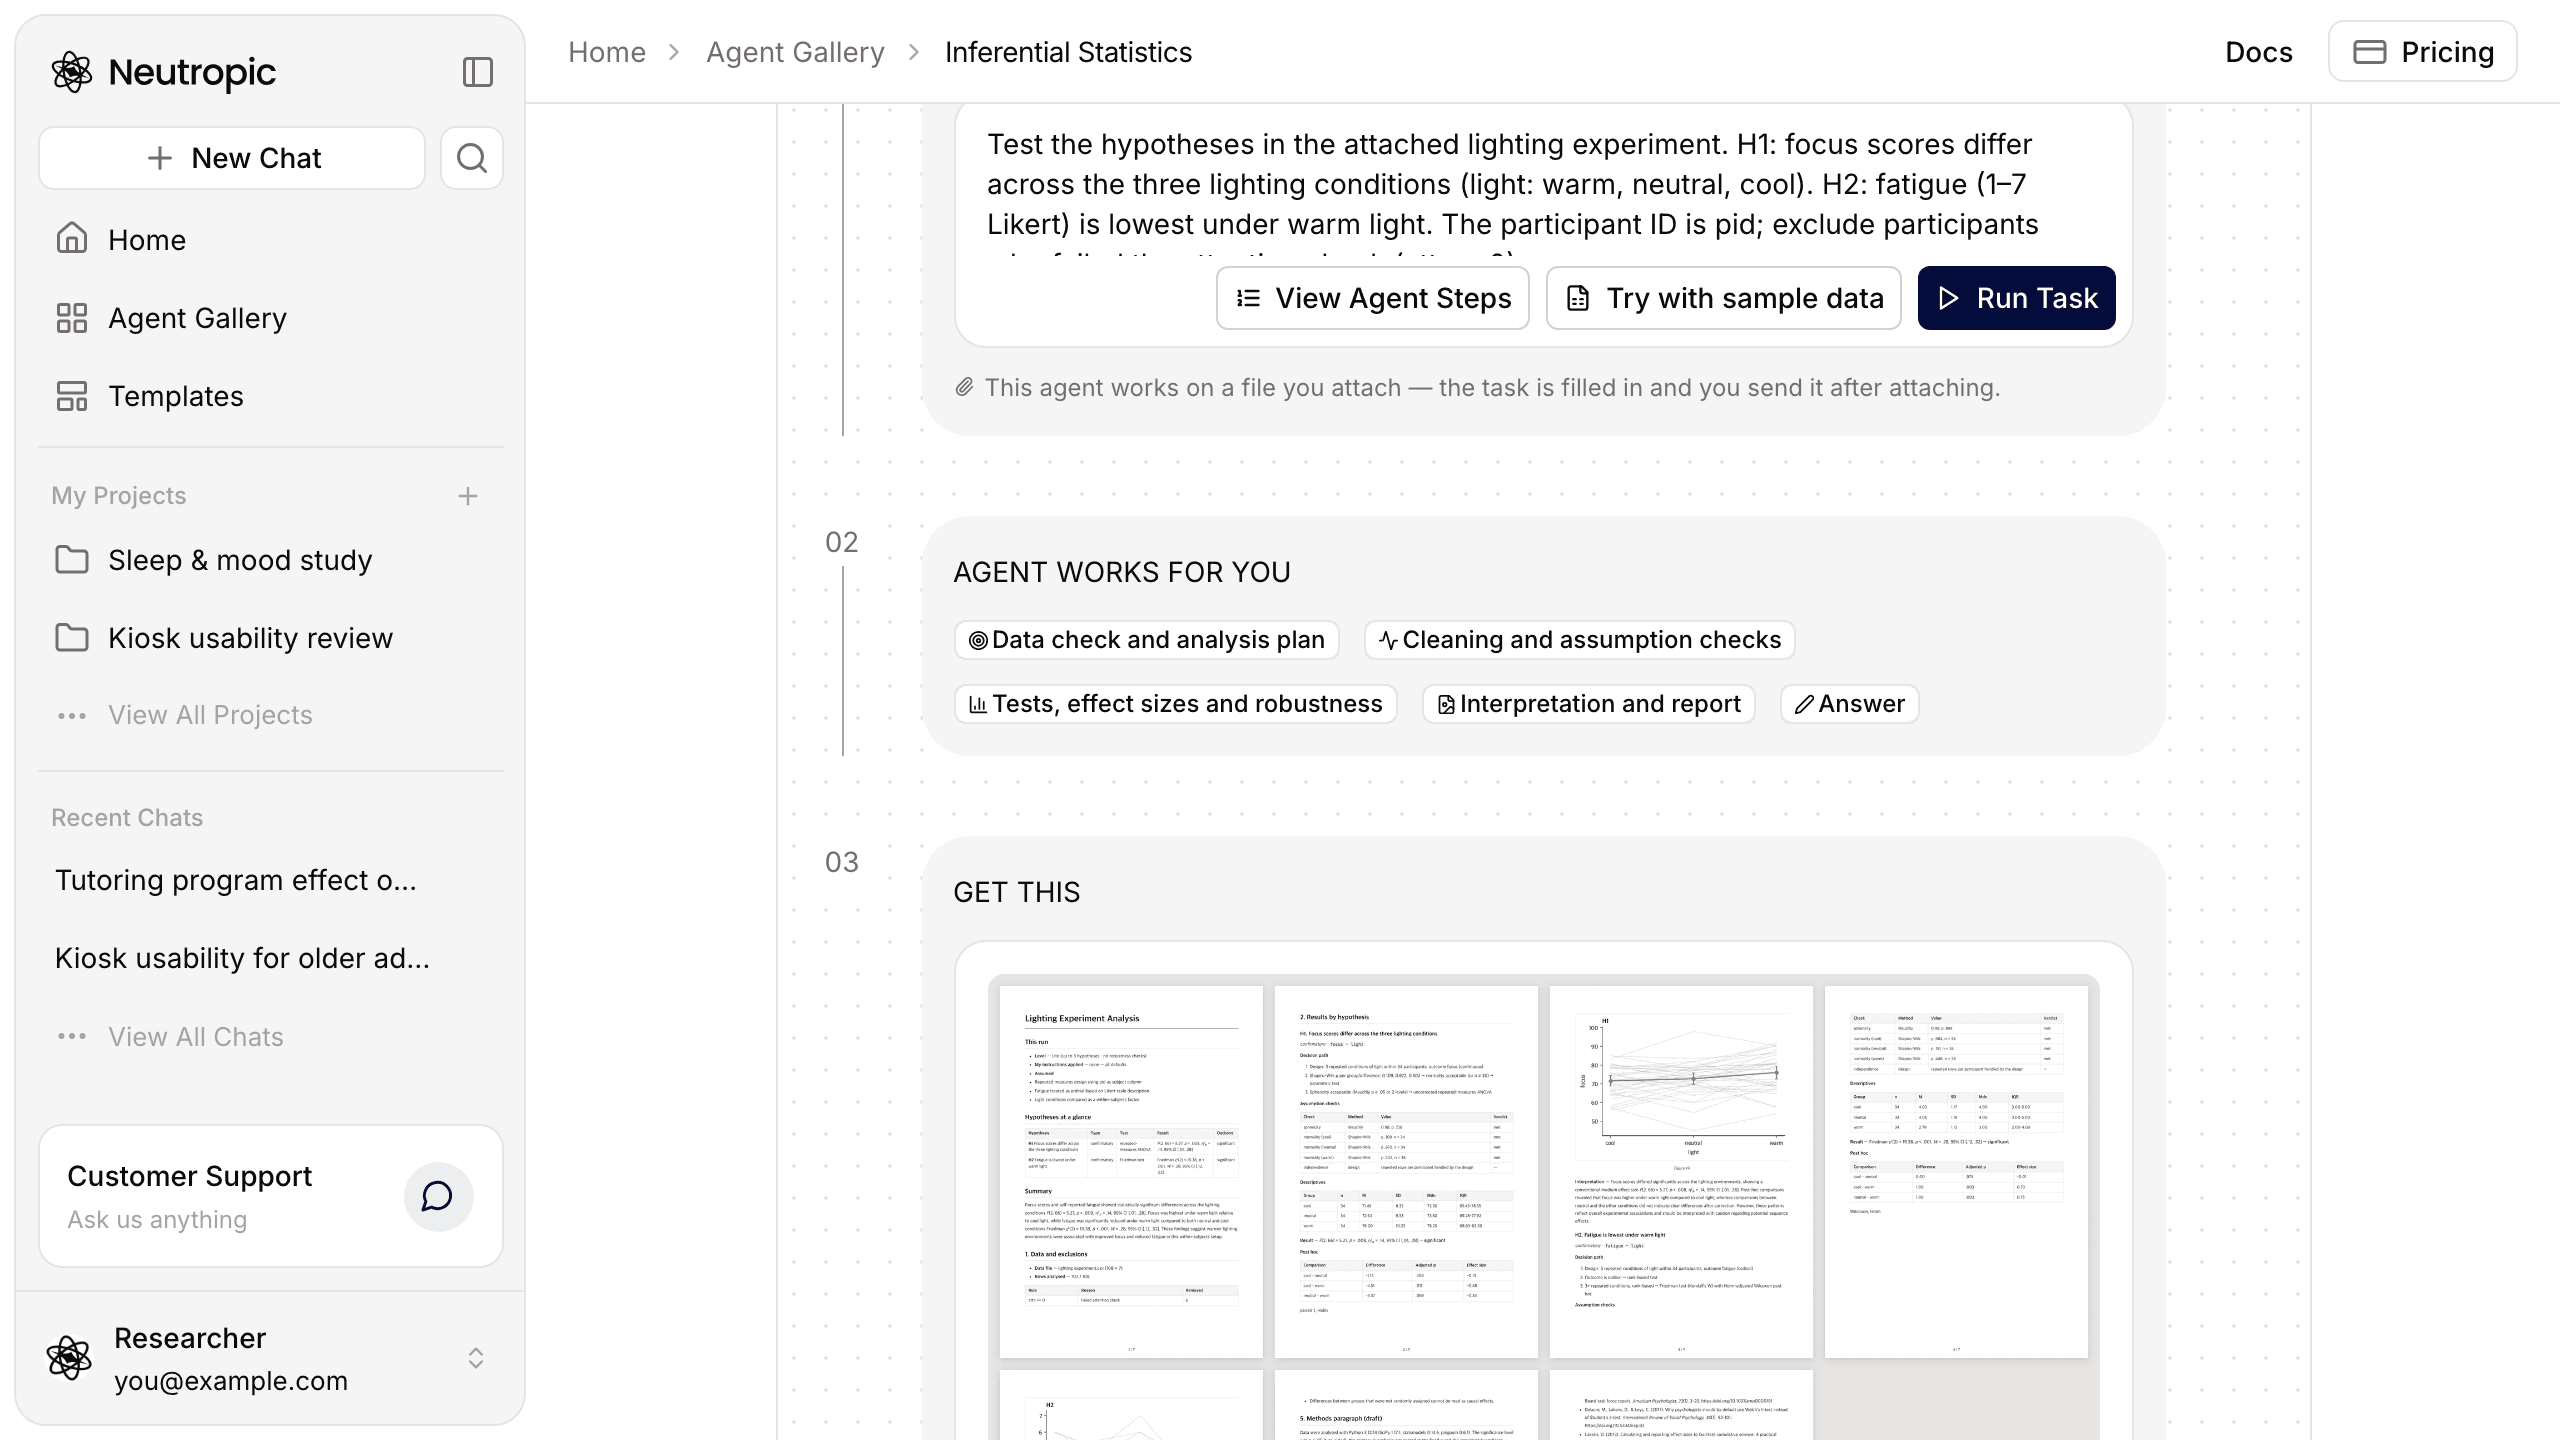
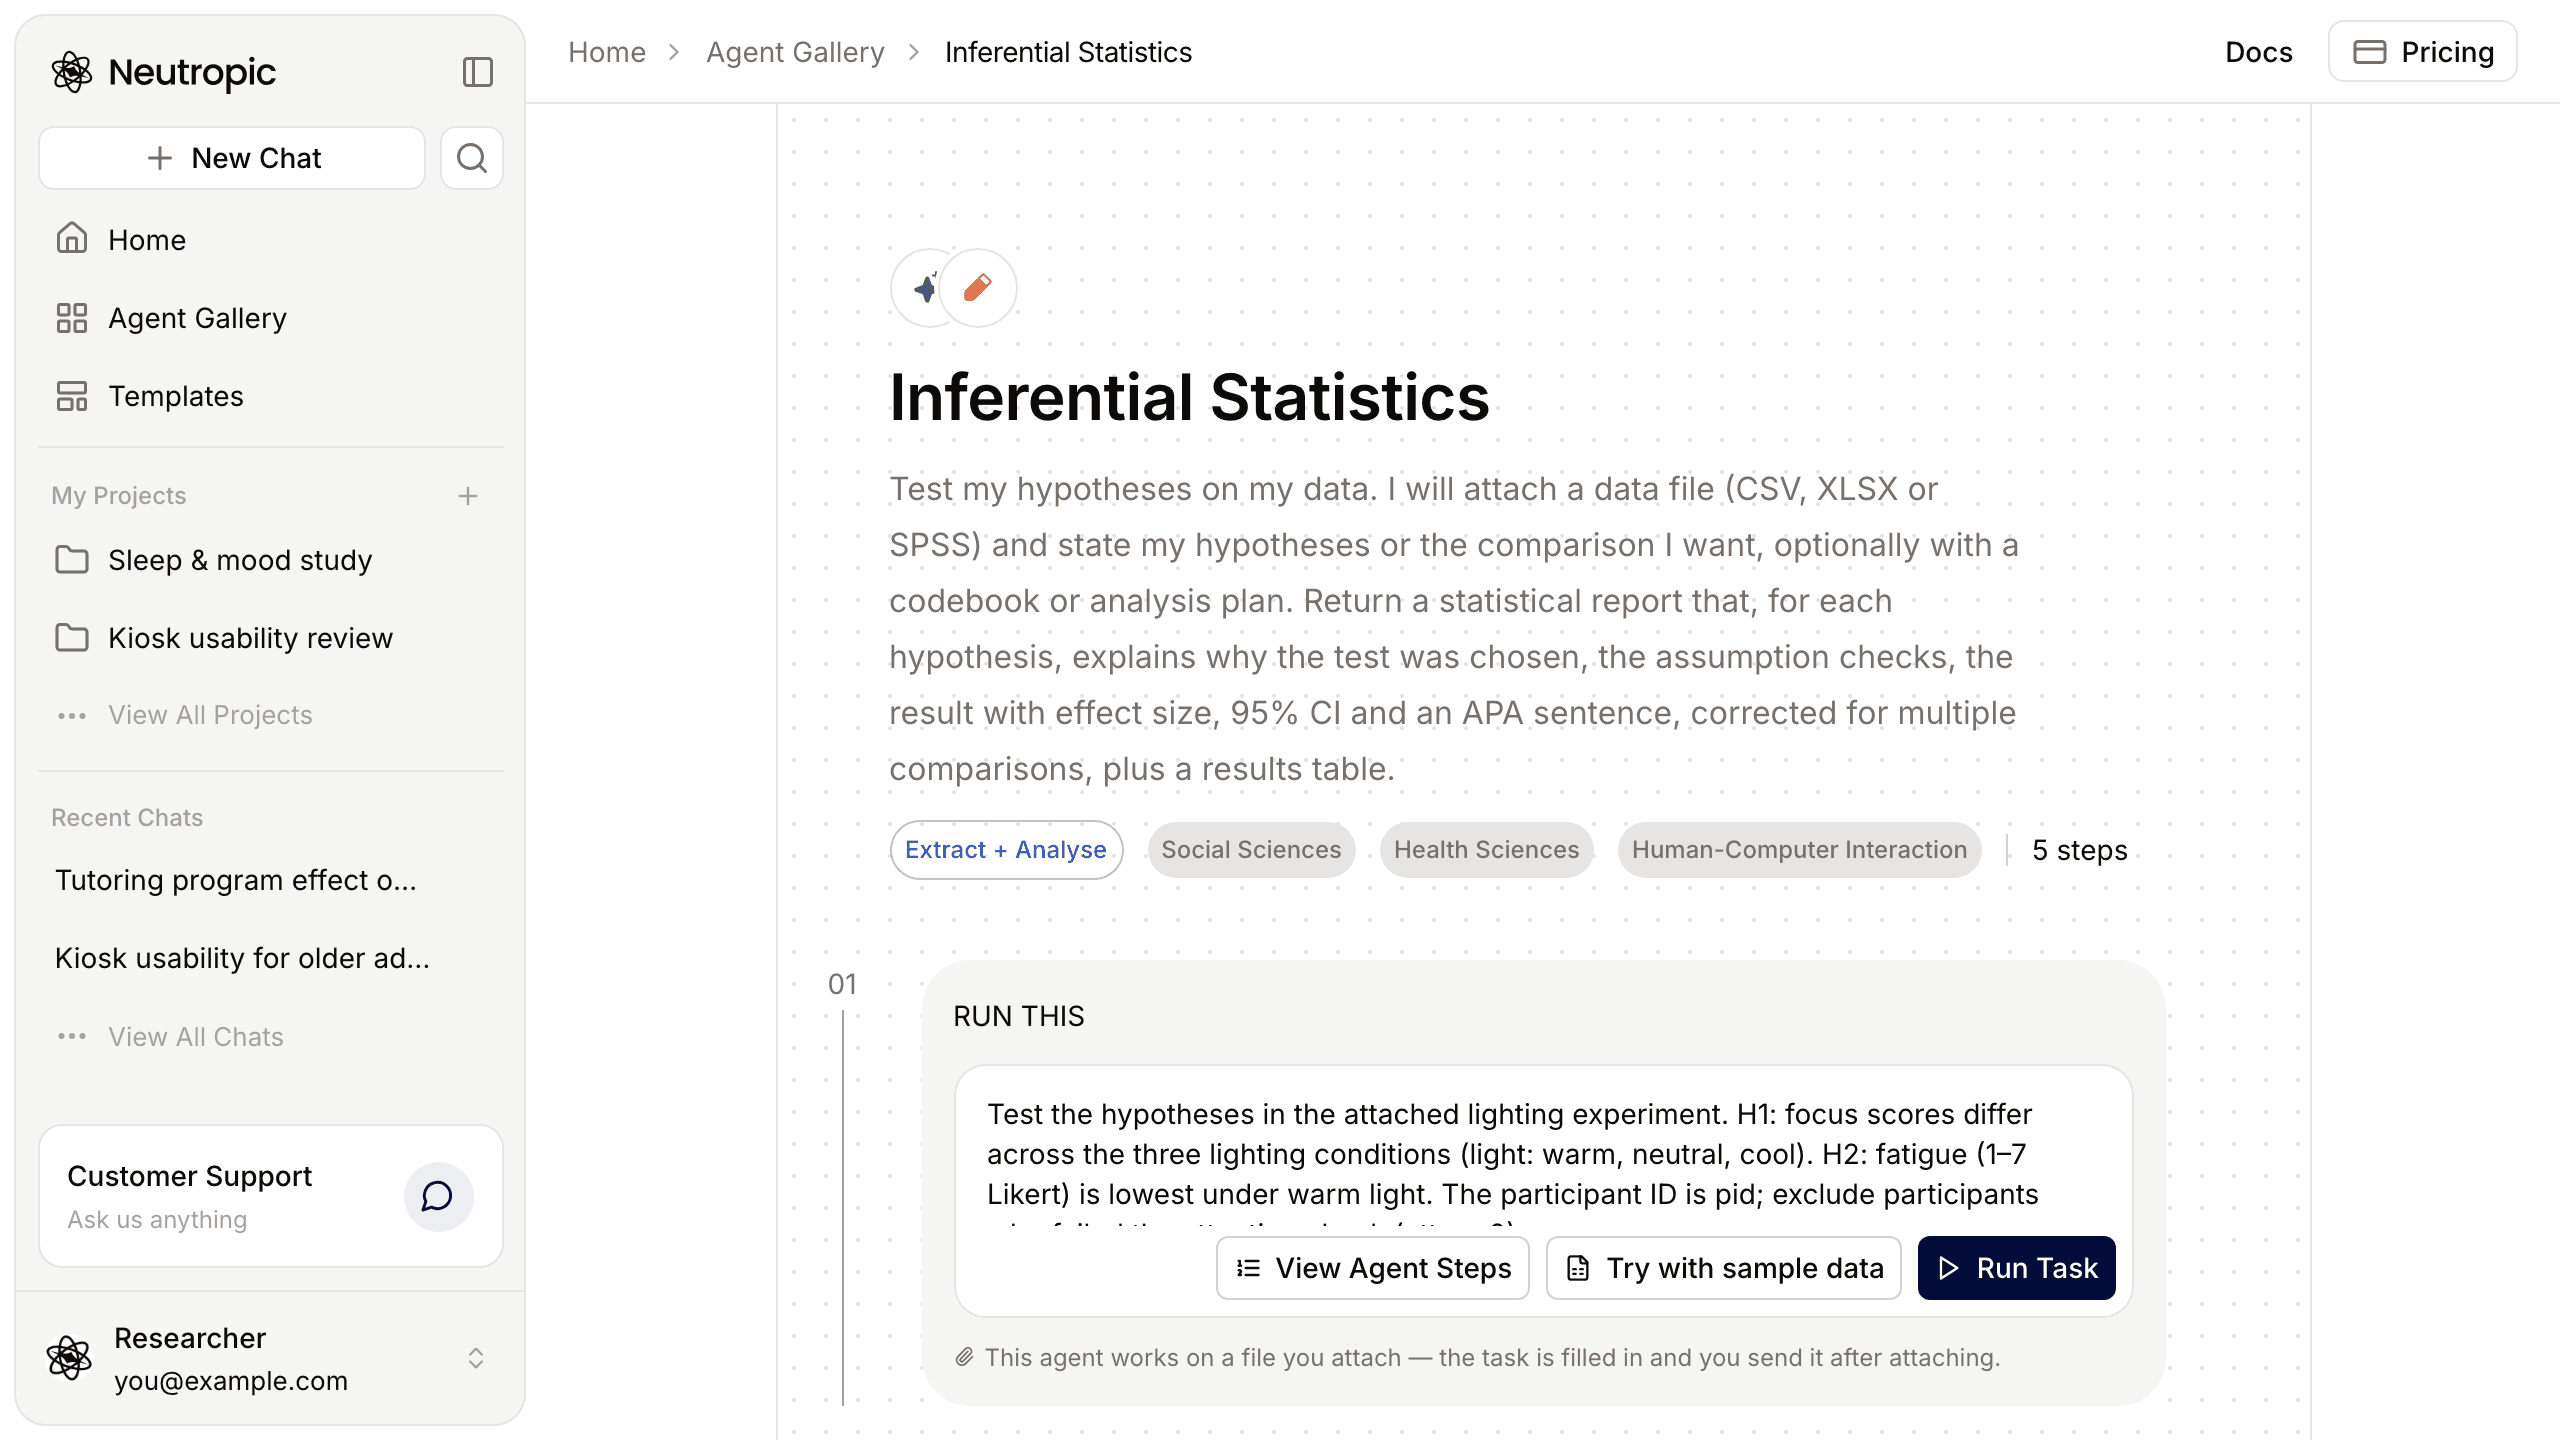
| Do my hypotheses hold? | Inferential Statistics | For each hypothesis: why the test was chosen, assumption checks, the result with effect size, 95% CI and an APA sentence, corrected for multiple comparisons |
| Did X cause Y, without random assignment? | Causal Analysis | A causal graph and adjustment set, a design that fits the data (doubly robust adjustment, difference-in-differences, regression discontinuity or an instrument), assumption checks, the effect with a CI, and sensitivity to unmeasured confounding |
| Who is likely to have the outcome? | Predictive Modeling | A leakage check, a baseline compared with penalised regression, random forest and gradient boosting on the same cross-validation splits, calibration, a threshold, what drives the predictions, subgroup performance and a TRIPOD+AI checklist |
| Which option should we choose? | Prescriptive Analysis | Evidence graded per option, expected net benefit or the best allocation of a limited resource, a simulation of how likely the recommendation is best, and which inputs would flip the decision |
Each agent returns two files: a report in Markdown and a spreadsheet (XLSX) with every number in the report — Table 1 sheets, results tables, model comparisons or scenarios, depending on the agent.
What the six have in common
The same files. Attach a data table — CSV, TSV, XLSX, SPSS .sav or Stata .dta — with + → Upload files, or point at it with @. A codebook helps: value labels, missing-value codes and category order are followed as written rather than guessed from column names. Inferential Statistics also follows a preregistration or analysis plan if you attach one. See Upload data & reference it.
The same shape. Each agent runs four analysis steps and then writes the answer. For Inferential Statistics they are Data check and analysis plan → Cleaning and assumption checks → Tests, effect sizes and robustness → Interpretation and report. You watch each step as it runs.
Numbers come from code. Every analysis runs as code, and each step keeps the code it ran in a box — click it to see the code and its output. The interpretation is written without the model typing numbers itself, so the figures in the text match the spreadsheet.
Assumptions are stated, not hidden. The report opens with the level used, the instructions applied and what was assumed — for example how a column was read when the task didn't say. It ends with decisions for you: the judgement calls that remain yours.
How they chain
The agents are built to pass results along. A typical path through one dataset:
- Exploratory Data Analysis first, when you don't yet know what to test. Its hypothesis candidates each come with the next analysis to run.
- Descriptive Statistics for the sample table every manuscript needs.
- Inferential Statistics for the hypotheses you stated in advance — or for the candidates from step 1, which should be treated as exploratory until confirmed with new data.
- Causal Analysis when the question is about an effect in observational data, or Predictive Modeling when the goal is to predict an outcome. The two answer different questions: important predictors are not causes.
- Prescriptive Analysis to turn those results into a decision. It grades the evidence behind each option — A for a randomised experiment, B for a causal estimate, C for a prediction or a comparison without random assignment, D for an assumption — and uses the effects and uncertainty from the earlier result tables directly.
Running them in one chat or one project keeps the files together, so a later agent can work from an earlier one's output:
Decide which onboarding to launch using the Inferential Statistics results table in this chat. About 200,000 users sign up each month; a user retained at day 7 is worth 4,000 KRW; keeping B running costs 1,200,000 KRW a month and C 3,000,000 KRW.
If you haven't collected data yet, start one step earlier with the Experimental Design agent, then attach its report so the analysis follows the plan.
Levels change depth, not steps
Pick a level next to Send: Lite, Pro, Expert or Max Thinking. Every level runs the same steps; higher levels handle more and check more. In Inferential Statistics, for example, Lite tests up to three confirmatory hypotheses, Pro adds alternative analyses and sensitivity analysis, Expert adds Bayes factors and a cross-check in R where R is available, and Max Thinking can run up to two custom analyses you ask for, marked as exploratory. Each agent's page lists exactly what changes.
Try with sample data
Every one of the six comes with an example task and a matching sample file — a well-being survey, a lighting experiment, an app user survey, student dropout records, an onboarding experiment and a tutoring programme. On the agent's page:
- View Output shows the result of a real run, so you can see what you will get before spending tokens.
- Try with sample data opens Home with the example task in the composer and the sample file already attached. Press send and watch it work.
What stays your call
Some judgements stay with you, and the reports say so:
- Variable roles and exclusions. Check the design reading and the exclusion criteria listed on the first page.
- Non-significant results are never written as "no effect": you get the effect size with its CI and the smallest effect the sample could detect.
- The causal graph. A causal estimate depends on its arrows. Tell the chat to change one and the analysis follows.
Get started
Open Extract + Analyse in the Agent Gallery, pick the question you are asking, and press Try with sample data to see a full run on realistic data. The template catalog documents every step and setting, and if your data are recordings rather than tables, see the biosignal analysis agents.