Physiological data rarely arrive analysis-ready. Before you can compare two conditions you have to find the bad channels, correct the missed beats, mark the movement, cut the recording into segments and decide which trials to keep — and then write down every one of those choices so a reviewer can follow them.
Neutropic 2.5 has eight agents that do this work for the most common signals in human-science labs: EEG Spectral Analysis, EEG ERP Analysis, ECG HRV Analysis, PPG Pulse Analysis, EDA Analysis, Facial Expression Analysis, Remote PPG (Face Video Heart Rate) and fMRI Analysis. Each starts from raw recordings and ends with a report and a metrics table, and each step shows the code it ran.
What each agent reads and measures
| Agent | Upload | Main measures |
|---|---|---|
| EEG Spectral Analysis | EDF, BDF, FIF, BrainVision, EEGLAB .set or CSV | Absolute and relative band power, peak alpha frequency, frontal alpha asymmetry, theta/beta ratio and the 1/f exponent, per condition |
| EEG ERP Analysis | The same formats, with stimulus markers | Mean and peak amplitude and latency of each component, per condition; grand averages, difference waves and topographies |
| ECG HRV Analysis | CSV, TSV, XLSX, EDF, BDF, FIF or BrainVision | Corrected R peaks; time-domain, frequency-domain and nonlinear HRV per condition |
| PPG Pulse Analysis | CSV, Empatica E4 BVP.csv with ACC.csv, or EDF | Pulse rate and pulse-rate variability (PRV) from corrected pulse peaks, with movement marked from the accelerometer |
| EDA Analysis | CSV, Empatica E4 EDA.csv or EDF | Tonic and phasic components, skin conductance level and slope, non-specific SCR rate and amplitude, and event-related SCRs after each stimulus |
| Facial Expression Analysis | Face videos (MP4, MOV, WEBM and more) | Approximate facial action units, emotion scores, valence and arousal per condition, as changes from each participant's baseline |
| Remote PPG (Face Video Heart Rate) | Face videos, optionally with a contact heart-rate file | Heart rate per condition from POS, with CHROM for comparison, signal-to-noise ratio, reliable windows and the error against a reference when given |
| fMRI Analysis | A BIDS dataset (ZIP) or 4-D NIfTI runs with event files | Image quality and head motion, motion correction and MNI registration, task activation (GLM) or resting-state connectivity, whole-brain group maps with FDR-corrected clusters and network comparisons |
Several files can go in one ZIP; it is unpacked and every file inside is read. Uploads can be up to 1 GB per file.
The same four steps for every signal
All eight follow one workflow:
- Data check and signal quality. The agent lists participants, conditions, sampling rate and length, then rates every recording pass / warn / fail — flat, noisy or poorly correlated channels and line noise for EEG; missing and flat samples, clipping and QRS quality for ECG; face visibility, size, lighting and head turns for video; tSNR and DVARS outliers for fMRI.
- Preprocessing and metrics. Filtering, artefact handling and the measures for that signal — ICA eye-component removal for EEG, ectopic-beat correction for ECG and PPG, tonic/phasic separation for EDA, motion correction and registration for fMRI.
- Comparisons and figures. Segments are averaged per participant and condition, then conditions and groups are compared with the test that matches the design (paired, repeated measures, between or mixed), with effect sizes and Holm correction. With fewer than three participants you get descriptives only, not tests.
- Interpretation and report. The results are interpreted without changing any number, with limitations and alternative explanations, and saved as a report (Markdown) and a metrics table (XLSX).
The report includes a methods paragraph ready for your paper, a reporting checklist and references. The metrics table has wide and long layouts per participant × condition, ready for SPSS, R or JASP.
Each step shows the code it ran
Signal analysis lives or dies on its parameters, so nothing is hidden. Every step in the chat keeps the code it ran in a box; click it to see the code and its output on the right. Every setting is also written into the methods section.
Events and participants tables
Two small tables tell the agent what was happening during a recording:
- An events table (
onset,duration,condition) splits each recording into condition segments. Aparticipantorfilecolumn matches rows to recordings. - A participants table (
participant,group) enables between-group comparisons.
Some agents read events directly from the recording. EEG ERP Analysis takes markers from annotations, a trigger channel or a marker column, and you can say what the event codes mean in the task. fMRI Analysis reads BIDS *_events.tsv files and participants.tsv; without event files a run is treated as resting state. Facial Expression Analysis uses a segment named baseline to express every condition as a change from the participant's own neutral face, and Remote PPG compares against a reference heart-rate file named after the video when you provide one.
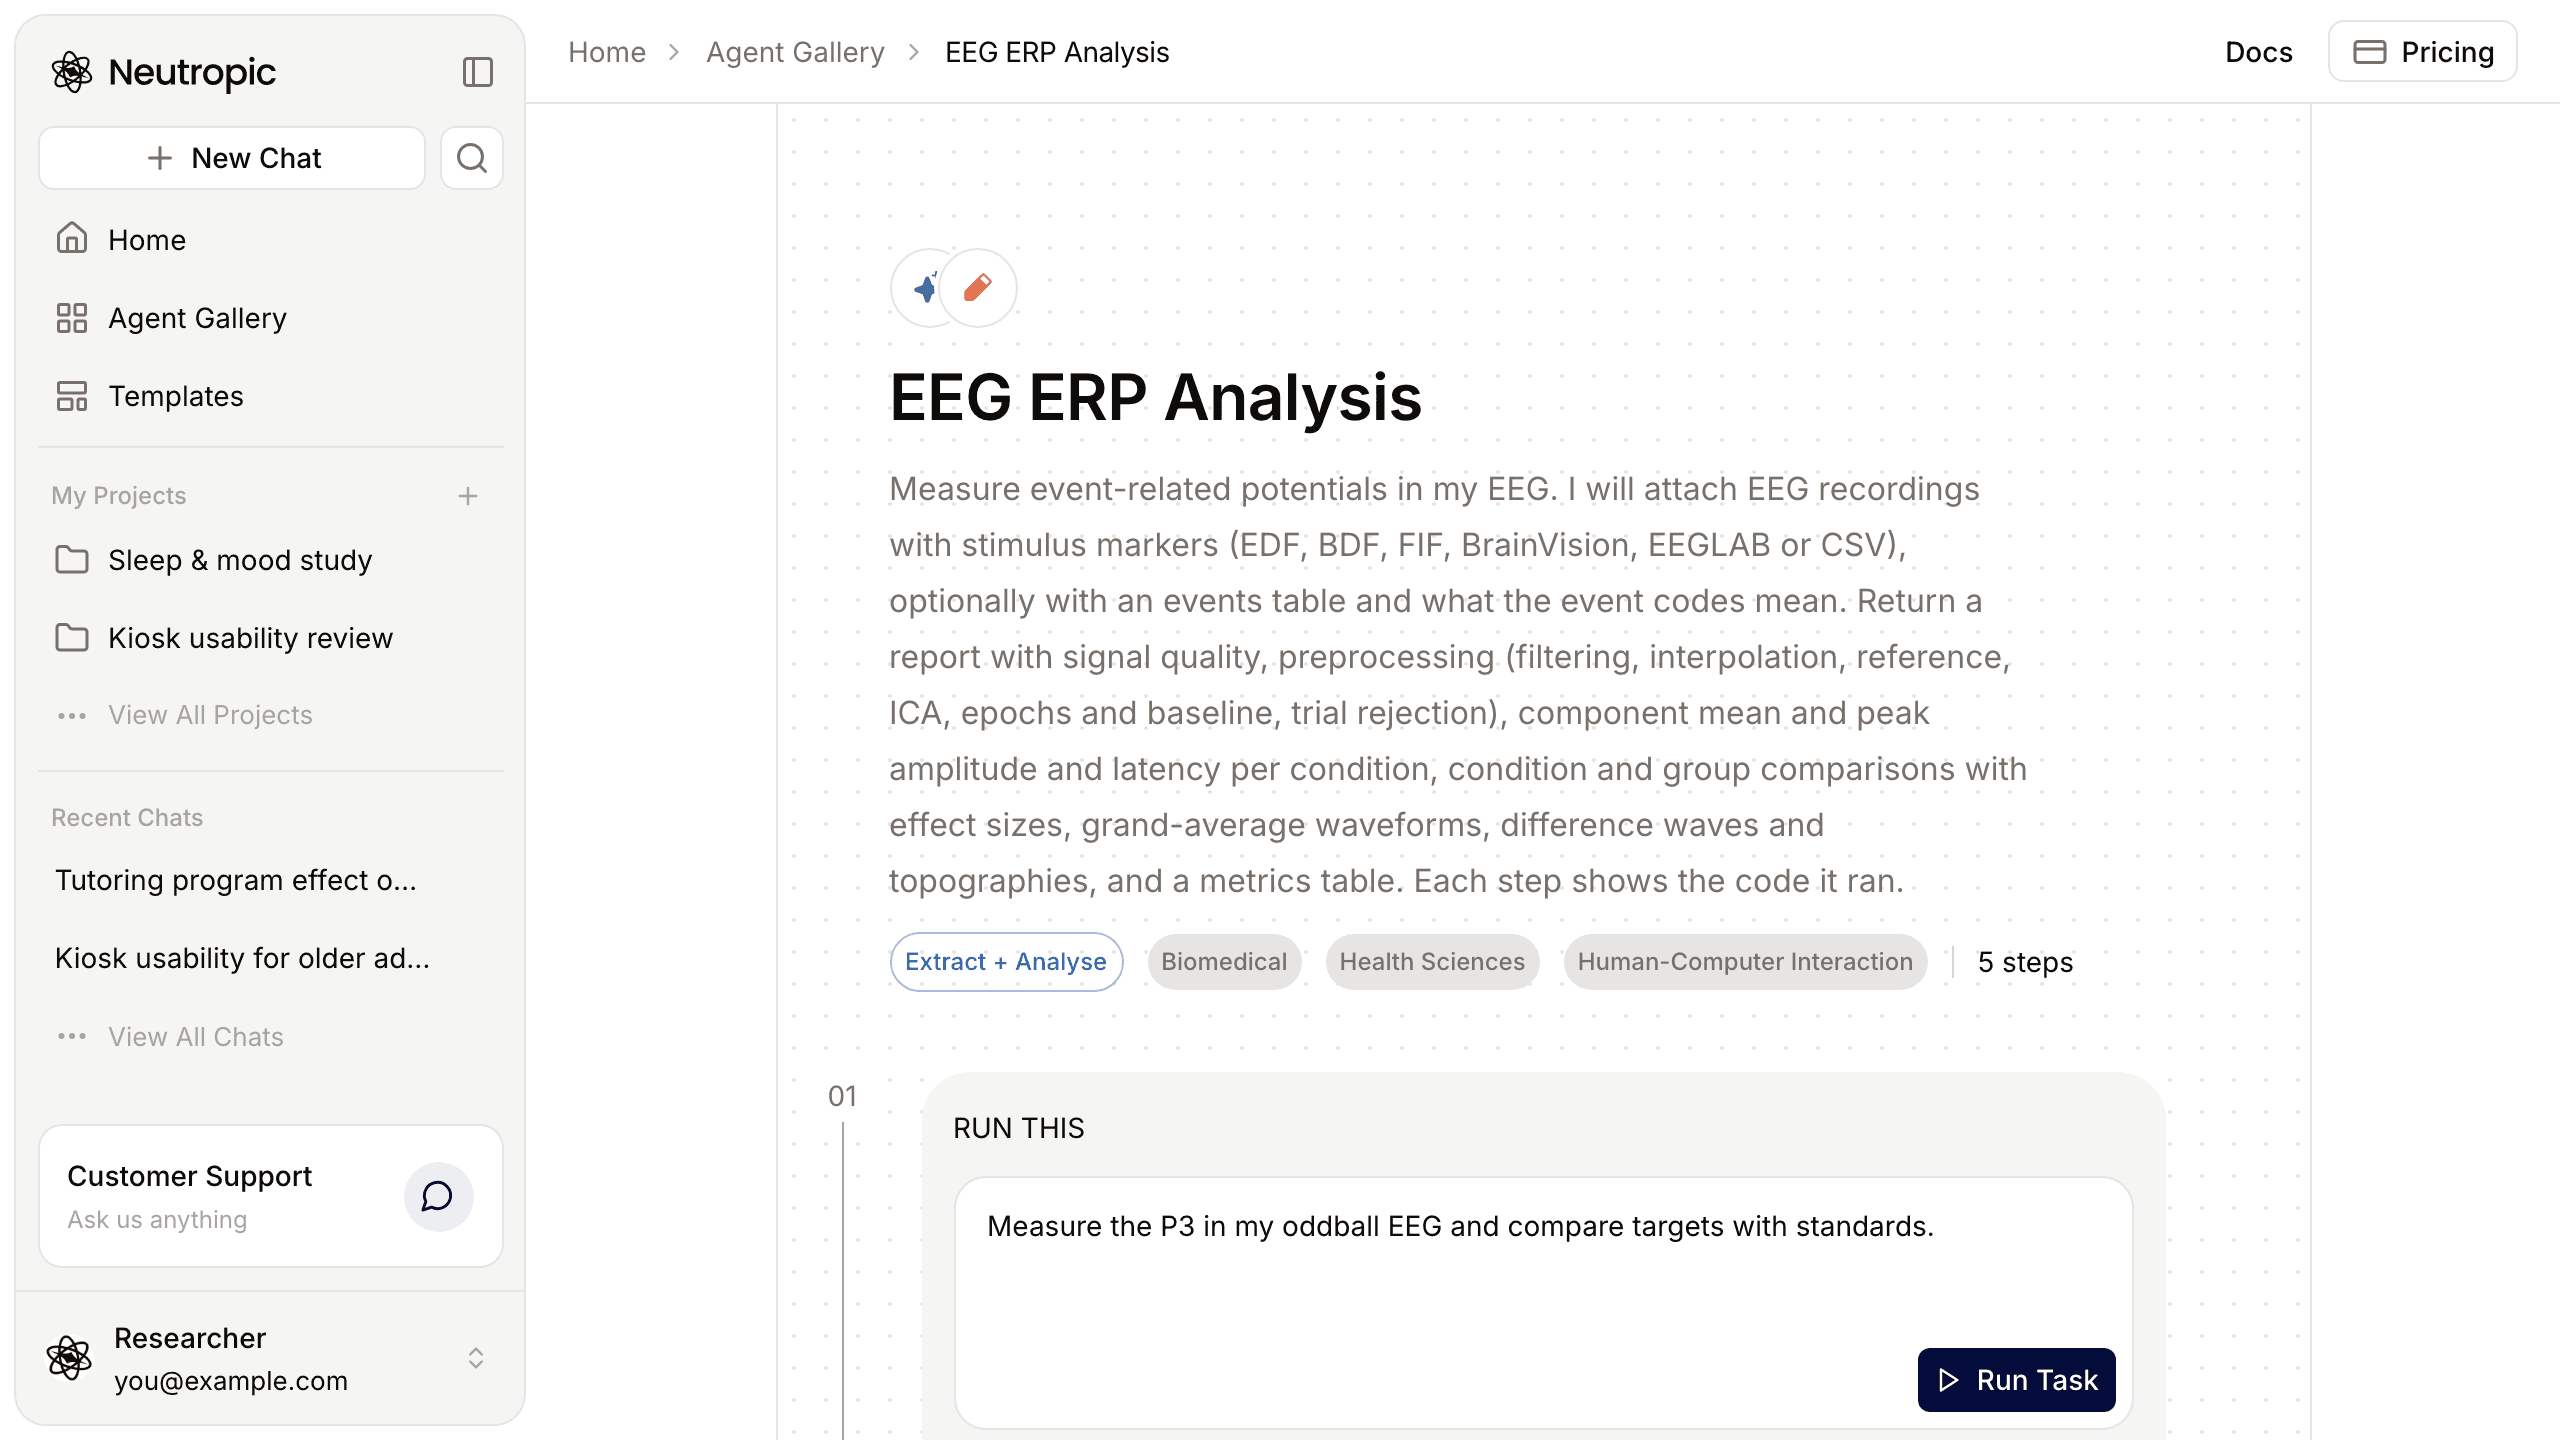
Measure the P3 in my oddball EEG and compare targets with standards.
Analyse pulse-rate variability in my wrist PPG recordings and compare the rest and stress conditions.
Face videos without face images
The two video agents are built for studies where participants' faces are sensitive data. Facial Expression Analysis and Remote PPG draw time courses, AU change maps, spectra and condition comparisons — never face images — and their reports contain no face images. In a video with several people, only the largest face is analysed.
Levels: from one file to a full study
Pick a level next to Send. Every level runs the same steps; higher levels handle more recordings and add checks.
| Lite | Pro | Expert | Max Thinking | |
|---|---|---|---|---|
| Participants or files per run | 1 | Up to 60 | Up to 120 | Up to 300 |
| Condition and group tests | Descriptives only | ✓ | ✓ | ✓ |
| Sensitivity analysis | — | — | ✓ | ✓ |
Some agents add their own differences: ICA eye-component removal for EEG starts at Pro; Facial Expression Analysis reads 2, 5 or 10 frames per second; Remote PPG samples the face video at 10, 15, 30 or 60 frames per second and adds a deep-learning pulse model (PhysNet) for comparison from Expert; fMRI handles 1, 40, 80 or 200 runs.
A research tool, not a diagnosis
These agents are for research analysis. They are not for clinical decisions, and the reports are written with that in mind:
- Expression measures are reported as facial movements, without claiming what participants felt.
- EDA is interpreted as arousal, not valence.
- PRV approximates HRV only at rest, and the PPG report states the difference.
- Remote PPG gives mean heart rate and its variation, not HRV — beat-to-beat intervals cannot be measured reliably from video.
- fMRI results are interpreted without reverse inference.
Heart rate or intervals already computed by a watch app are not raw signals and are not used — upload the raw PPG (BVP).
Get started
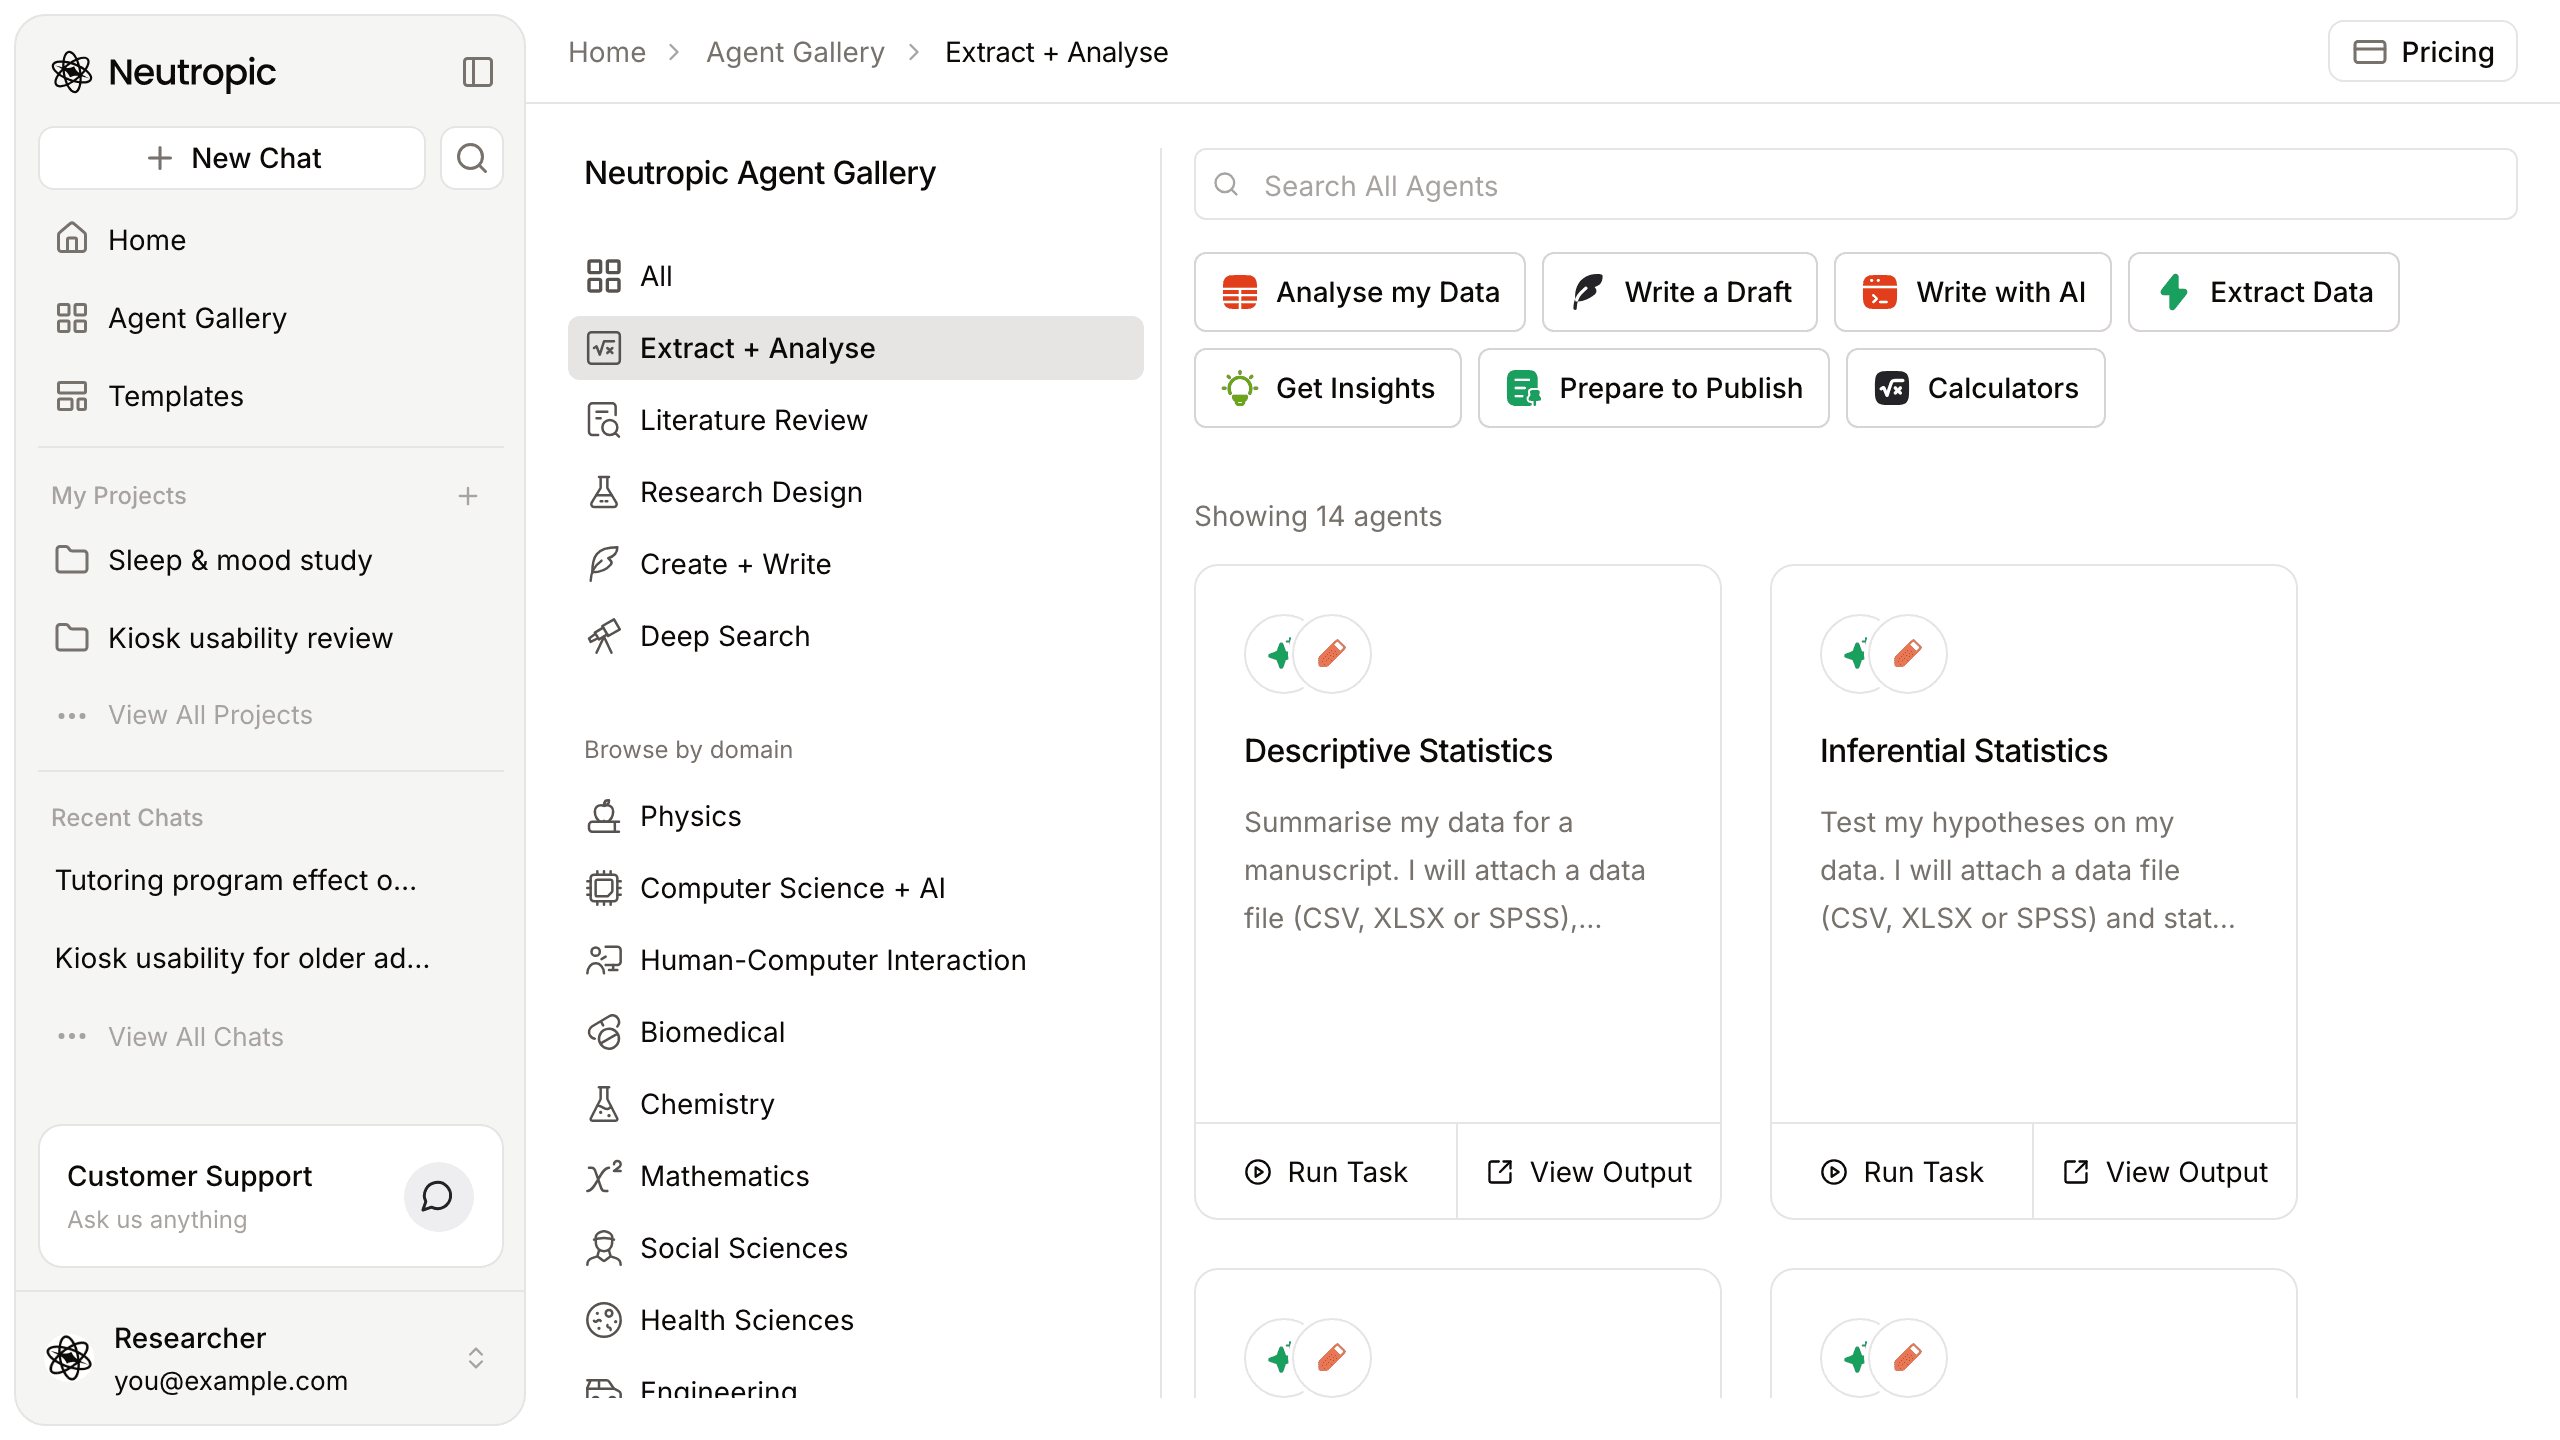
Open an agent from Extract + Analyse in the Agent Gallery and press Run Task. Home opens with the agent and its example task; attach your recordings with + → Upload files, add an events or participants table if you have one, edit the task and send. When the report is ready, the data-analysis agents can take the metrics table further, and every step and setting is documented in the template catalog.