Hi, this is the Neutropic team!
Comparing three groups is a grad-school rite of passage. The recipe most of us learned goes like this: run Levene's test; if variances look equal, use the classic ANOVA; if not, switch to something else. Then you try it, and whether Levene's p-value lands at 0.04 or 0.06 decides the whole analysis section of your paper. Is that really how it should work? 🥲
Methodologists point out that this two-stage procedure distorts error rates. When group sizes and variances differ, the classic F test is not robust, which is why there is a recommendation to use Welch's ANOVA by default (Delacre et al., 2019). The catch is that even knowing this, running it, adding post-hoc comparisons and effect sizes, and writing it up can eat a day.
In this post we follow Riley, an education master's student comparing three teaching methods. Riley is fictional, but every screen below comes from a real run in Neutropic.
Riley described the data structure in one sentence
The file was teaching_methods.csv: 120 students, one row each, with teaching method (lecture, discussion or project), final score and age. Riley opened the Agent Gallery, picked the Inferential Statistics agent, attached the file and wrote:
Using the attached data, test whether final scores (score) differ by teaching method (method). Each person is one row.
The last sentence is what makes this a good request. "Each person is one row" tells the agent this is a comparison of independent groups, not repeated measures. Naming the columns in brackets helps too: there is no doubt about which is the outcome and which is the grouping variable.
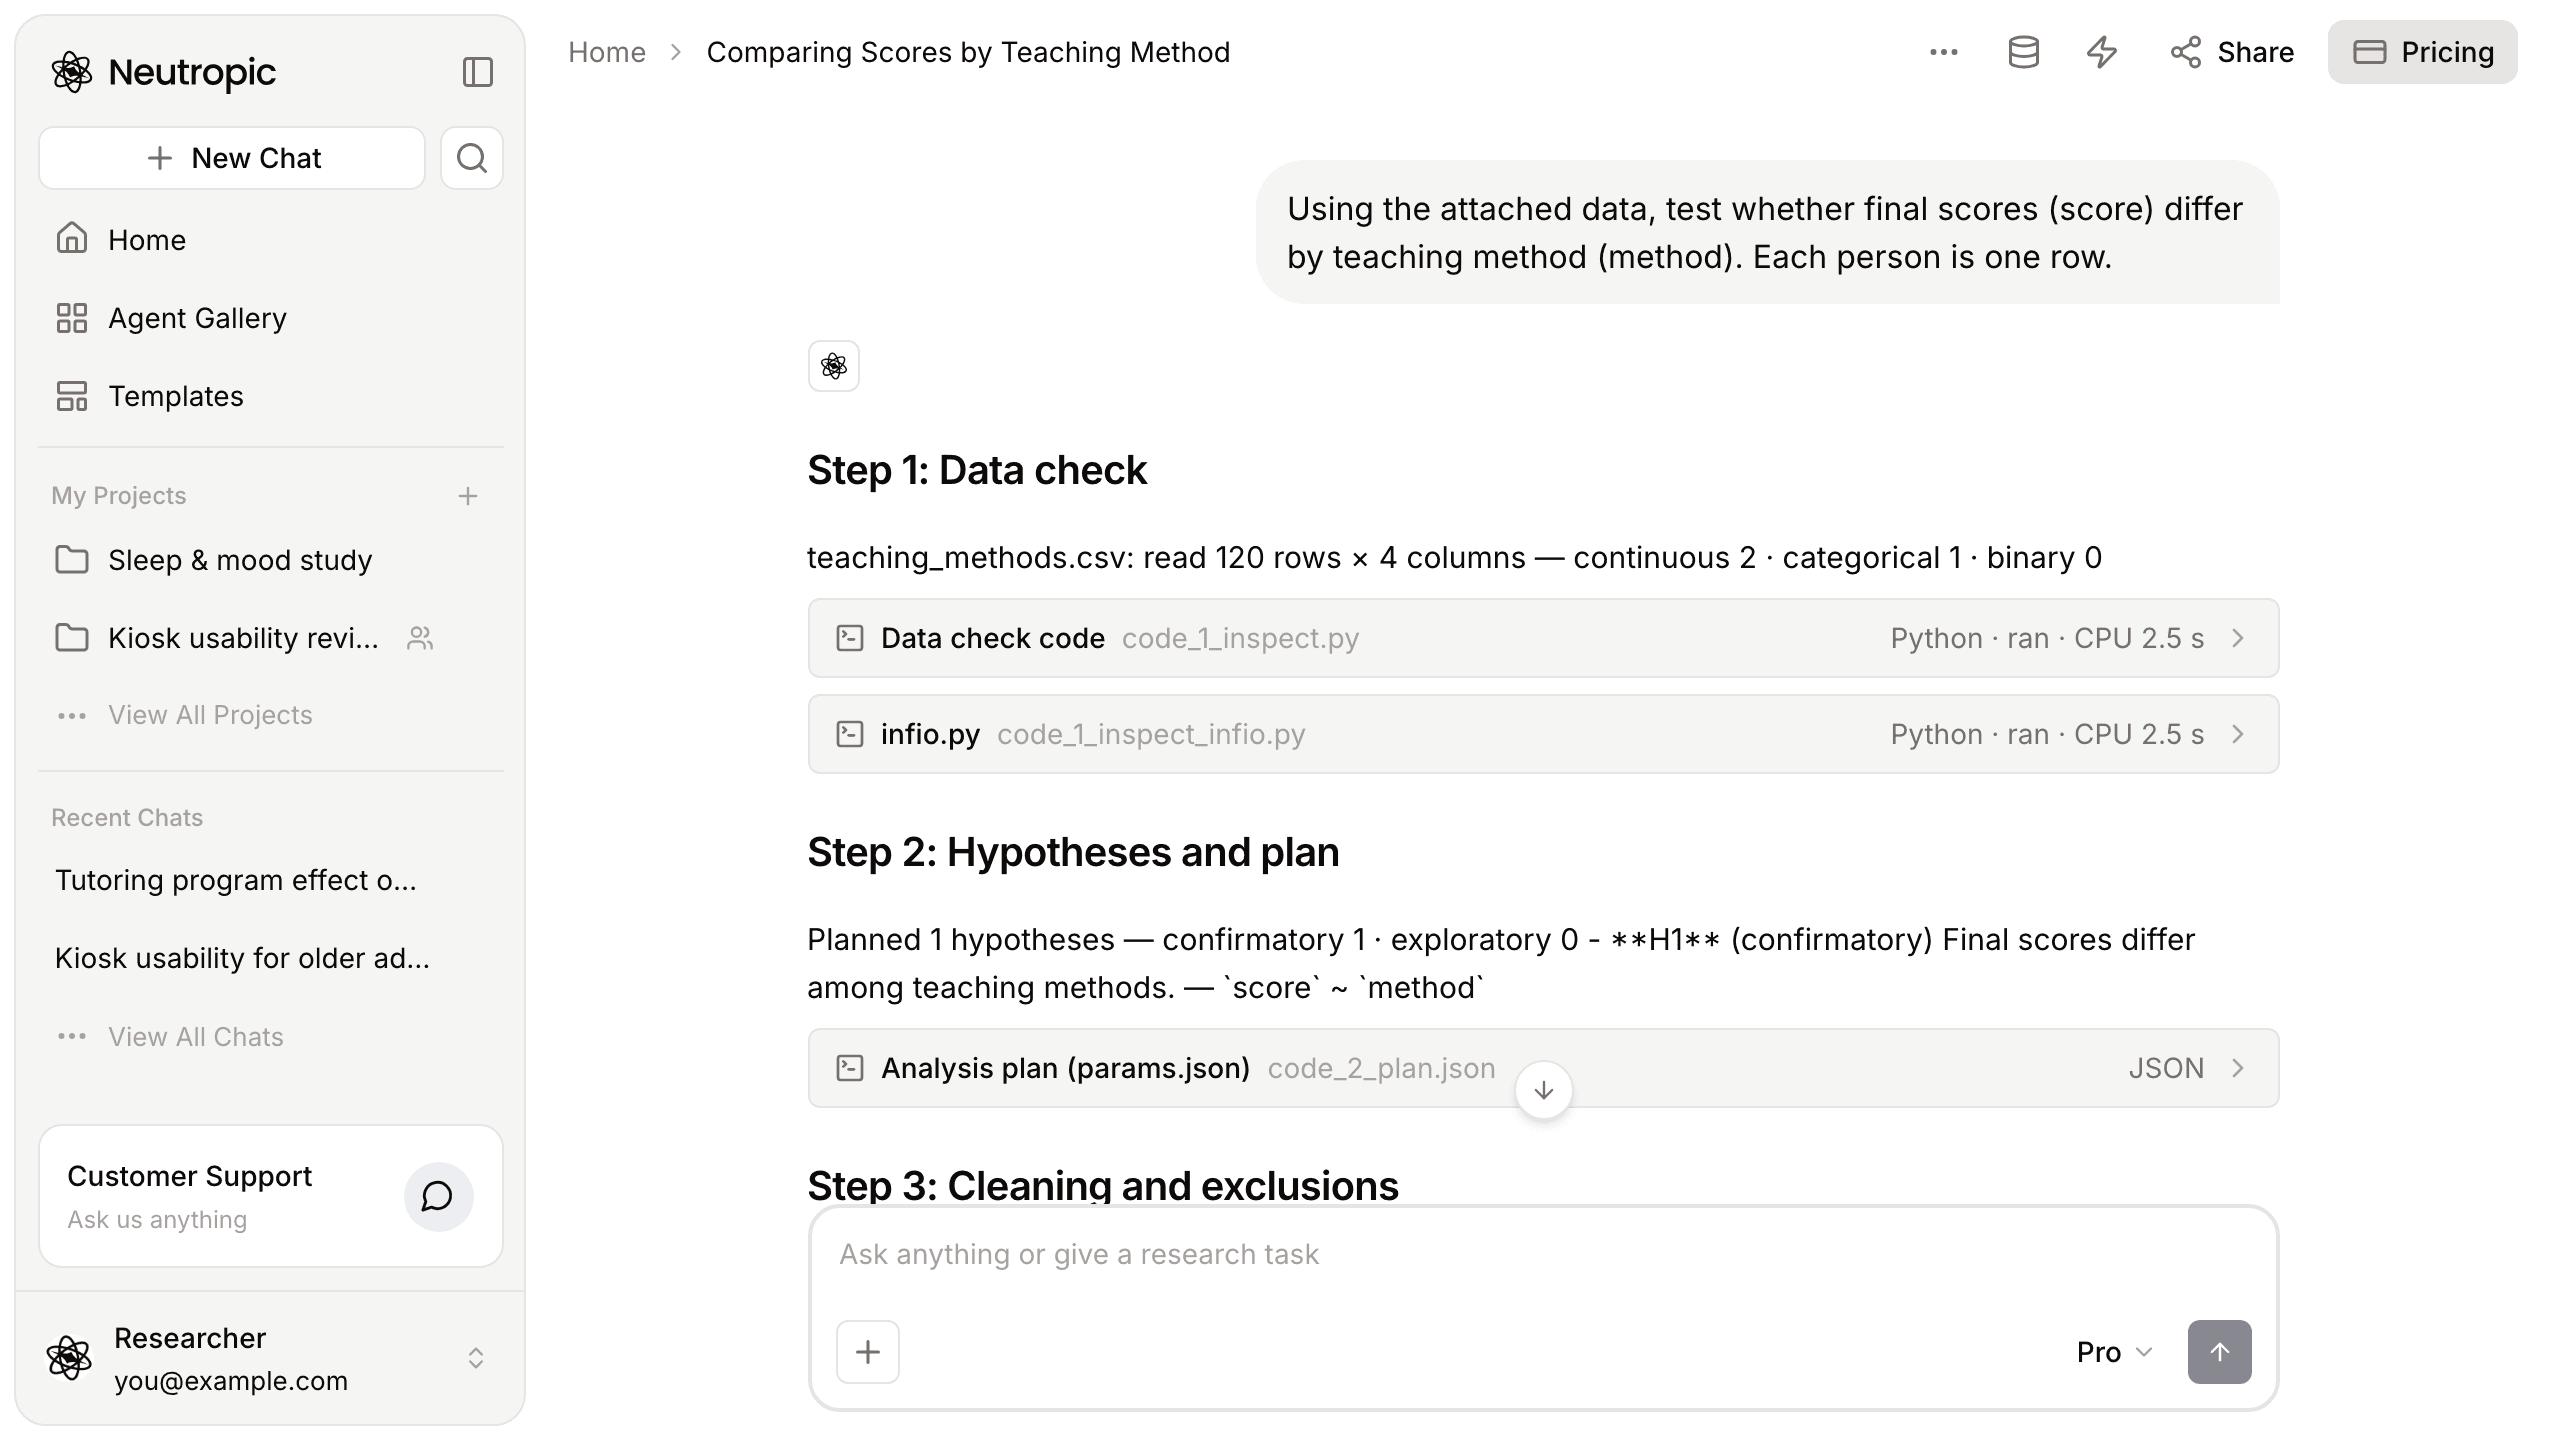
It wrote down the hypothesis first
The agent worked through eight fixed steps. Data check read 120 rows × 4 columns. Hypotheses and plan set one confirmatory hypothesis: "H1 Final scores differ among teaching methods — score ~ method". Cleaning and exclusions kept all 120 rows, with no exclusion rules.
Writing the hypothesis down before any testing looks minor, but it stops you from reshaping the hypothesis after seeing the results.
The variances differed, but that did not choose the test
Step four, Assumption checks, came back "met 3 · violated 1". When we opened the file, the group standard deviations were 5.5 for lecture, 8.0 for discussion and 11.5 for project, more than a twofold spread. The equal-variance assumption did not hold.
The old recipe would switch tests here. Instead, the agent reported the check and, in step five, Tests, ran the Welch's ANOVA it had planned all along. Same test whether variances are equal or not, so Levene's p-value never gets to steer the analysis.
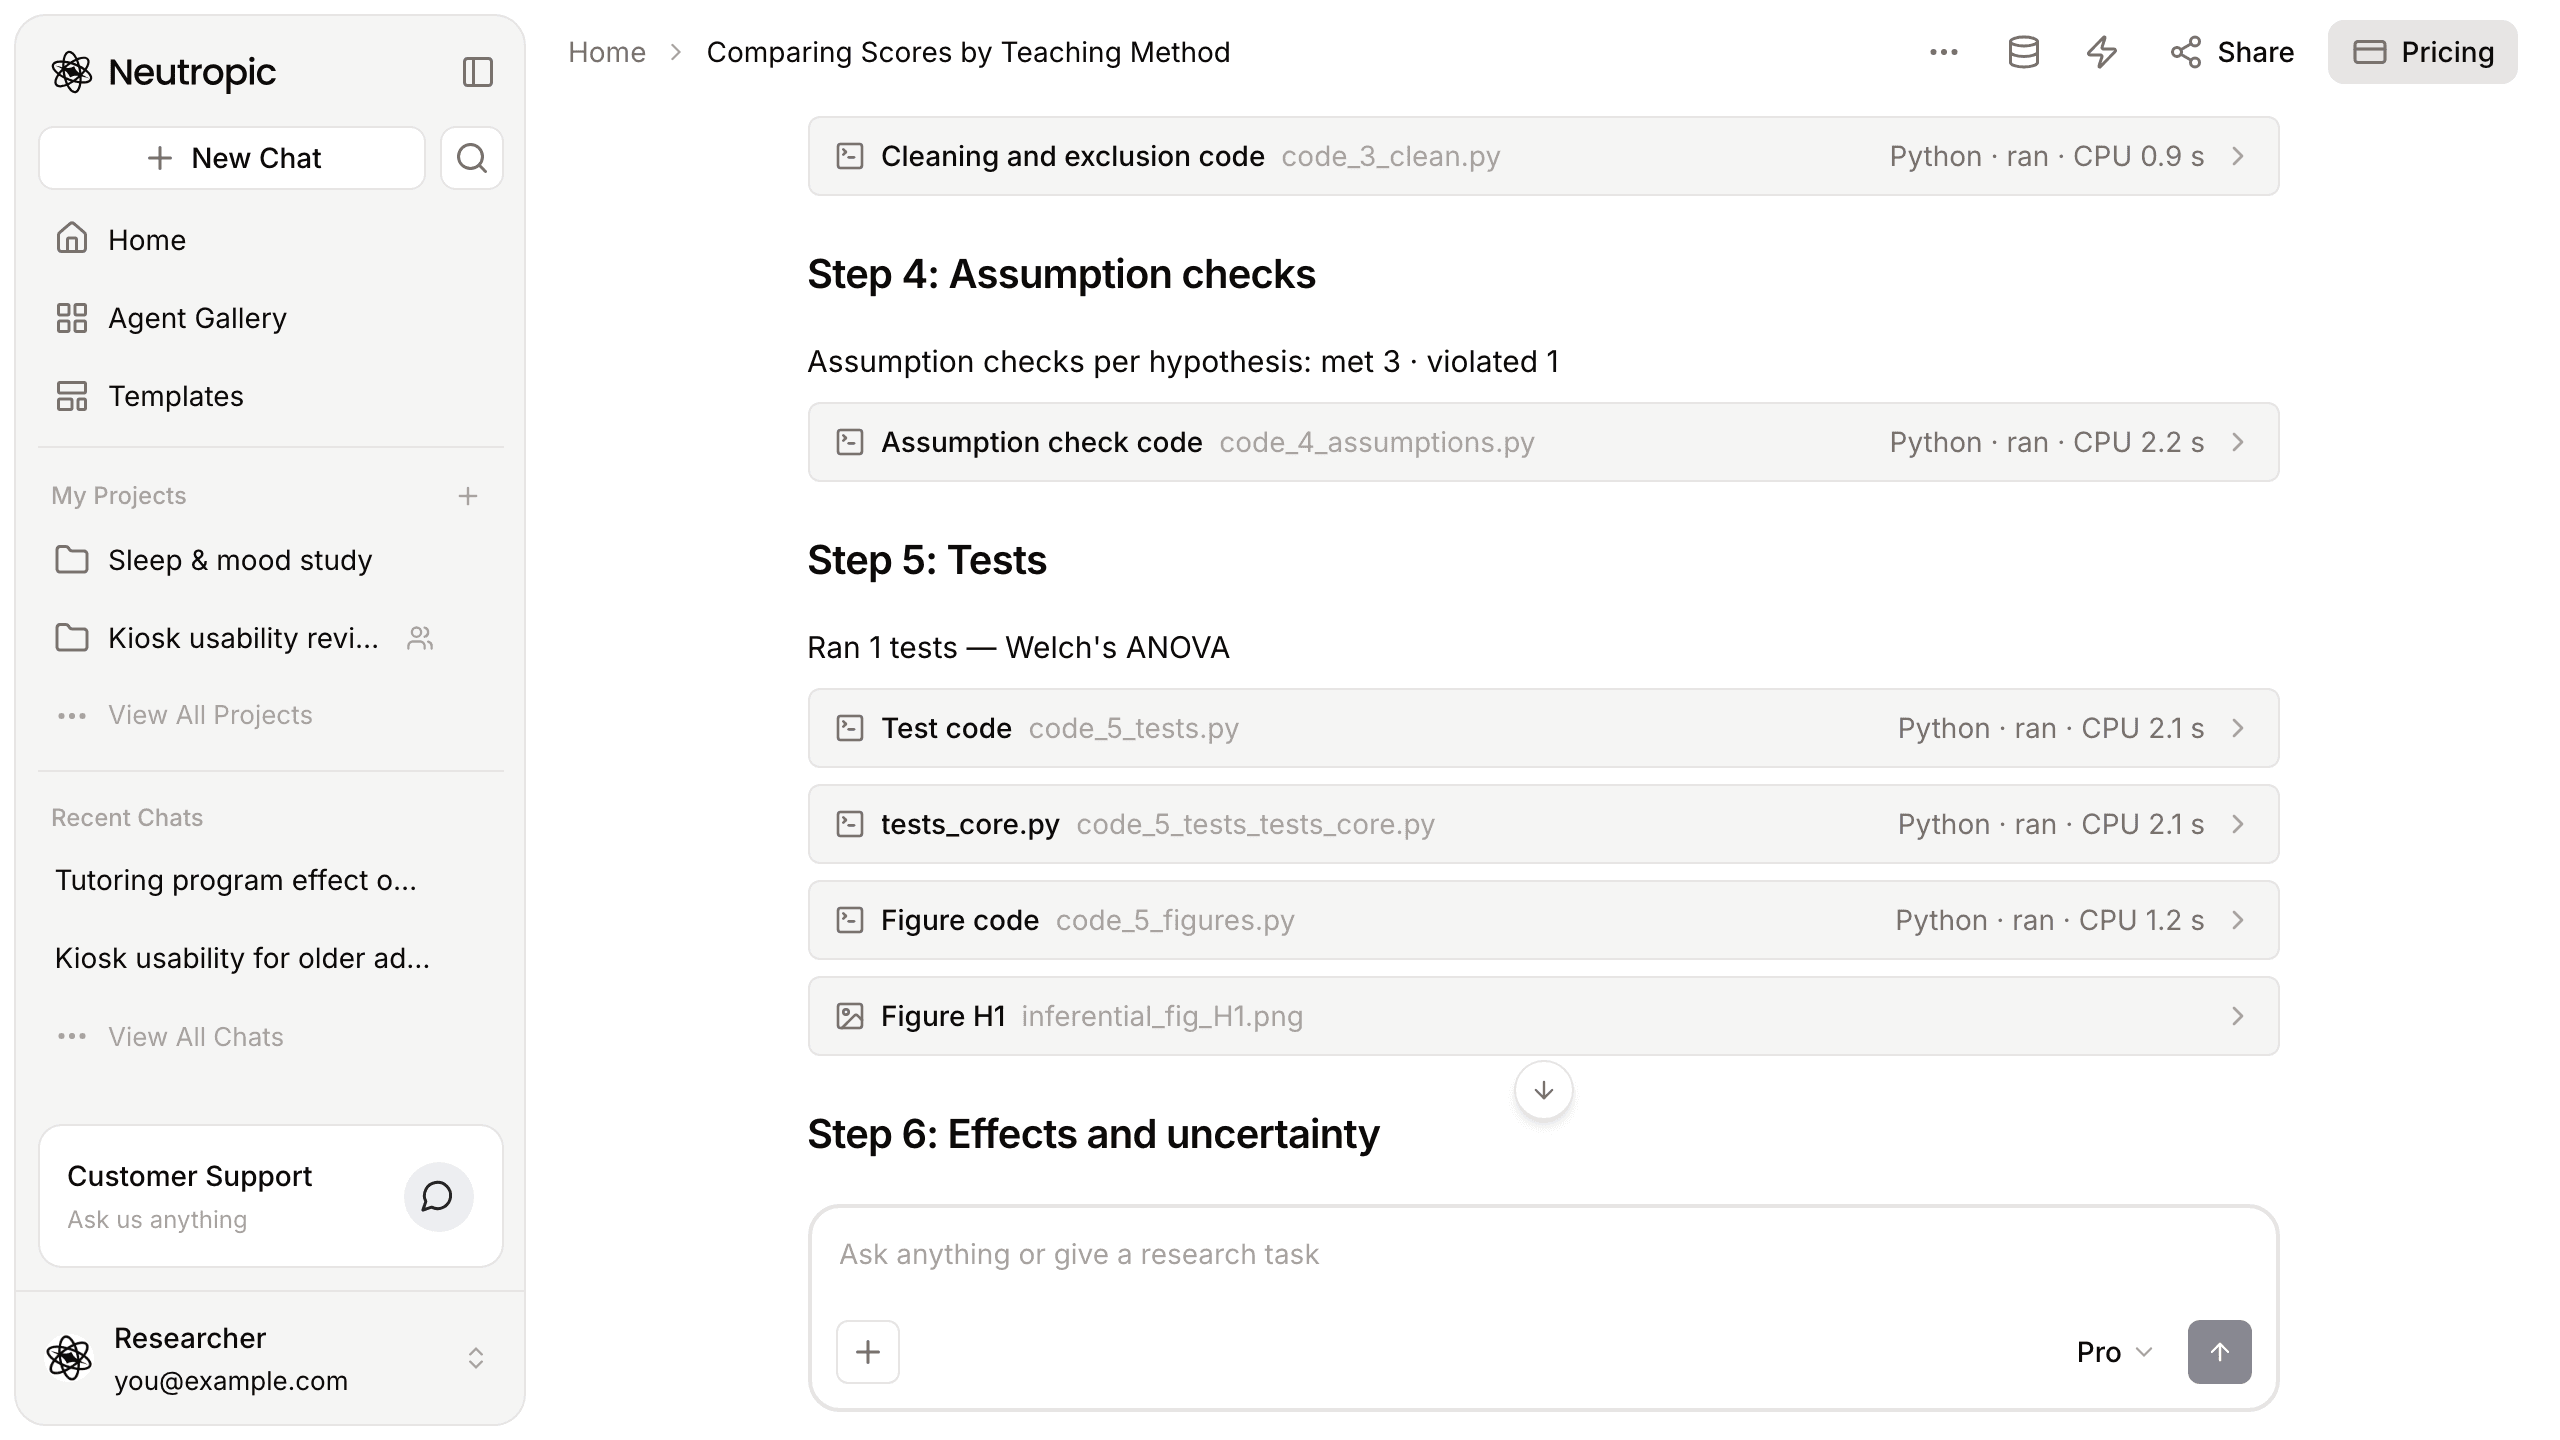
Scores differed by teaching method
Effects and uncertainty reported the result as significant after correction, with no mismatch in the statistical consistency check. Robustness found that 1 of 1 alternative analyses, a rank-based one, kept the conclusion. The answer summed it up: discussion and project both scored higher than lecture after correction, while discussion and project showed no clear difference.
We re-ran Welch's ANOVA ourselves on the same file: *Welch's F(2, 72.29) = 12.35, p* < .001, partial η² = .16**, and Games–Howell comparisons showed the same pattern of pairs. 😎
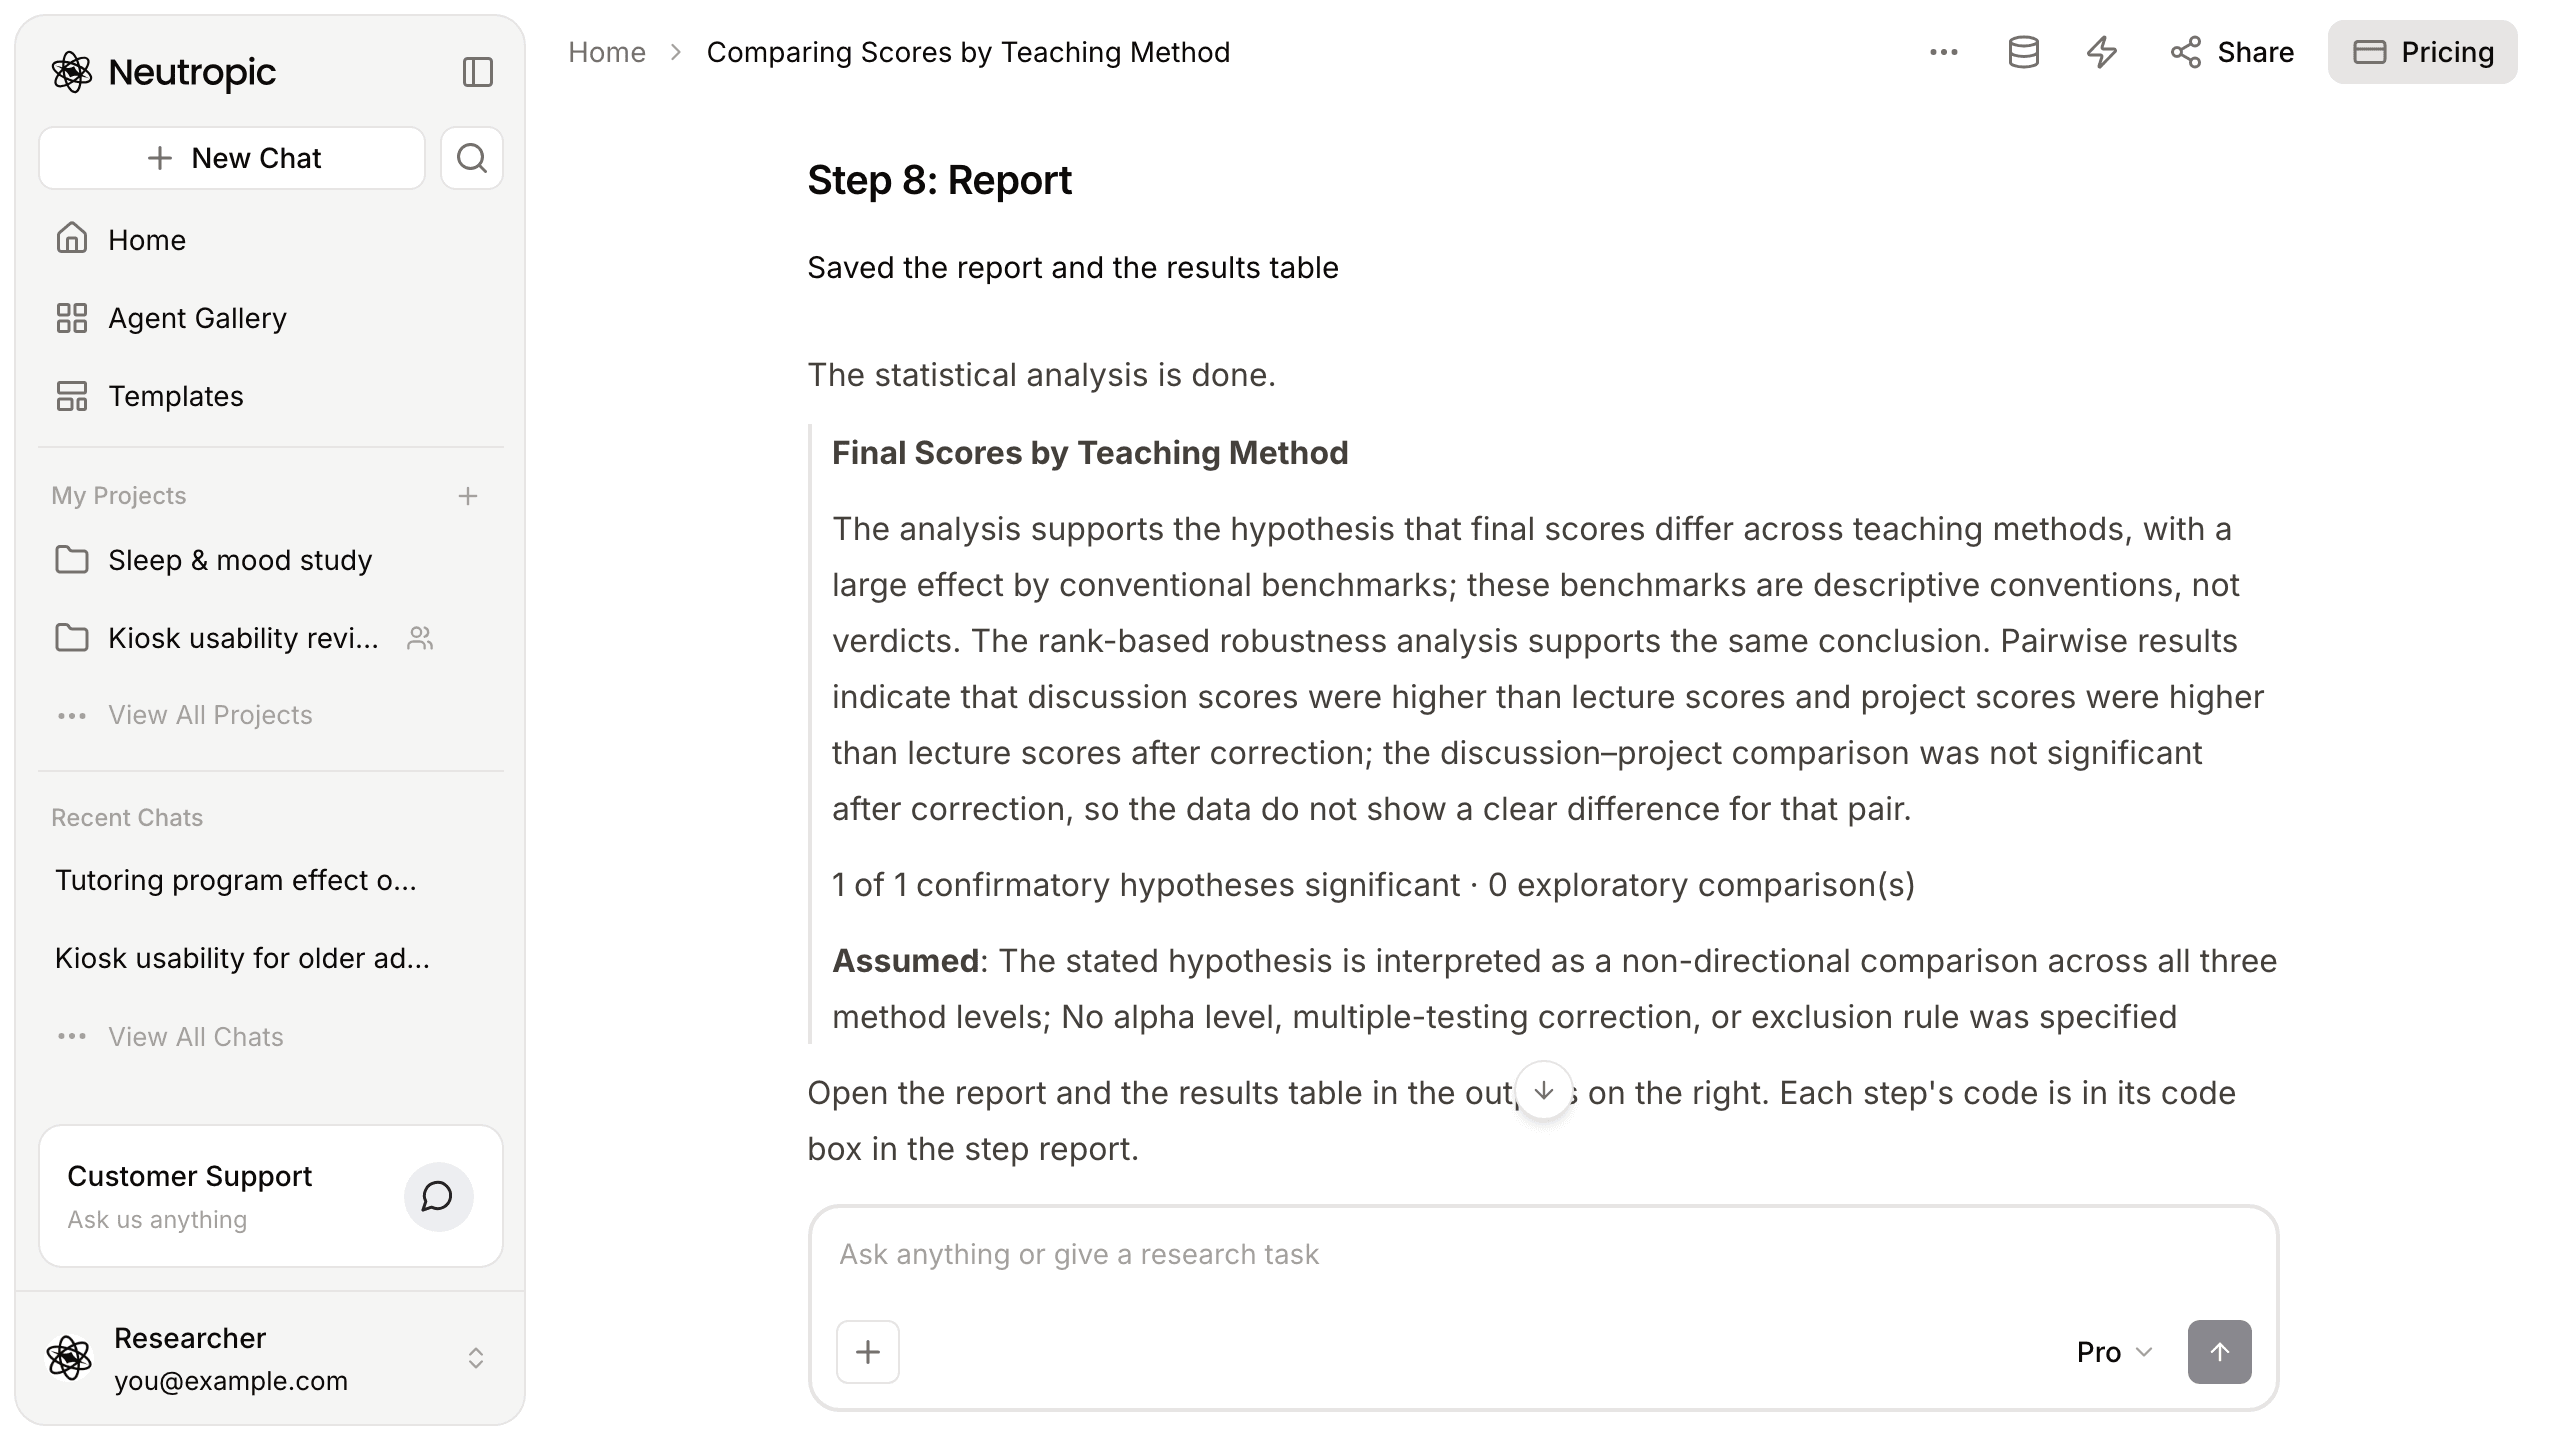
Riley nearly wrote "a large effect" and stopped there
Riley's first instinct was to write "teaching method has a large effect". The answer gets ahead of that: the effect is large by conventional benchmarks, but those benchmarks are descriptive conventions, not verdicts. Whether a difference of this size matters in a classroom is a separate question.
The answer also listed what it Assumed: the hypothesis was read as a non-directional comparison across all three methods, and no alpha level, multiple-testing correction or exclusion rule had been specified. If Riley had a pre-registered alpha or exclusion rule, this is the line to check and correct. When the defaults an agent picked are spelled out like this, reviewer questions get much easier to answer.
The report and results table came with a next step
There were two outputs: a report, statistical_report.md, and a workbook, statistical_results.xlsx. The report covers descriptives, assumption checks, the overall test, pairwise comparisons and the rank-based robustness analysis; the workbook holds the hypothesis summary and per-analysis results. Each step's code box shows the Python that actually ran.
Below the answer was one suggestion: review the report and workbook for assumptions, exclusions and reporting details that should qualify the conclusion that scores differ across teaching methods.
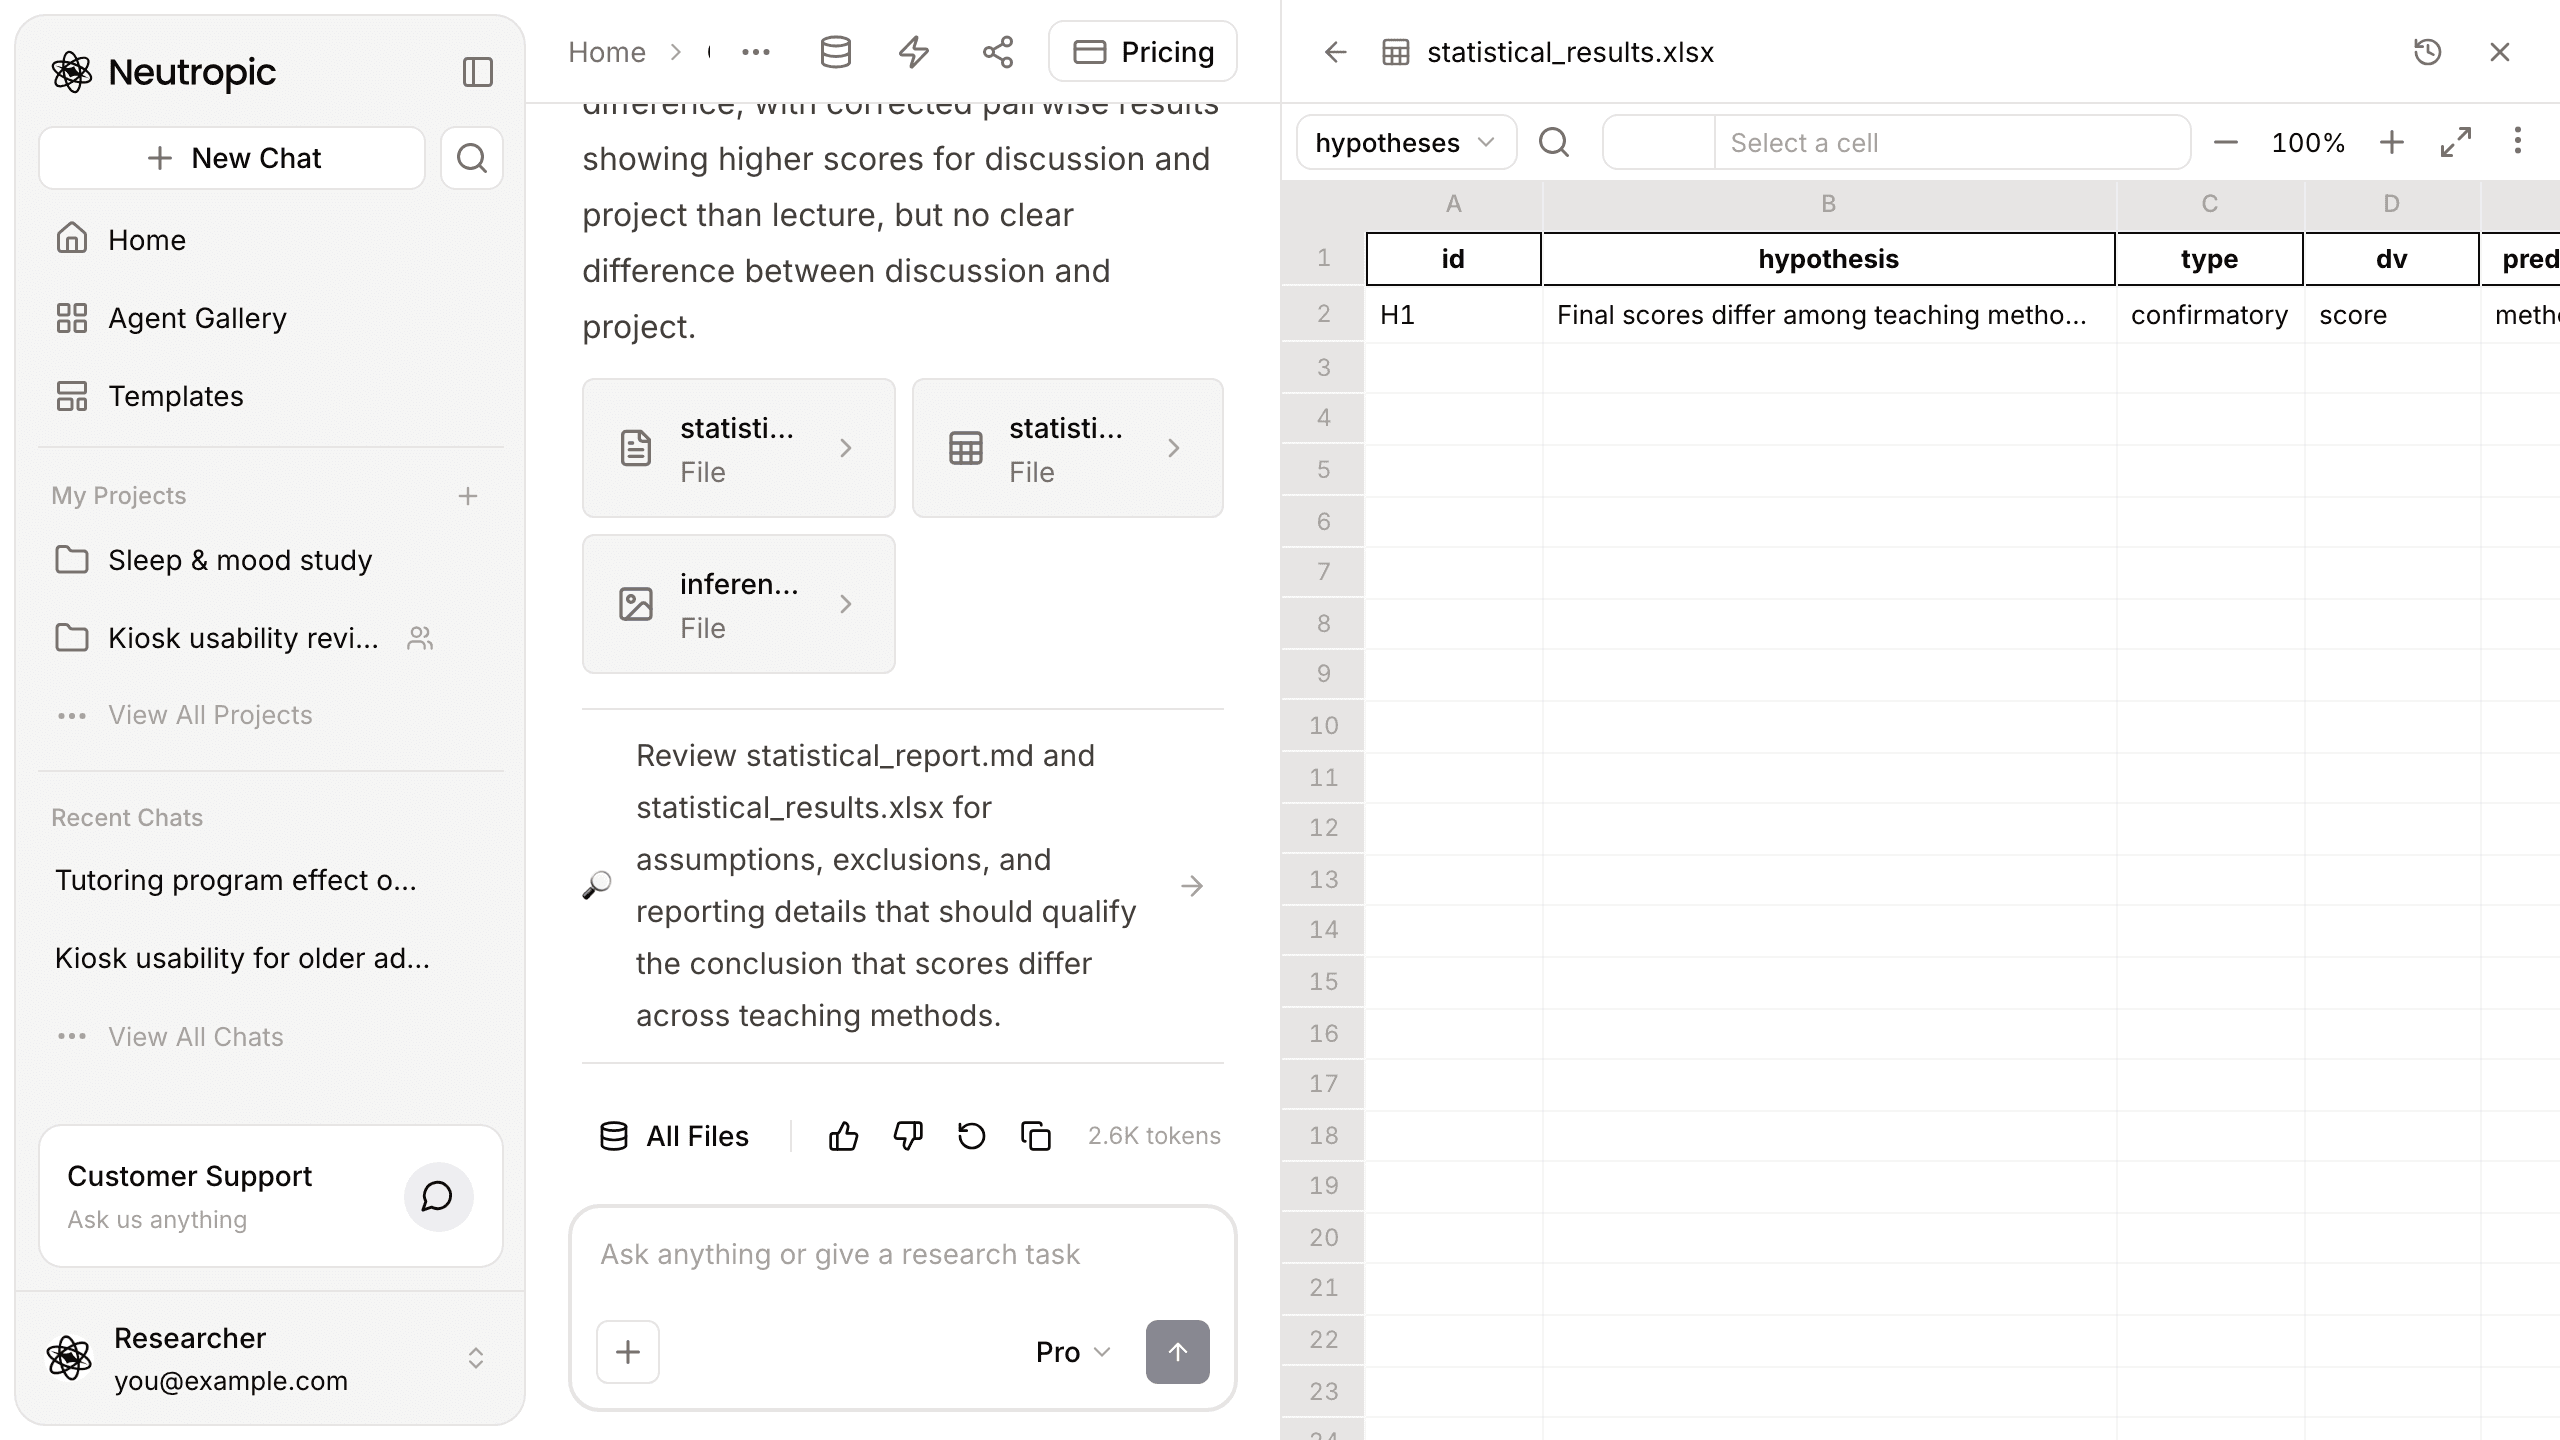
Time spent choosing a test became time spent interpreting
| At the start | Now | |
|---|---|---|
| Test choice | Would switch based on Levene's test | Welch's ANOVA from the start |
| Assumptions | Worried about violations | Met 3 · violated 1, reported, test unchanged |
| Result | None | Welch's F(2, 72.29) = 12.35, p < .001 |
| Pairs | Unknown | Discussion and project above lecture; no clear difference between them |
| Outputs | None | Report, results workbook, code for each step |
There are limits. A significant overall test is not the end; read which pairs differ and by how much. If people contribute several rows, a repeated-measures model is needed instead. And since this file does not say whether students were randomly assigned, calling the difference an "effect" of teaching method depends on the study design.
This walkthrough used Pro and took about 80 seconds. Pro adds the robustness analysis. Lite (the free plan) runs the main test only; Expert adds more alternative analyses and a longer discussion.
For three or more groups, make Welch's ANOVA the default. Report the variance check, but don't let it pick your test.
This week, upload your data and ask in one sentence, just like Riley. Start with Neutropic for free