Hi, this is the Neutropic team!
Have you ever stared at the "Hypotheses" heading of a research proposal with nothing under it? You know what you want to study: "Heavy smartphone use seems to wreck students' sleep." But write that down as it is, and you can already hear your supervisor: "Heavy means how many hours? Which part of sleep? And what result would show you were wrong?" 🥲
A hunch is hard to turn into a hypothesis because it is tempting to write only the one you hope to confirm. Maybe poor sleepers reach for their phones. Maybe stress drives both. If you don't set up these rival explanations in advance, your data won't tell you much when it arrives.
In this post we follow Jordan, a first-year psychology master's student, as they turn this hunch into hypotheses for a proposal. Jordan is fictional, but every screen below comes from a real chat in Neutropic.
Jordan sent the hunch as it was
Jordan didn't polish anything. They wrote the idea down and listed what they wanted back.
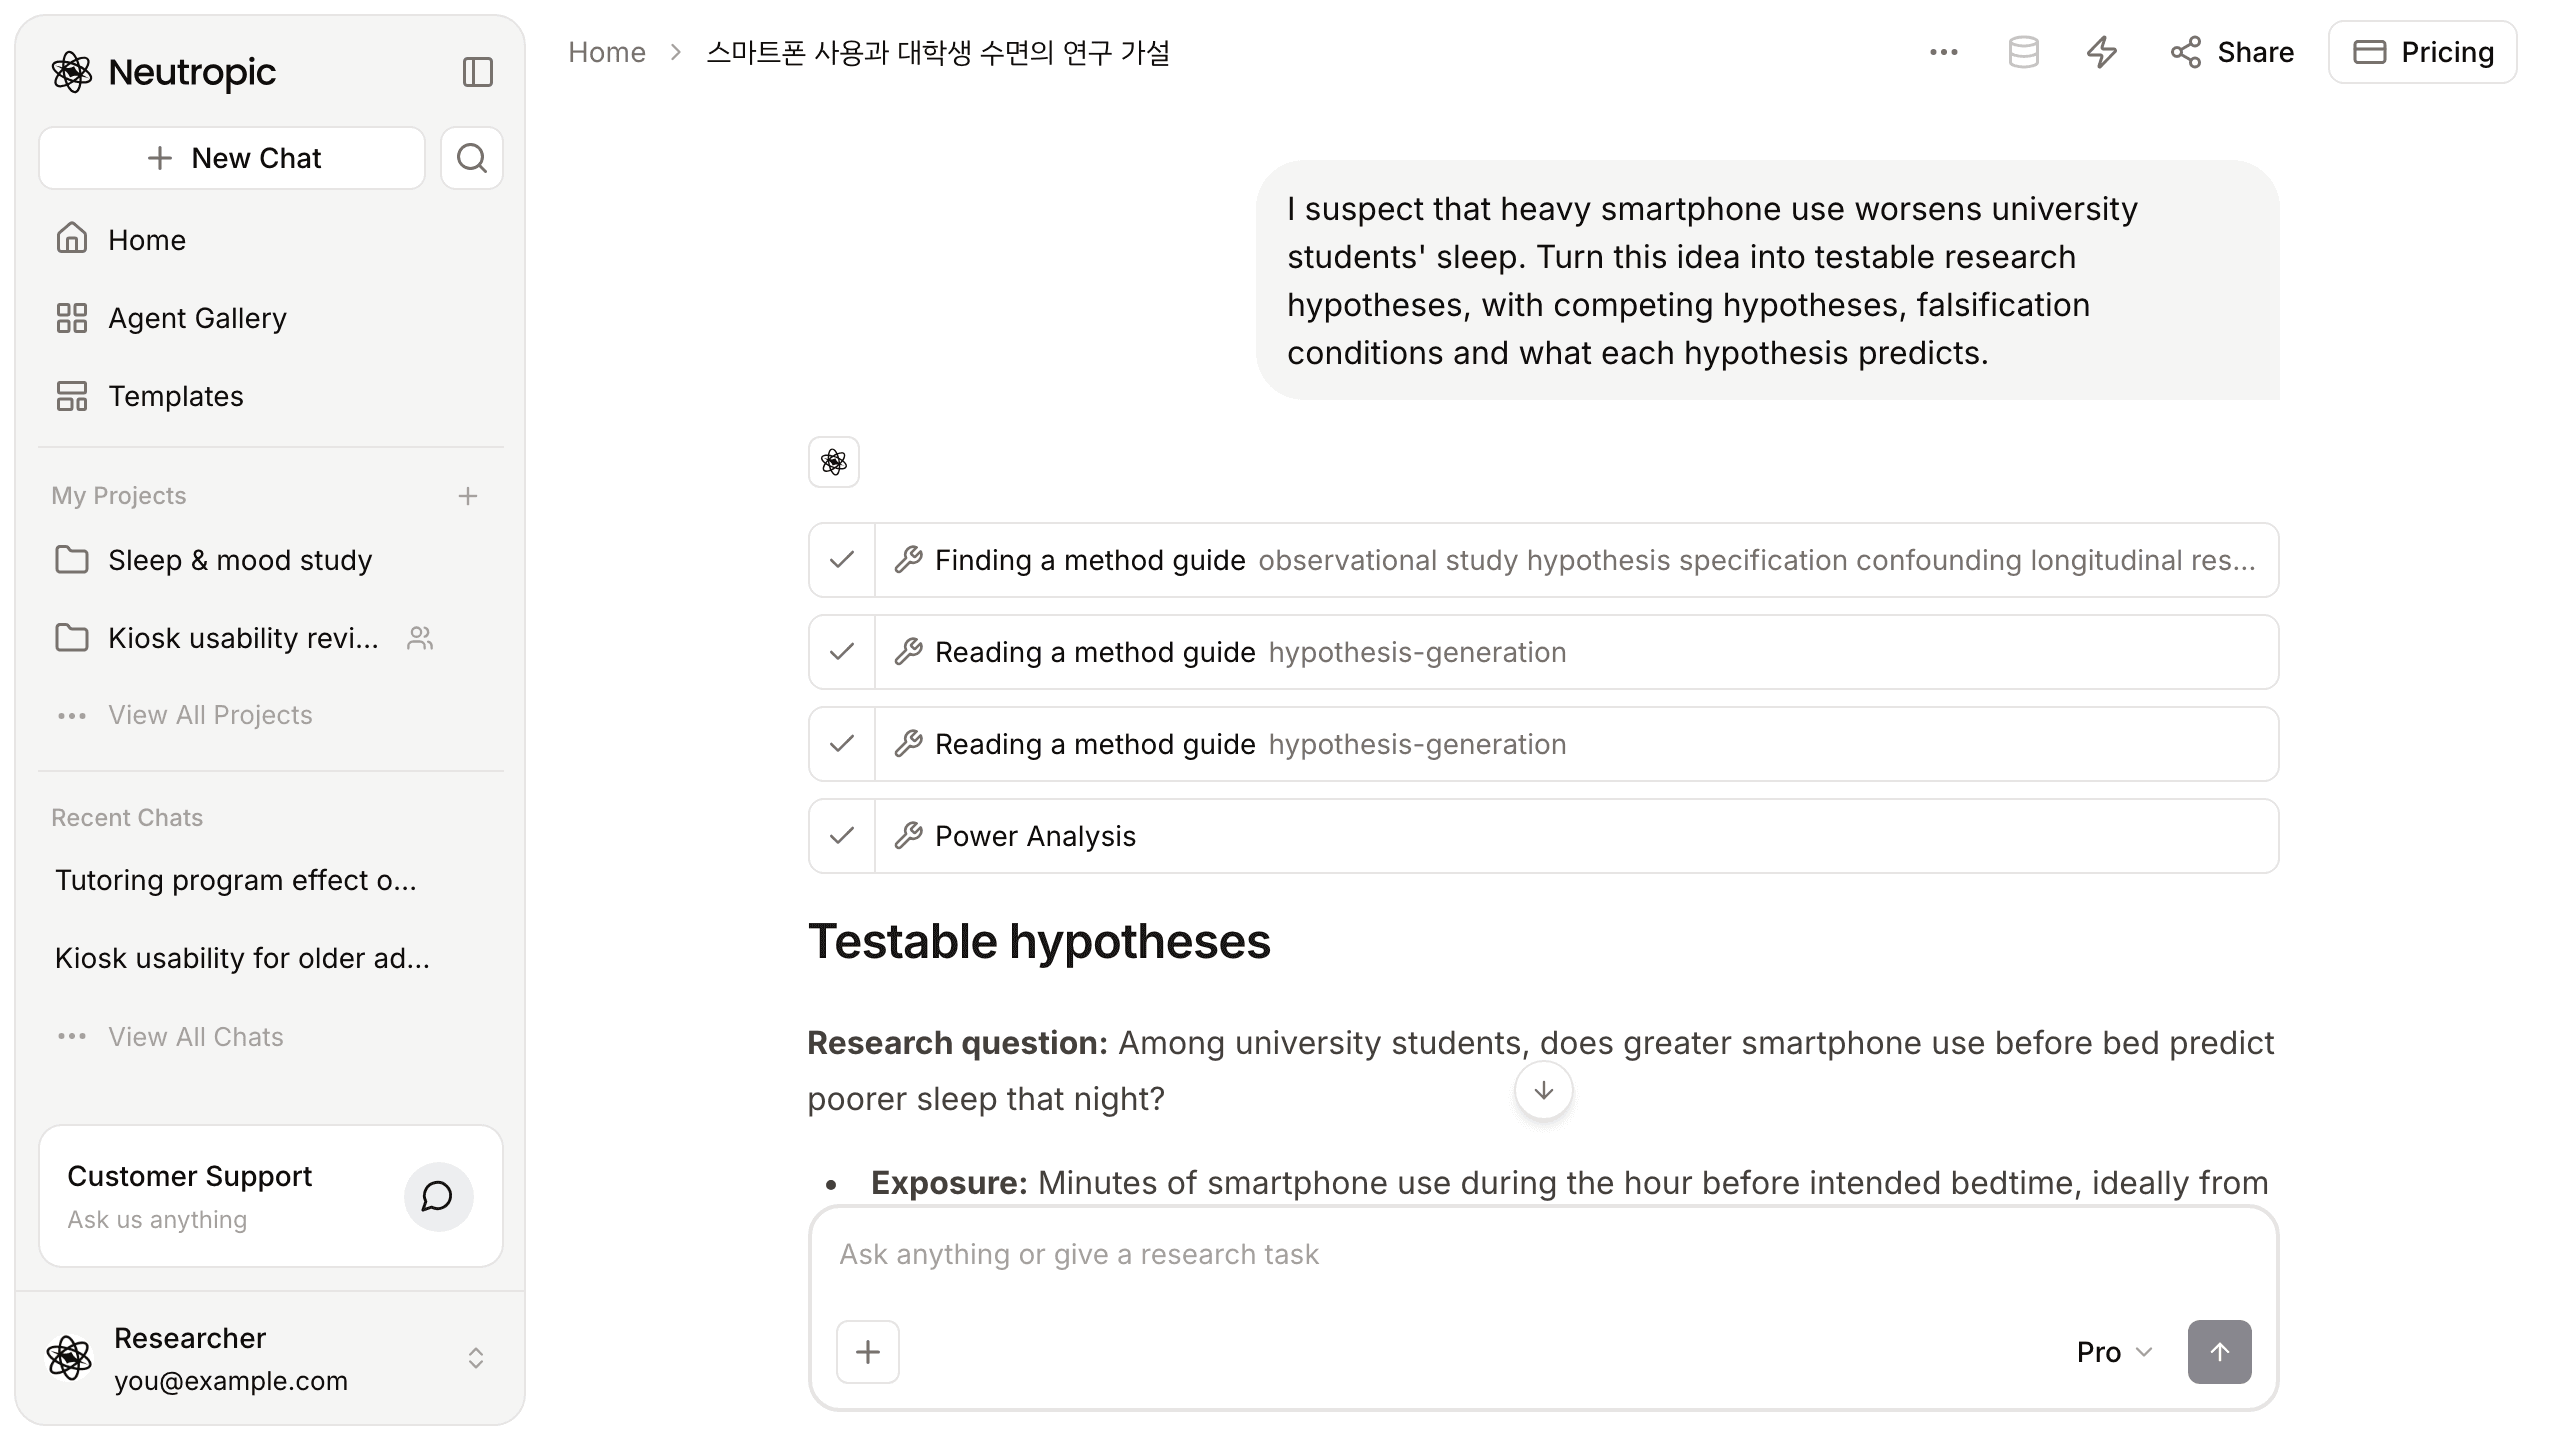
I suspect that heavy smartphone use worsens university students' sleep. Turn this idea into testable research hypotheses, with competing hypotheses, falsification conditions and what each hypothesis predicts.
The request works for two reasons. It states, in one sentence, what Jordan thinks affects what. And it names three concrete things to return: competing hypotheses, falsification conditions and predictions. Asking for falsification conditions in particular signals that you want hypotheses that can fail, not reassurance.
It read a hypothesis-generation guide first
Steps appeared as soon as Jordan hit send. Finding a method guide located a fitting guide, Reading a method guide read the hypothesis-generation guide, and a Power Analysis step ran a calculation for the worked example at the end. Click any step to see exactly what was read or computed.
"Heavy use" became something you can measure
The answer started by rewriting the question: among university students, does greater smartphone use before bed predict poorer sleep that night?
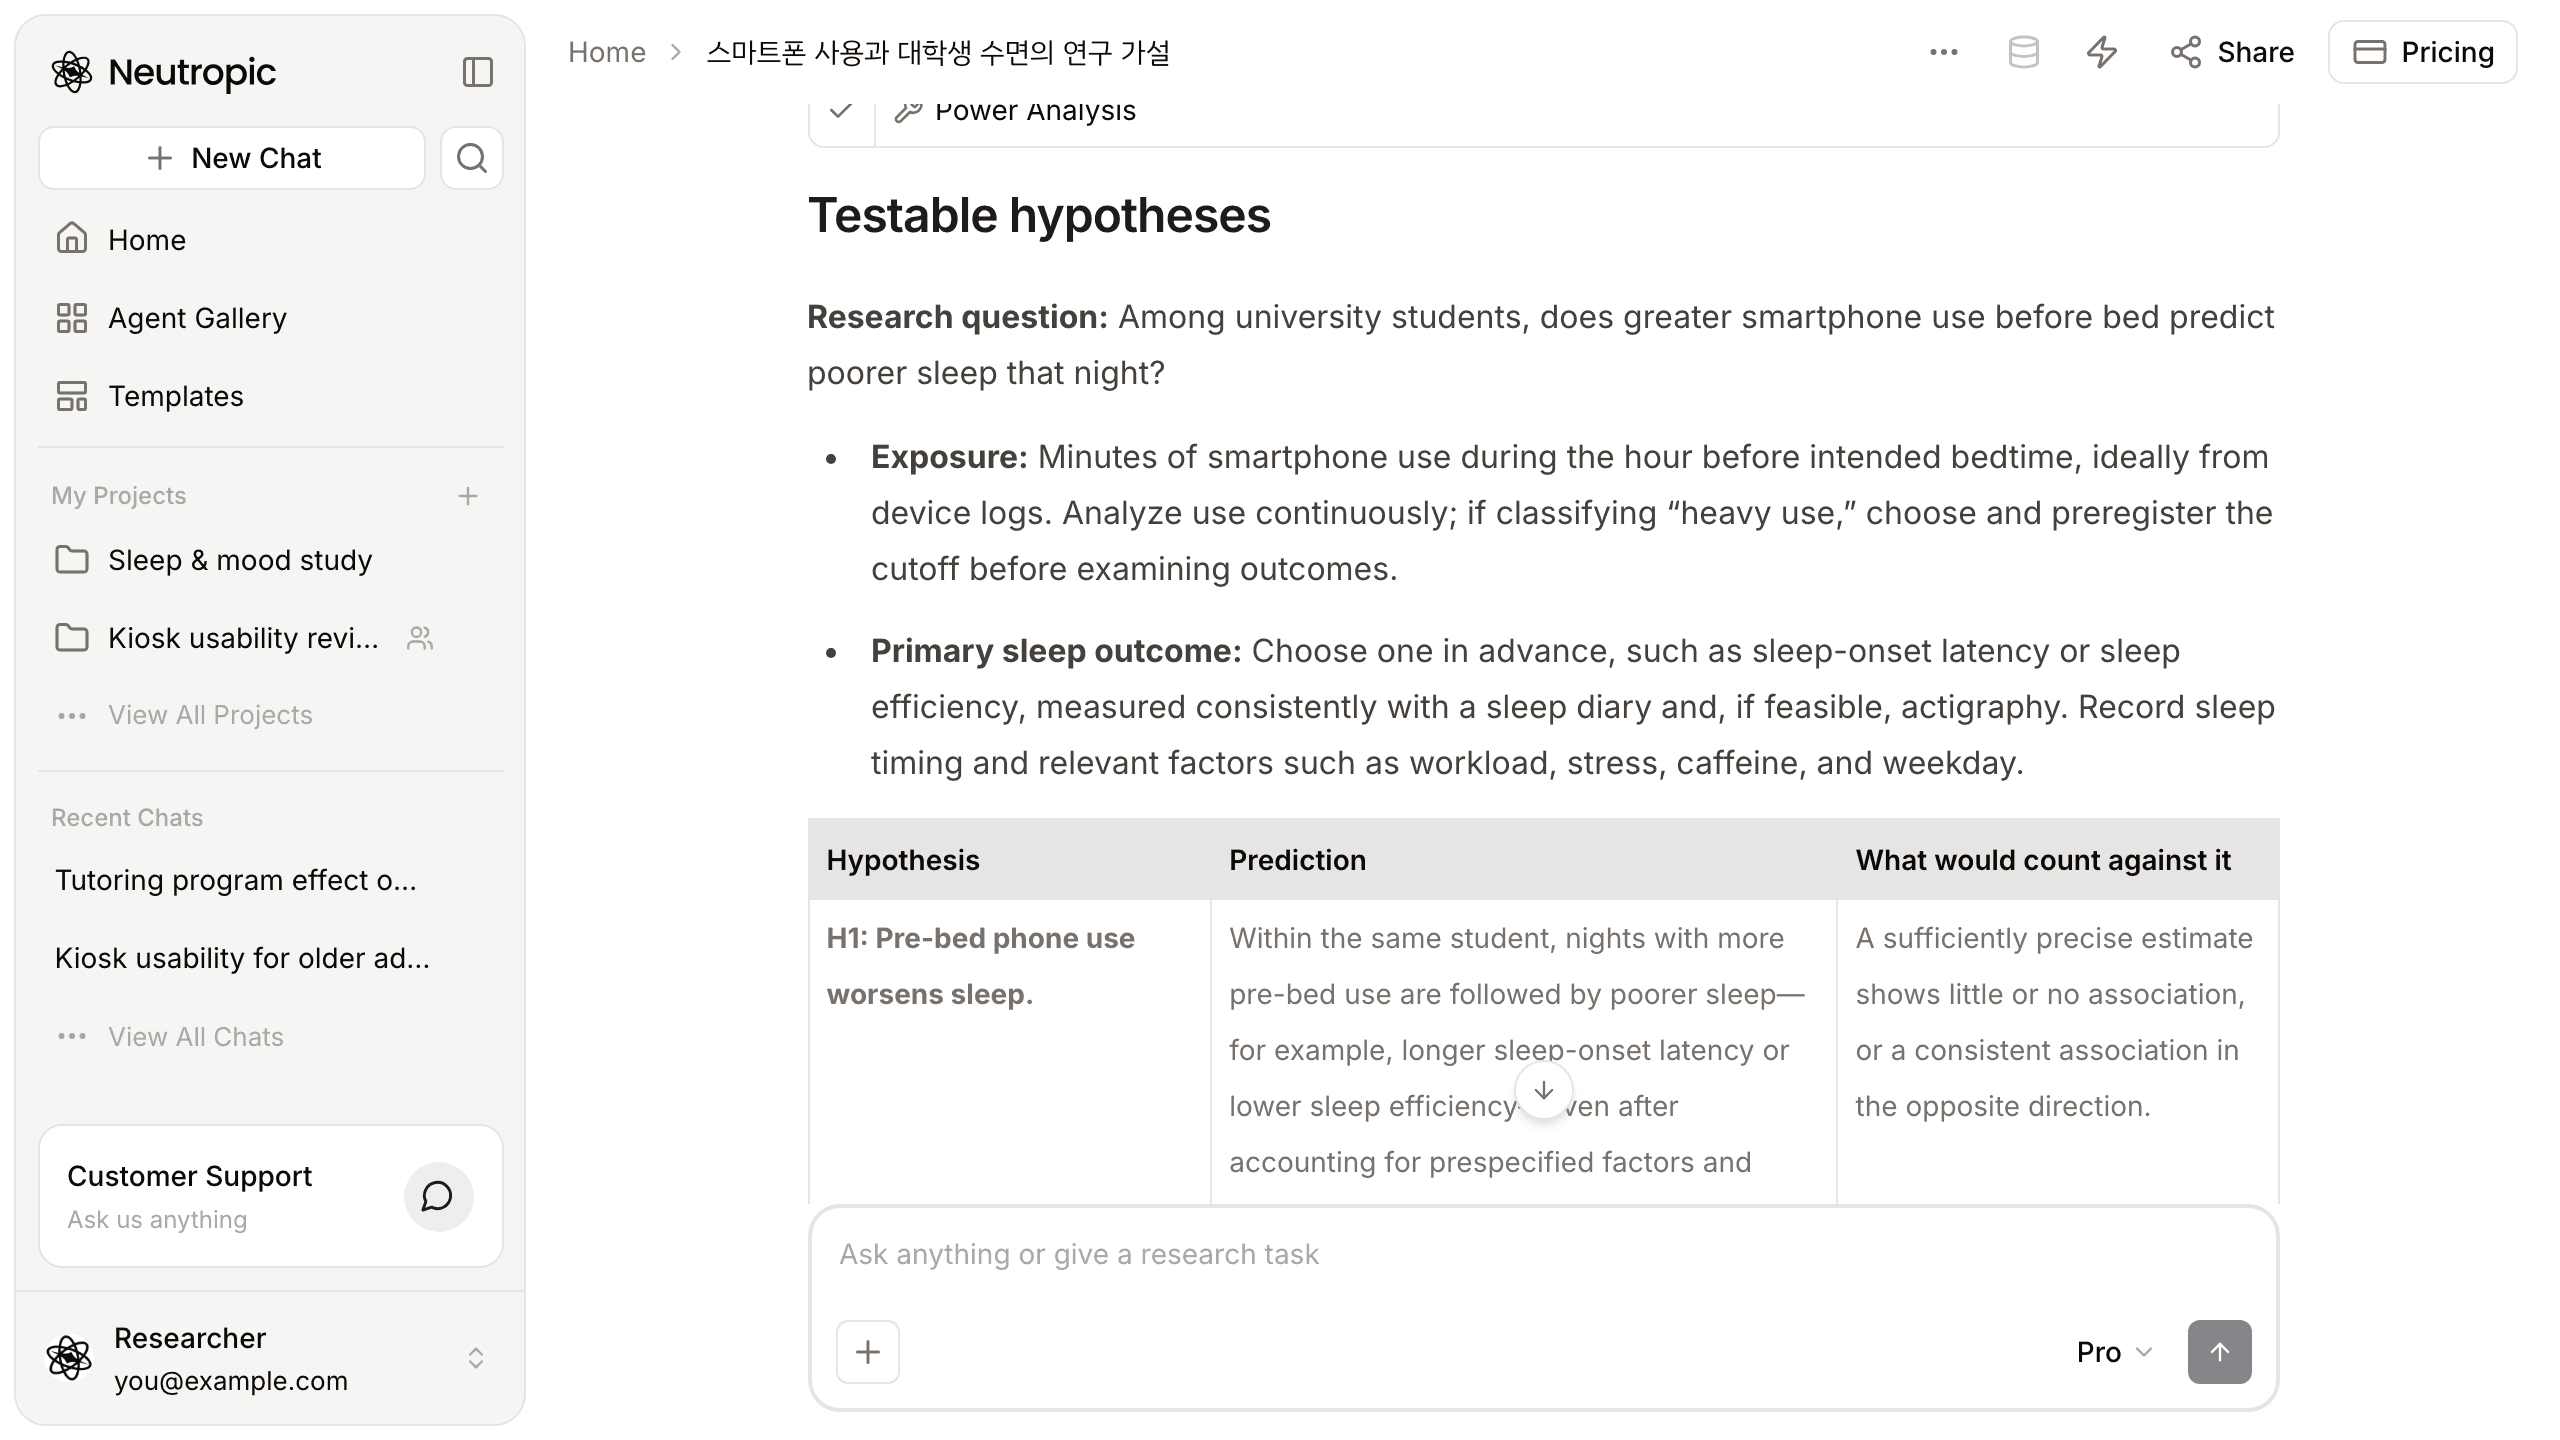
Then it pinned down the vague words. The exposure became minutes of phone use in the hour before intended bedtime, ideally from device logs, analysed as a continuous measure. If Jordan still wants a "heavy use" group, the cutoff has to be chosen and preregistered before looking at outcomes. The outcome became one primary sleep measure chosen in advance, such as sleep-onset latency or sleep efficiency, measured with a sleep diary and, if feasible, actigraphy.
Four explanations, side by side
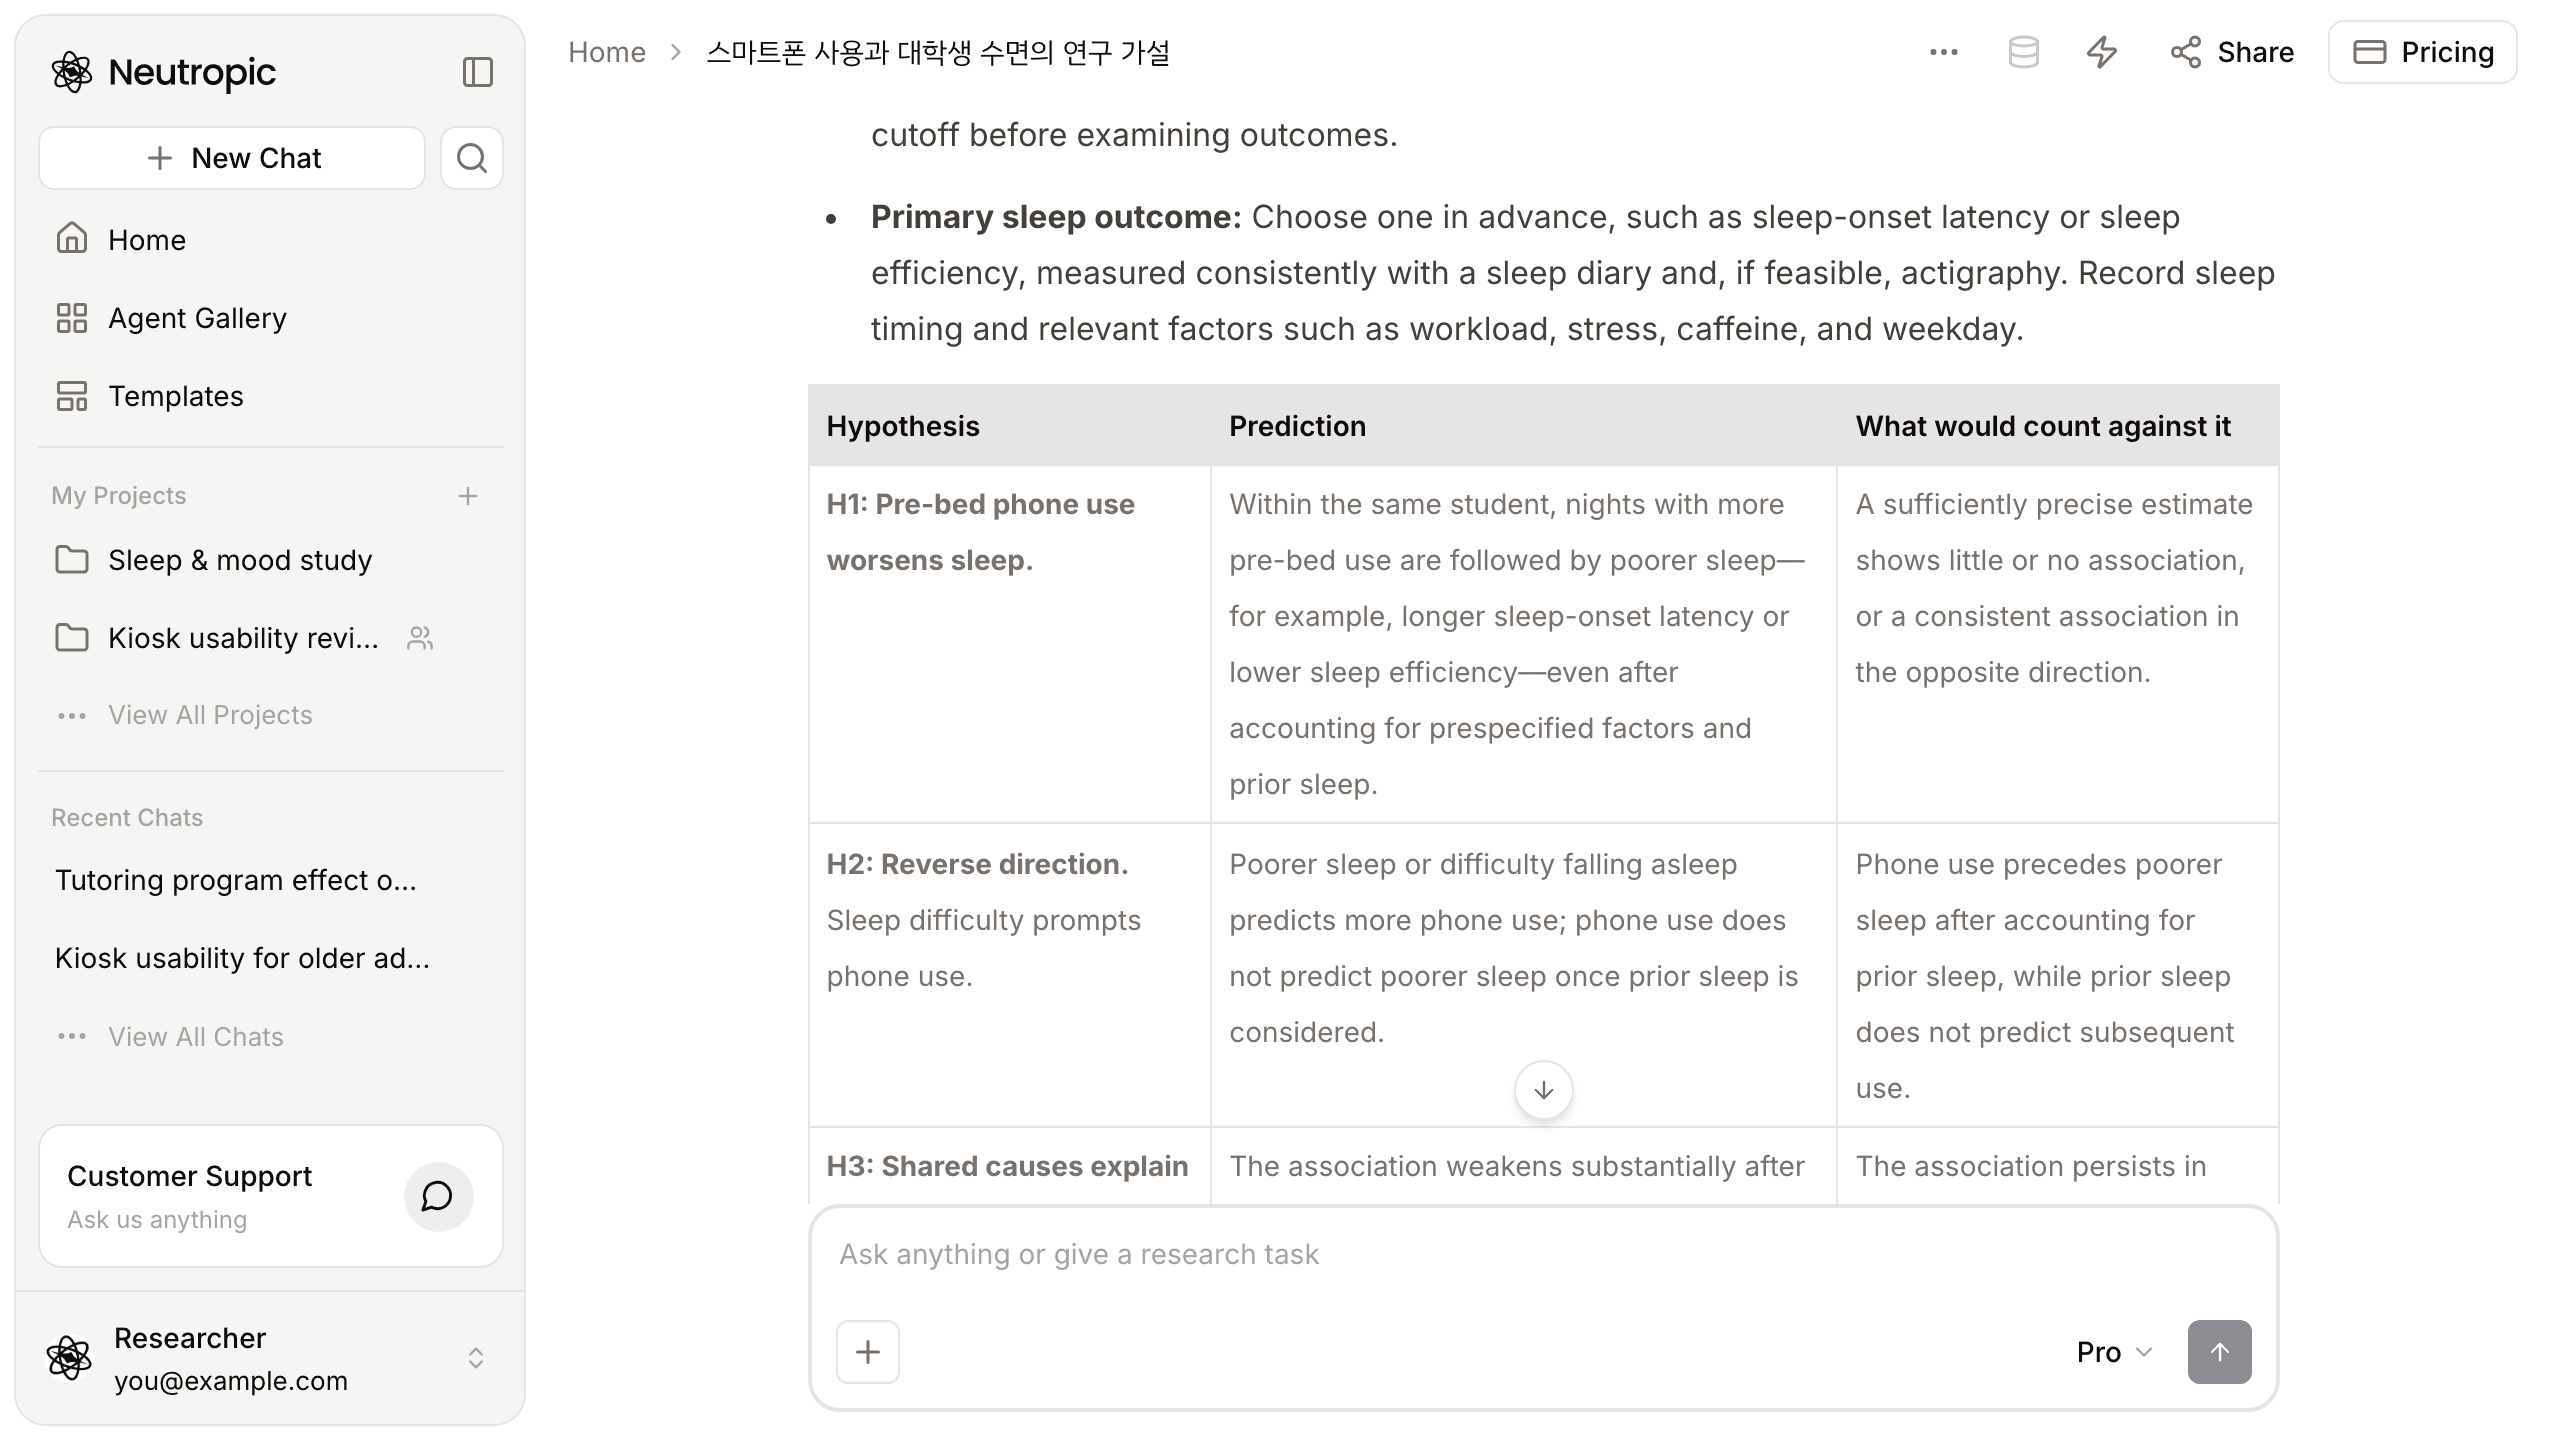
The core of the answer was a table. Each hypothesis gets a prediction and a line saying what would count against it.
- H1: Pre-bed phone use worsens sleep. Within the same student, nights with more pre-bed use are followed by poorer sleep, even after accounting for prior sleep.
- H2: Reverse direction. Difficulty sleeping prompts phone use, not the other way round.
- H3: Shared causes. Stress, workload or irregular schedules drive both, so the association weakens once they are measured.
- H4: Timing or activity matters. Later or more engaging use matters more than other use.
The answer adds that these explanations can coexist, and that an observational study can establish timing but cannot by itself rule out unmeasured confounding.
A worked example — and a warning attached
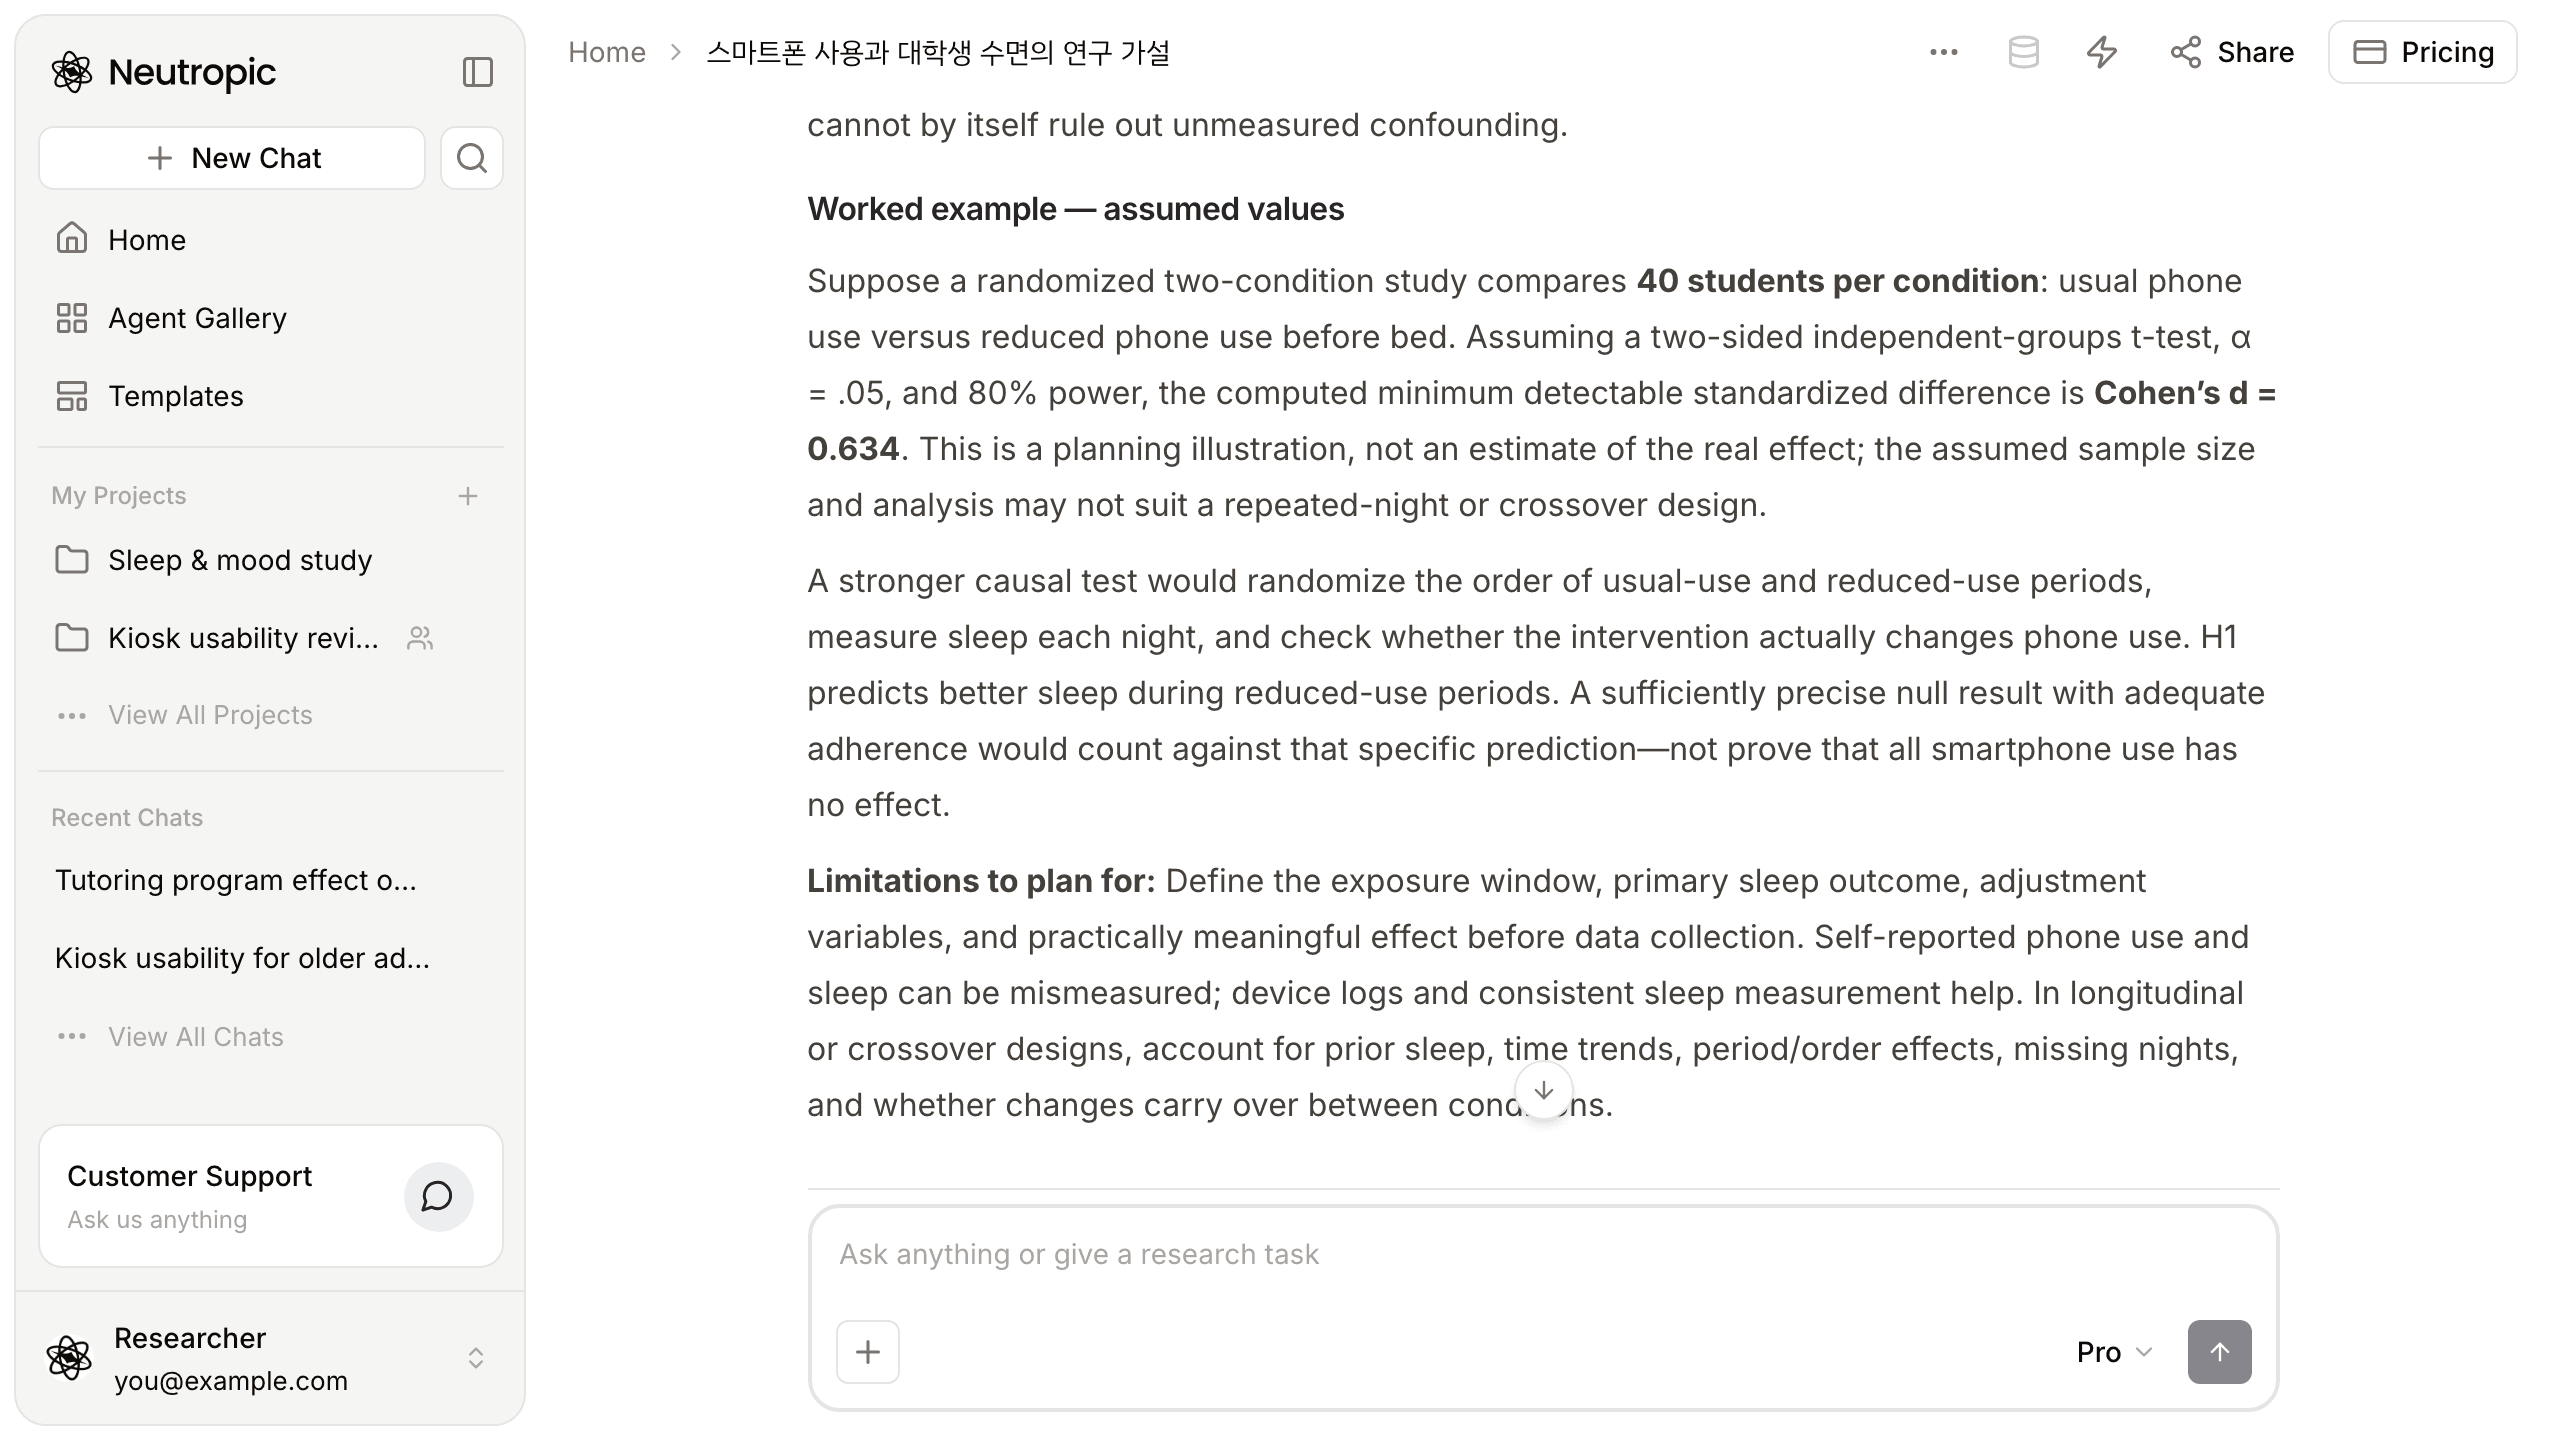
To make "a sufficiently precise estimate" concrete, the answer worked through an assumed scenario: a randomised two-condition study with 40 students per condition (usual use versus reduced use before bed), a two-sided independent-groups t-test, α = .05 and 80% power. The computed minimum detectable effect was Cohen's d = 0.634. We redid the calculation with the same assumptions and got the same value.
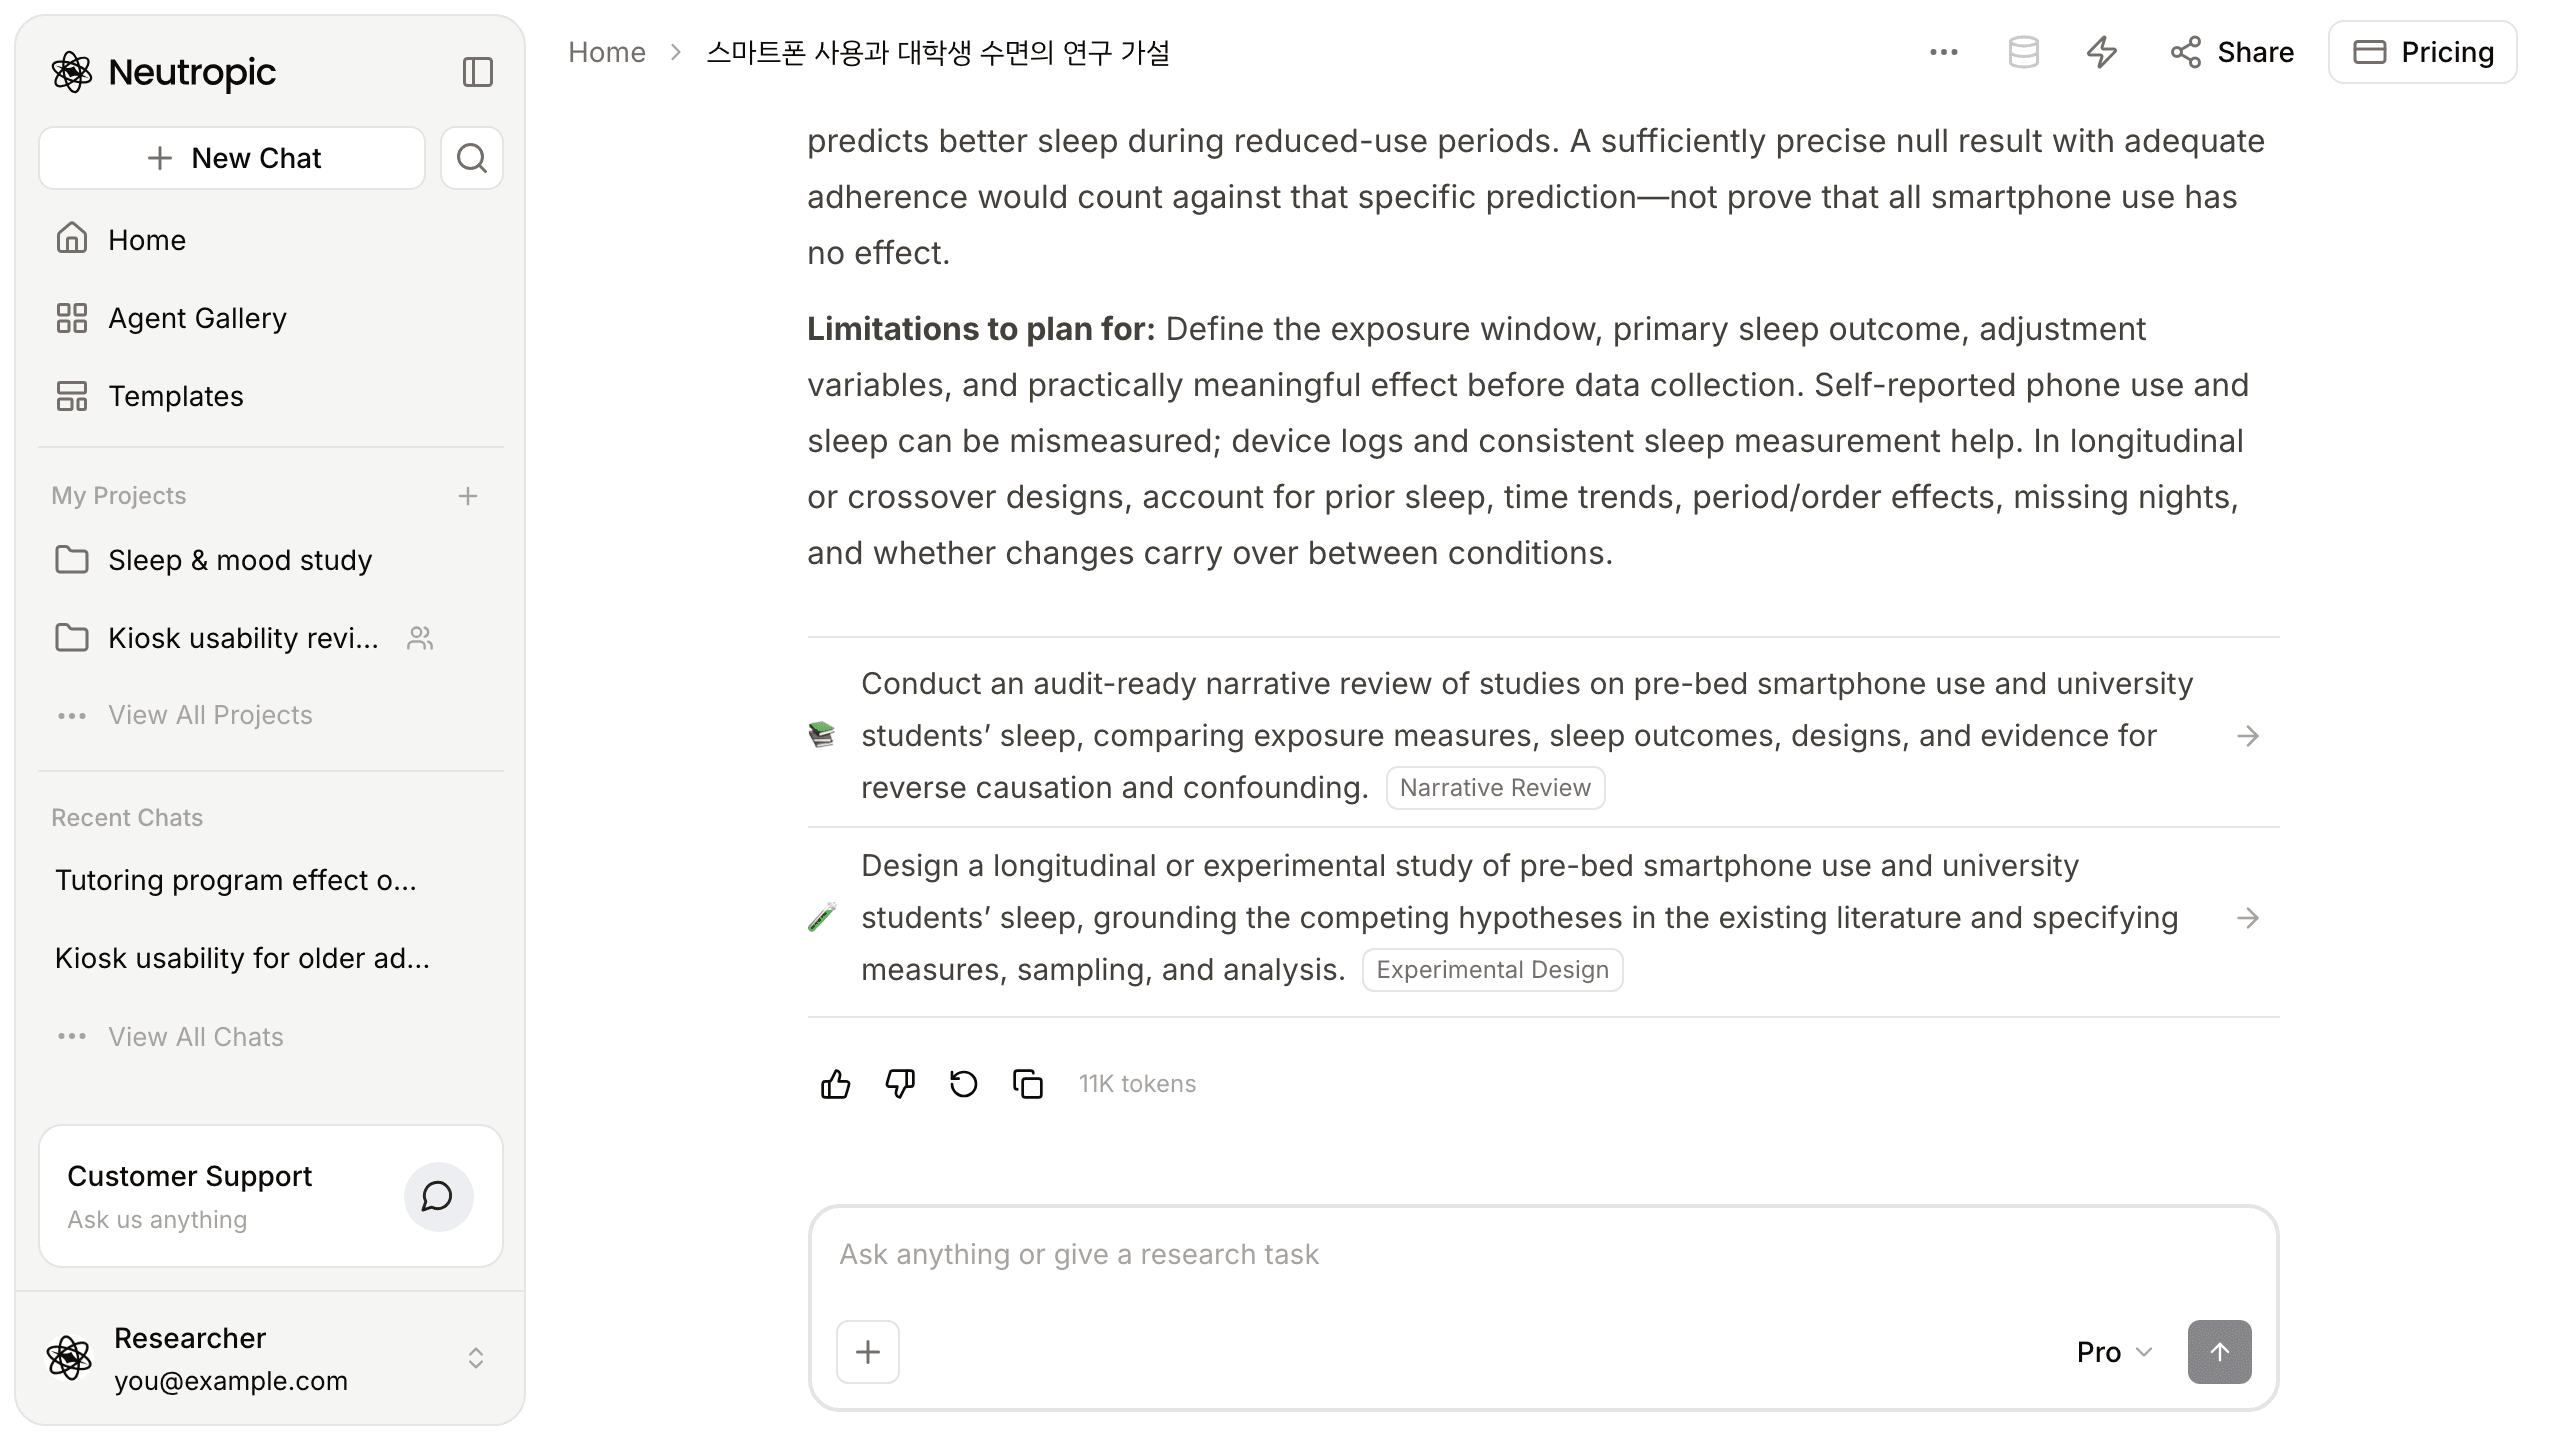
This is where Jordan nearly made a mistake. It is tempting to drop "d = 0.634" into the proposal as if it were the expected effect. The answer says plainly that it is a planning illustration, not an estimate of the real effect, and that this simple two-group calculation may not suit a repeated-night or crossover design. It also warns that a precise null result would count against H1's specific prediction, not prove that all smartphone use is harmless.
It suggested what to do next
At the bottom were two suggestions:
- Run an audit-ready review of studies on pre-bed phone use and students' sleep, comparing exposure measures, designs and the evidence on reverse causation and confounding — Narrative Review agent
- Design a longitudinal or experimental study grounded in the competing hypotheses, with measures, sampling and analysis — Experimental Design agent
Click one and the conversation continues in the same chat. With a proposal due, Jordan would probably start with the second.
A vague hunch became hypotheses that can fail
| At the start | Now | |
|---|---|---|
| Question | "Heavy use wrecks sleep" | Does pre-bed use predict poorer sleep that night? |
| Variables | Undefined | Minutes in the hour before bed; one prespecified sleep outcome |
| Rival explanations | None | Reverse direction, shared causes, timing and activity |
| Falsification | None | What would count against each hypothesis |
| Planning | No numbers | A worked example: d = 0.634 detectable with 40 per condition |
There are limits. This run did not search the literature, so the answer has no citations; the hypotheses come from the method guide and reasoning, not from a review of past studies. And the worked example rests on assumed values: the real sample size depends on the design Jordan actually chooses.
This walkthrough used Pro. Lite (the free plan) gives a concise main hypothesis and one or two alternatives; Expert also compares study designs that could separate the explanations.
Don't write the one hypothesis you hope is true; write four that could prove you wrong.
This week, put your hunch into one sentence and ask — just like Jordan. Start with Neutropic for free