Hi, this is the Neutropic team!
Say you have been asked to build a model that predicts whether participants get a trial right. You follow a Python tutorial, shuffle the rows into five folds, and get a respectable number. Then, at a lab meeting, someone asks: "Did the same participants end up in both your training and test data?" 🥲
Most human-research data look like this. One participant contributes many trials; one patient contributes many visits. Shuffle rows into folds and the model gets graded partly on people it has already seen, so the accuracy looks better than it will on new people. Avoiding that means deciding which columns must not be predictors, how to split the folds, and whether any variable is only known after the outcome.
In this post we follow Jordan, a cognitive psychology PhD student, building a first prediction model from a reaction-task experiment log. Jordan is fictional, but every screen below comes from a real run in Neutropic.
Jordan attached one file and wrote one line
The file was trials.csv: 720 rows from 90 participants with eight trials each, with columns for participant ID, trial number, age, baseline score, difficulty, response time and correctness. Jordan opened the Agent Gallery, picked the Predictive Modeling agent, attached the file and wrote:
Predict trial-level correctness (correct) from the attached experiment log.
Short, but it has what matters: what to predict (correct) and what one row is (a trial). Jordan never mentioned that each participant has several rows. Finding that out is the agent's job.
The participant column came out of the predictors early on
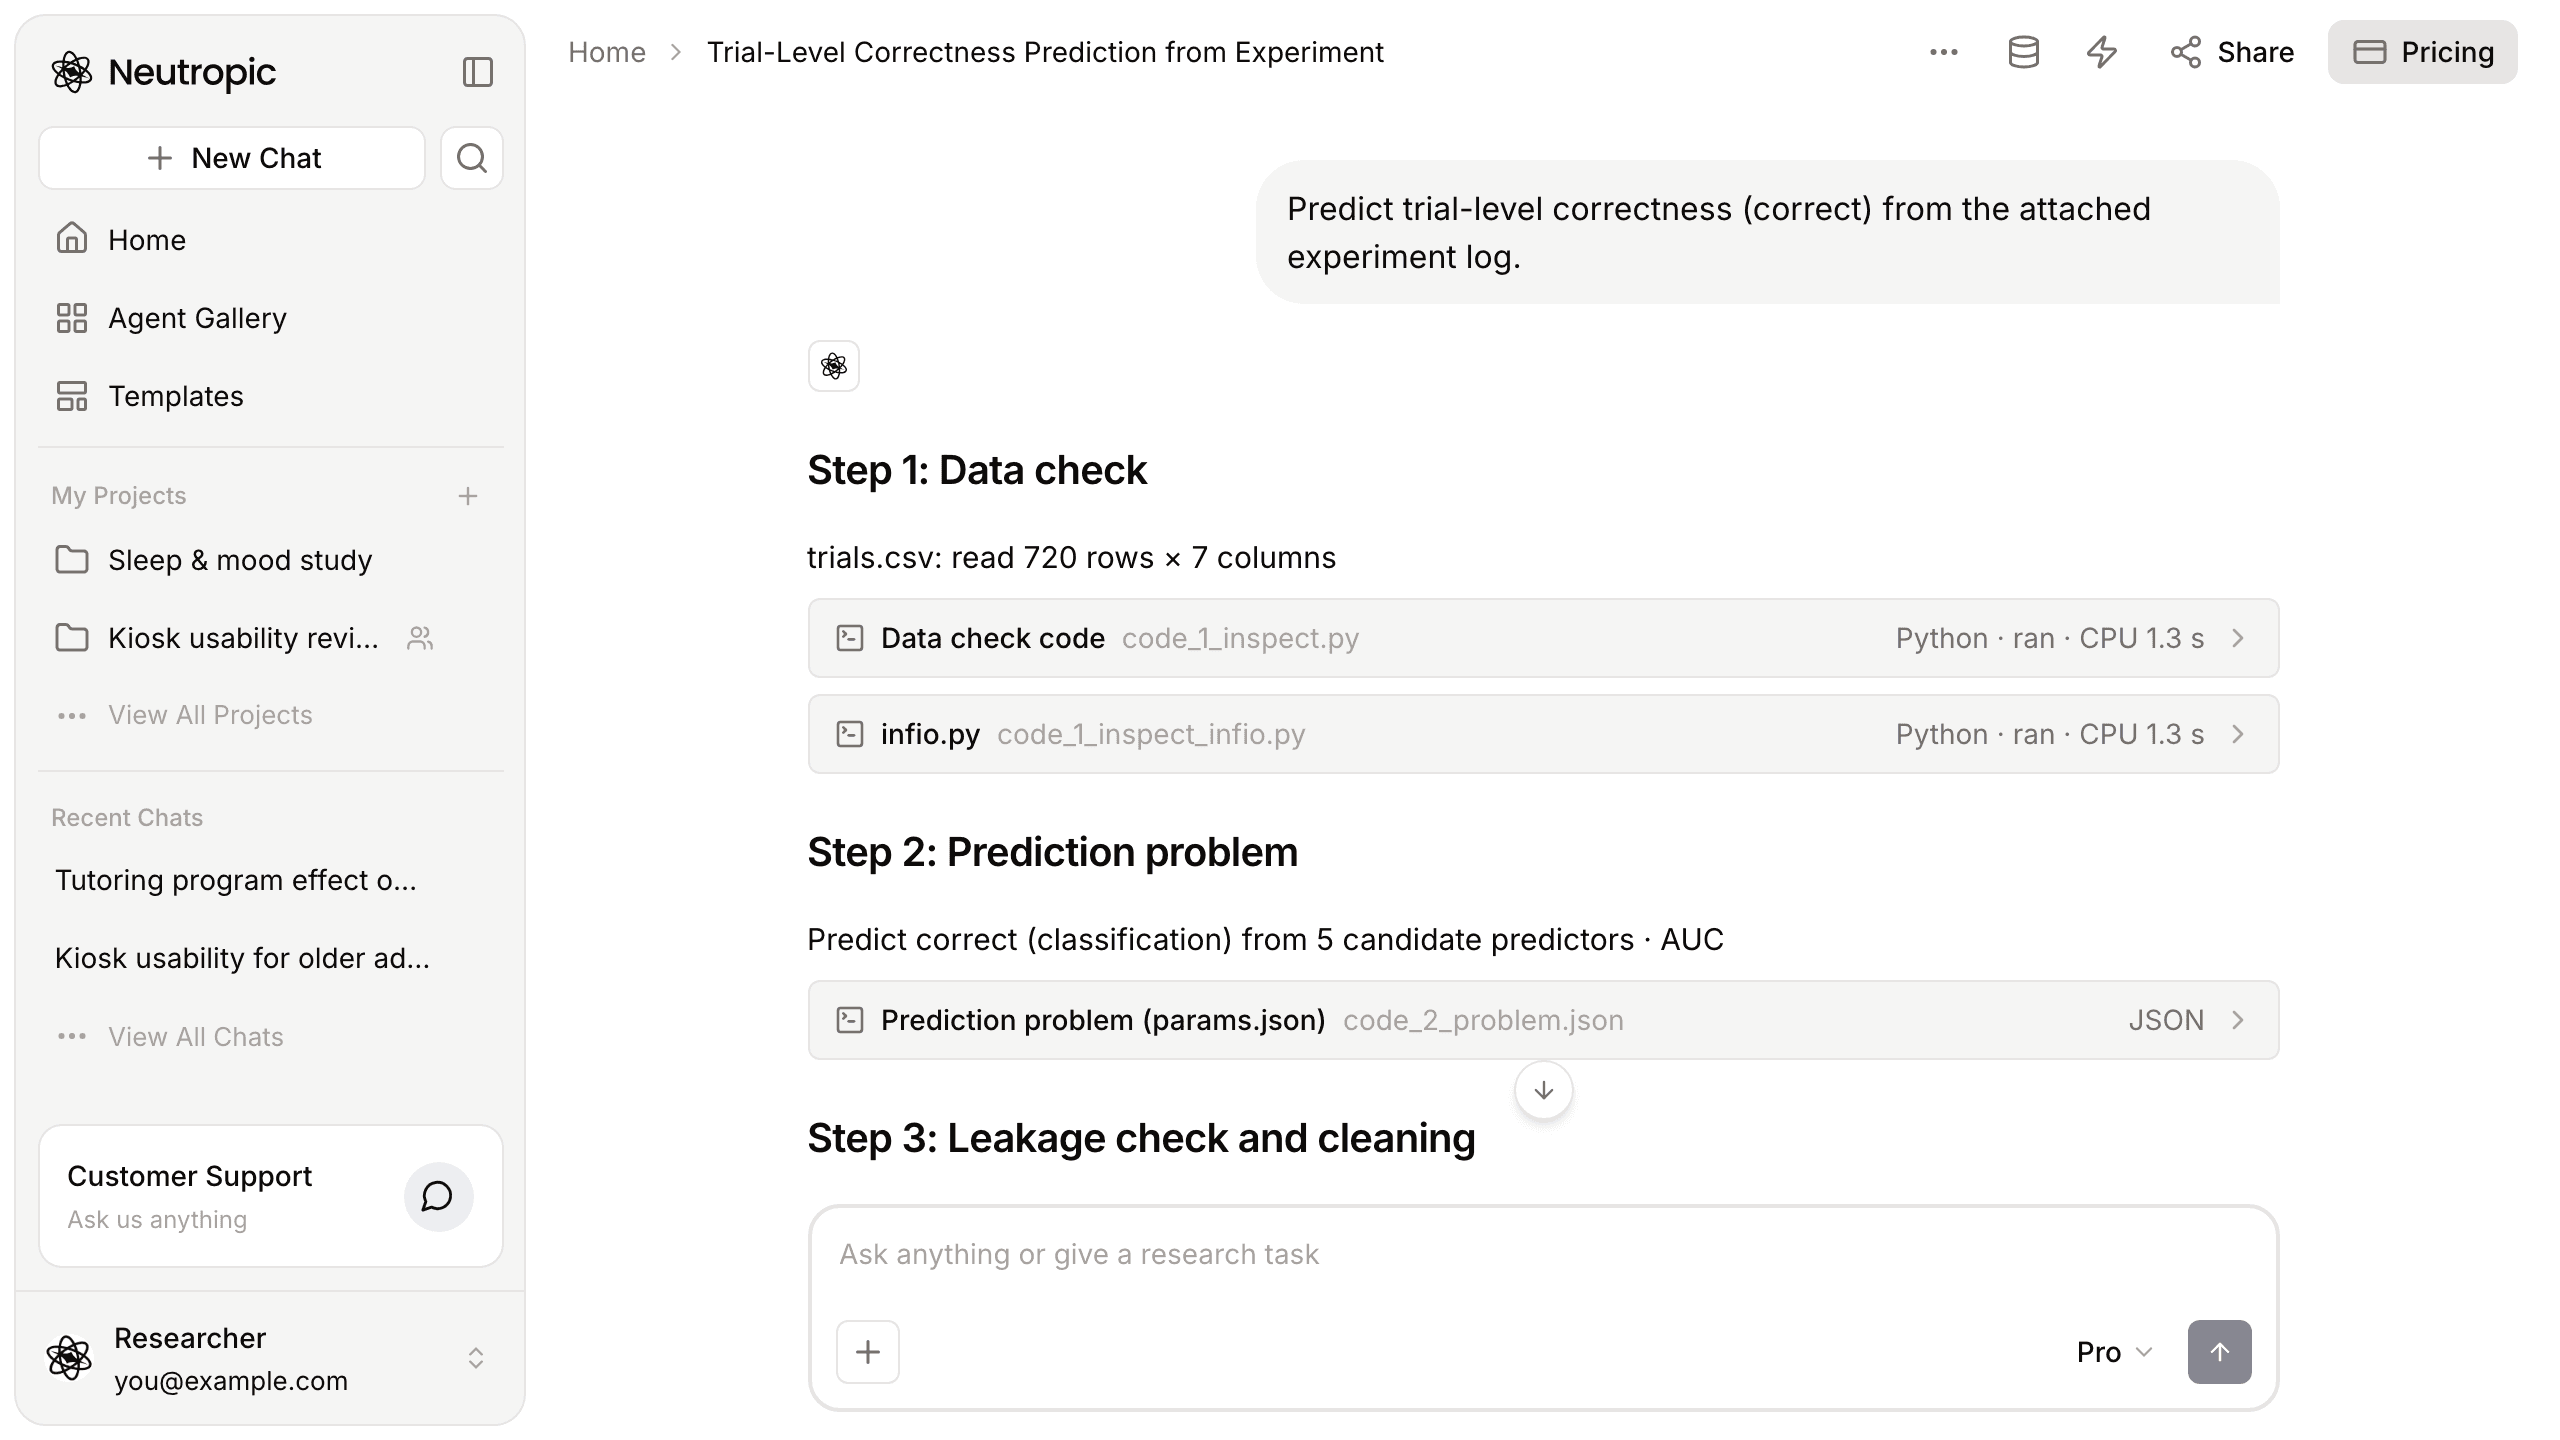
The agent worked through eight fixed steps. Data check read 720 rows × 7 columns. Prediction problem set the task as "predict correct (classification) from 5 candidate predictors · AUC".
The key step was the third, Leakage check and cleaning: "720 rows · 5 predictors used · removed: participant_id". The agent recognised the participant ID as an identifier and kept it out of the model. Left in, it would let the model memorise that "this person is usually right".
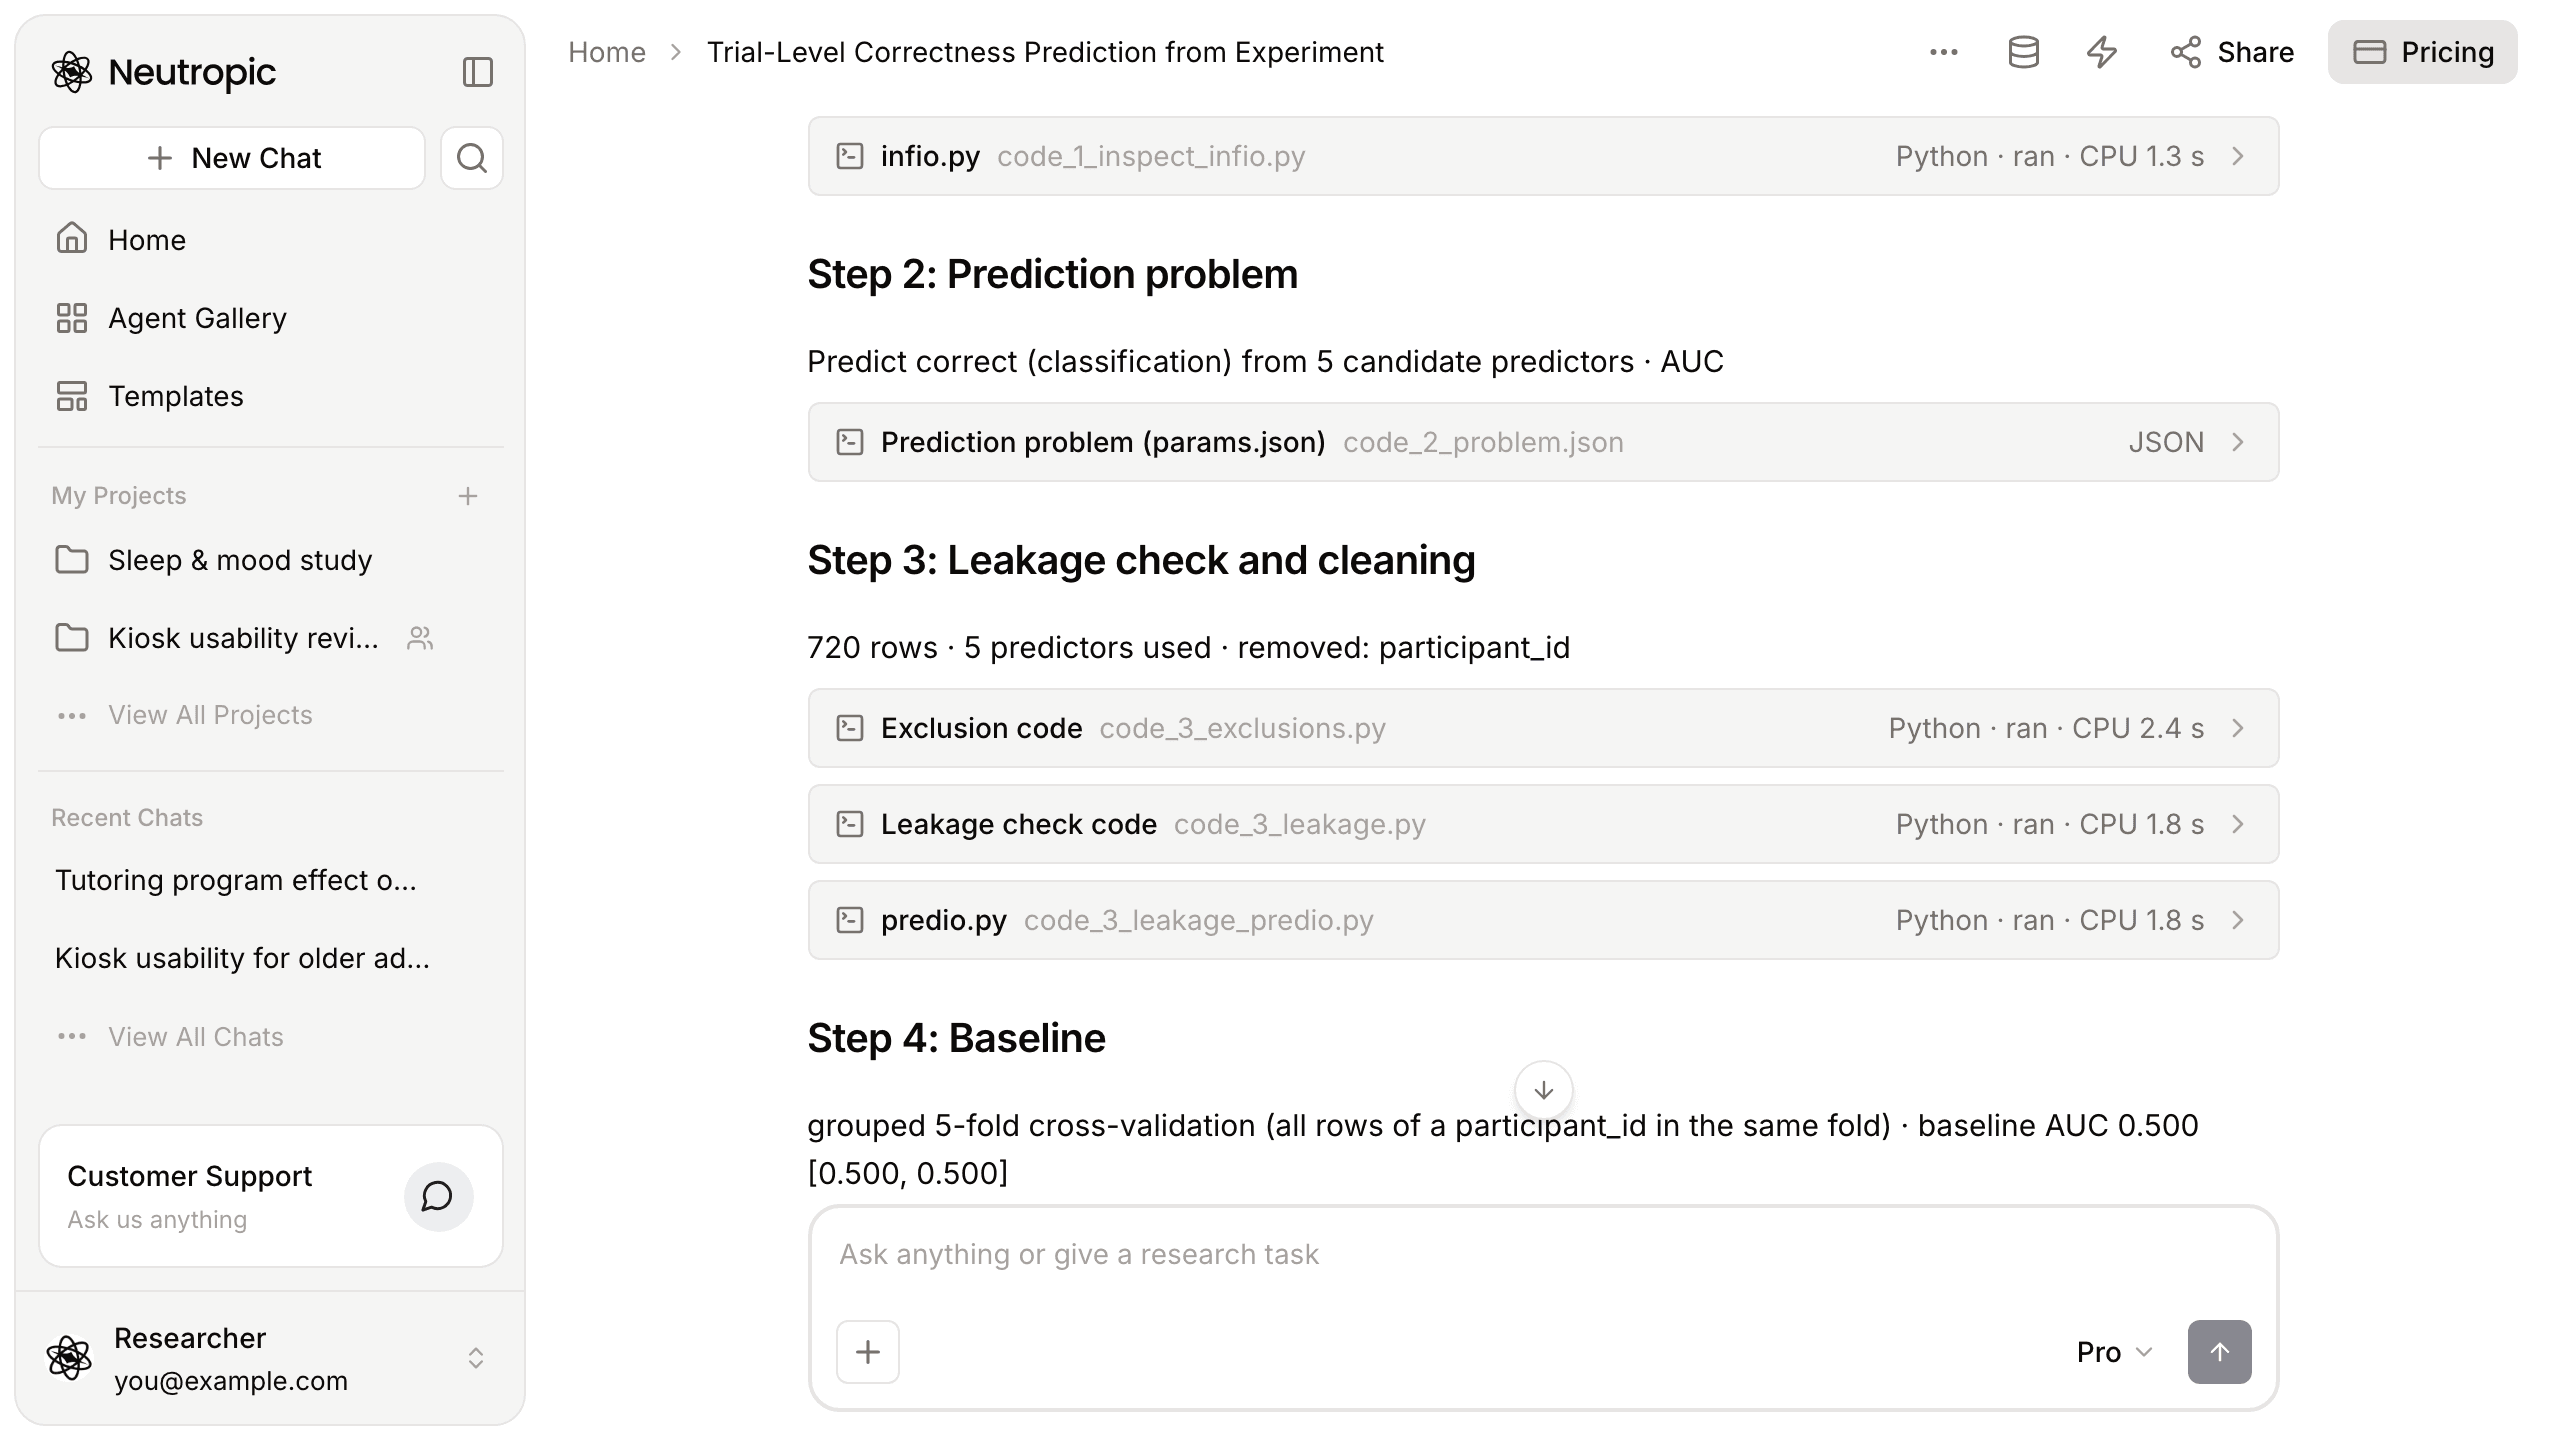
The fourth step, Baseline, set up grouped 5-fold cross-validation, with all rows of a participant_id in the same fold. Every participant's eight trials stay together, so at test time the model always faces people it has never seen. The baseline, which only knows the overall rate of correct answers, scored an AUC of 0.500.
The simplest of four models won
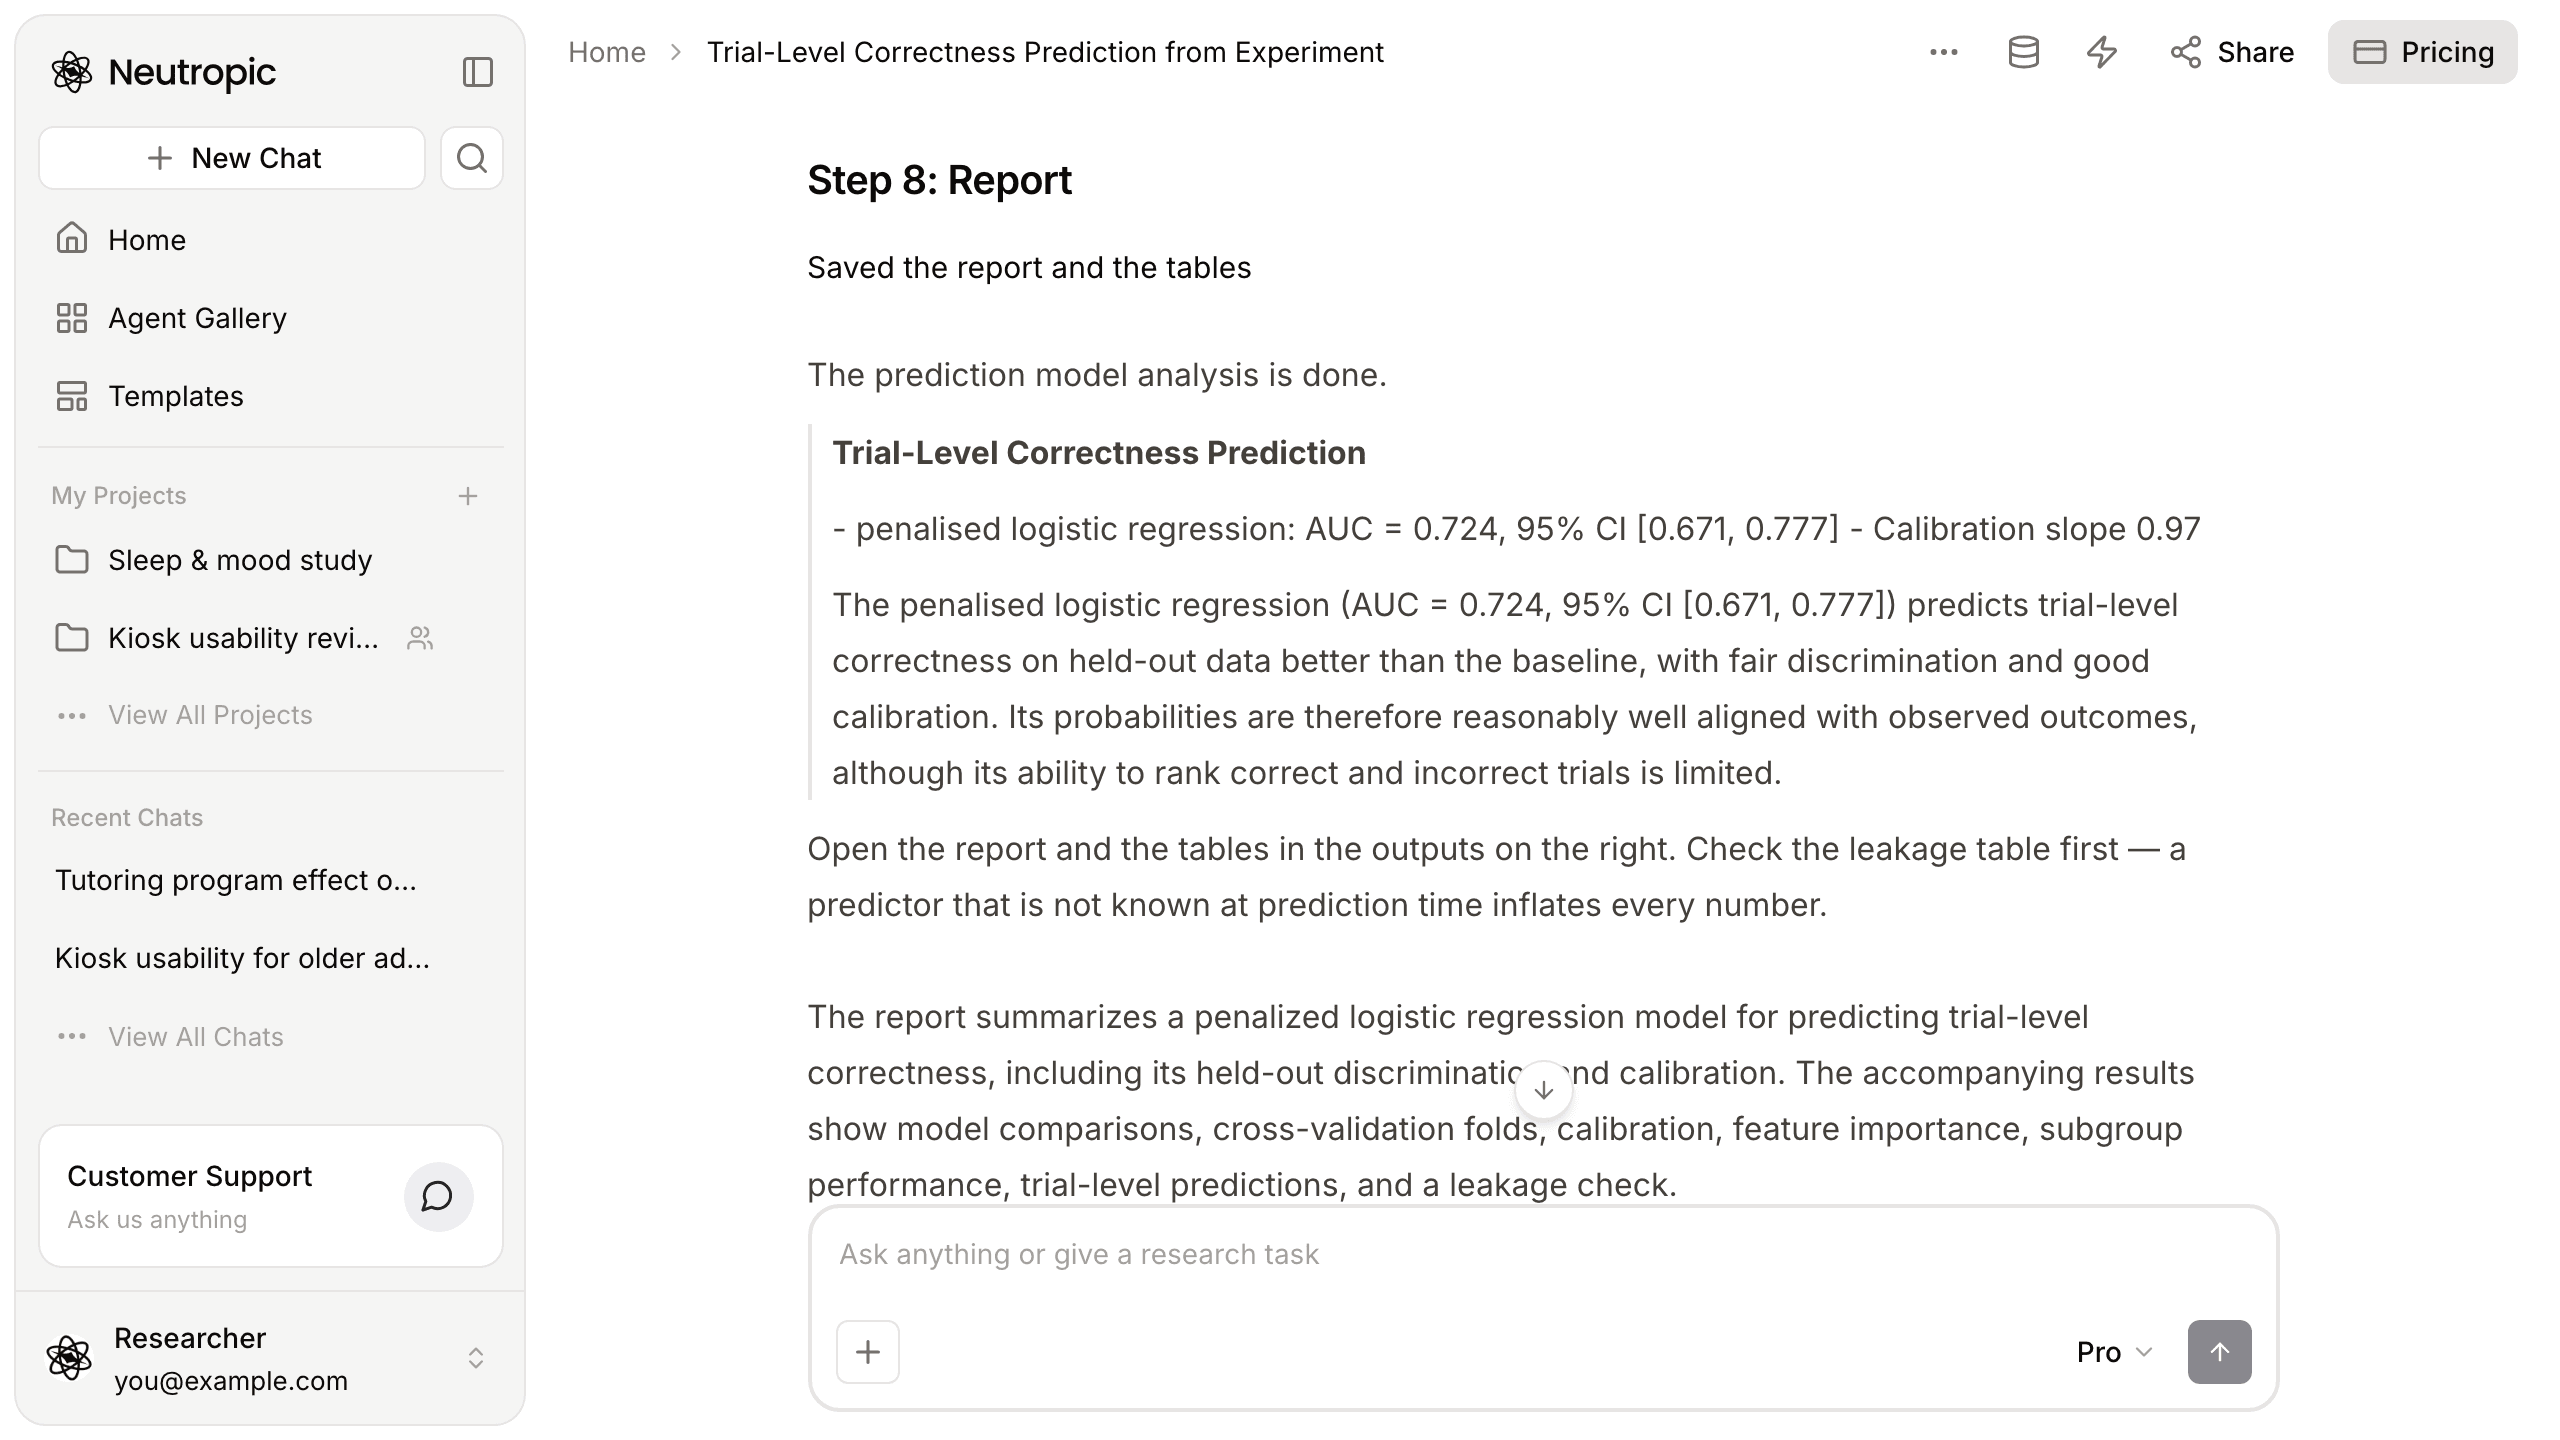
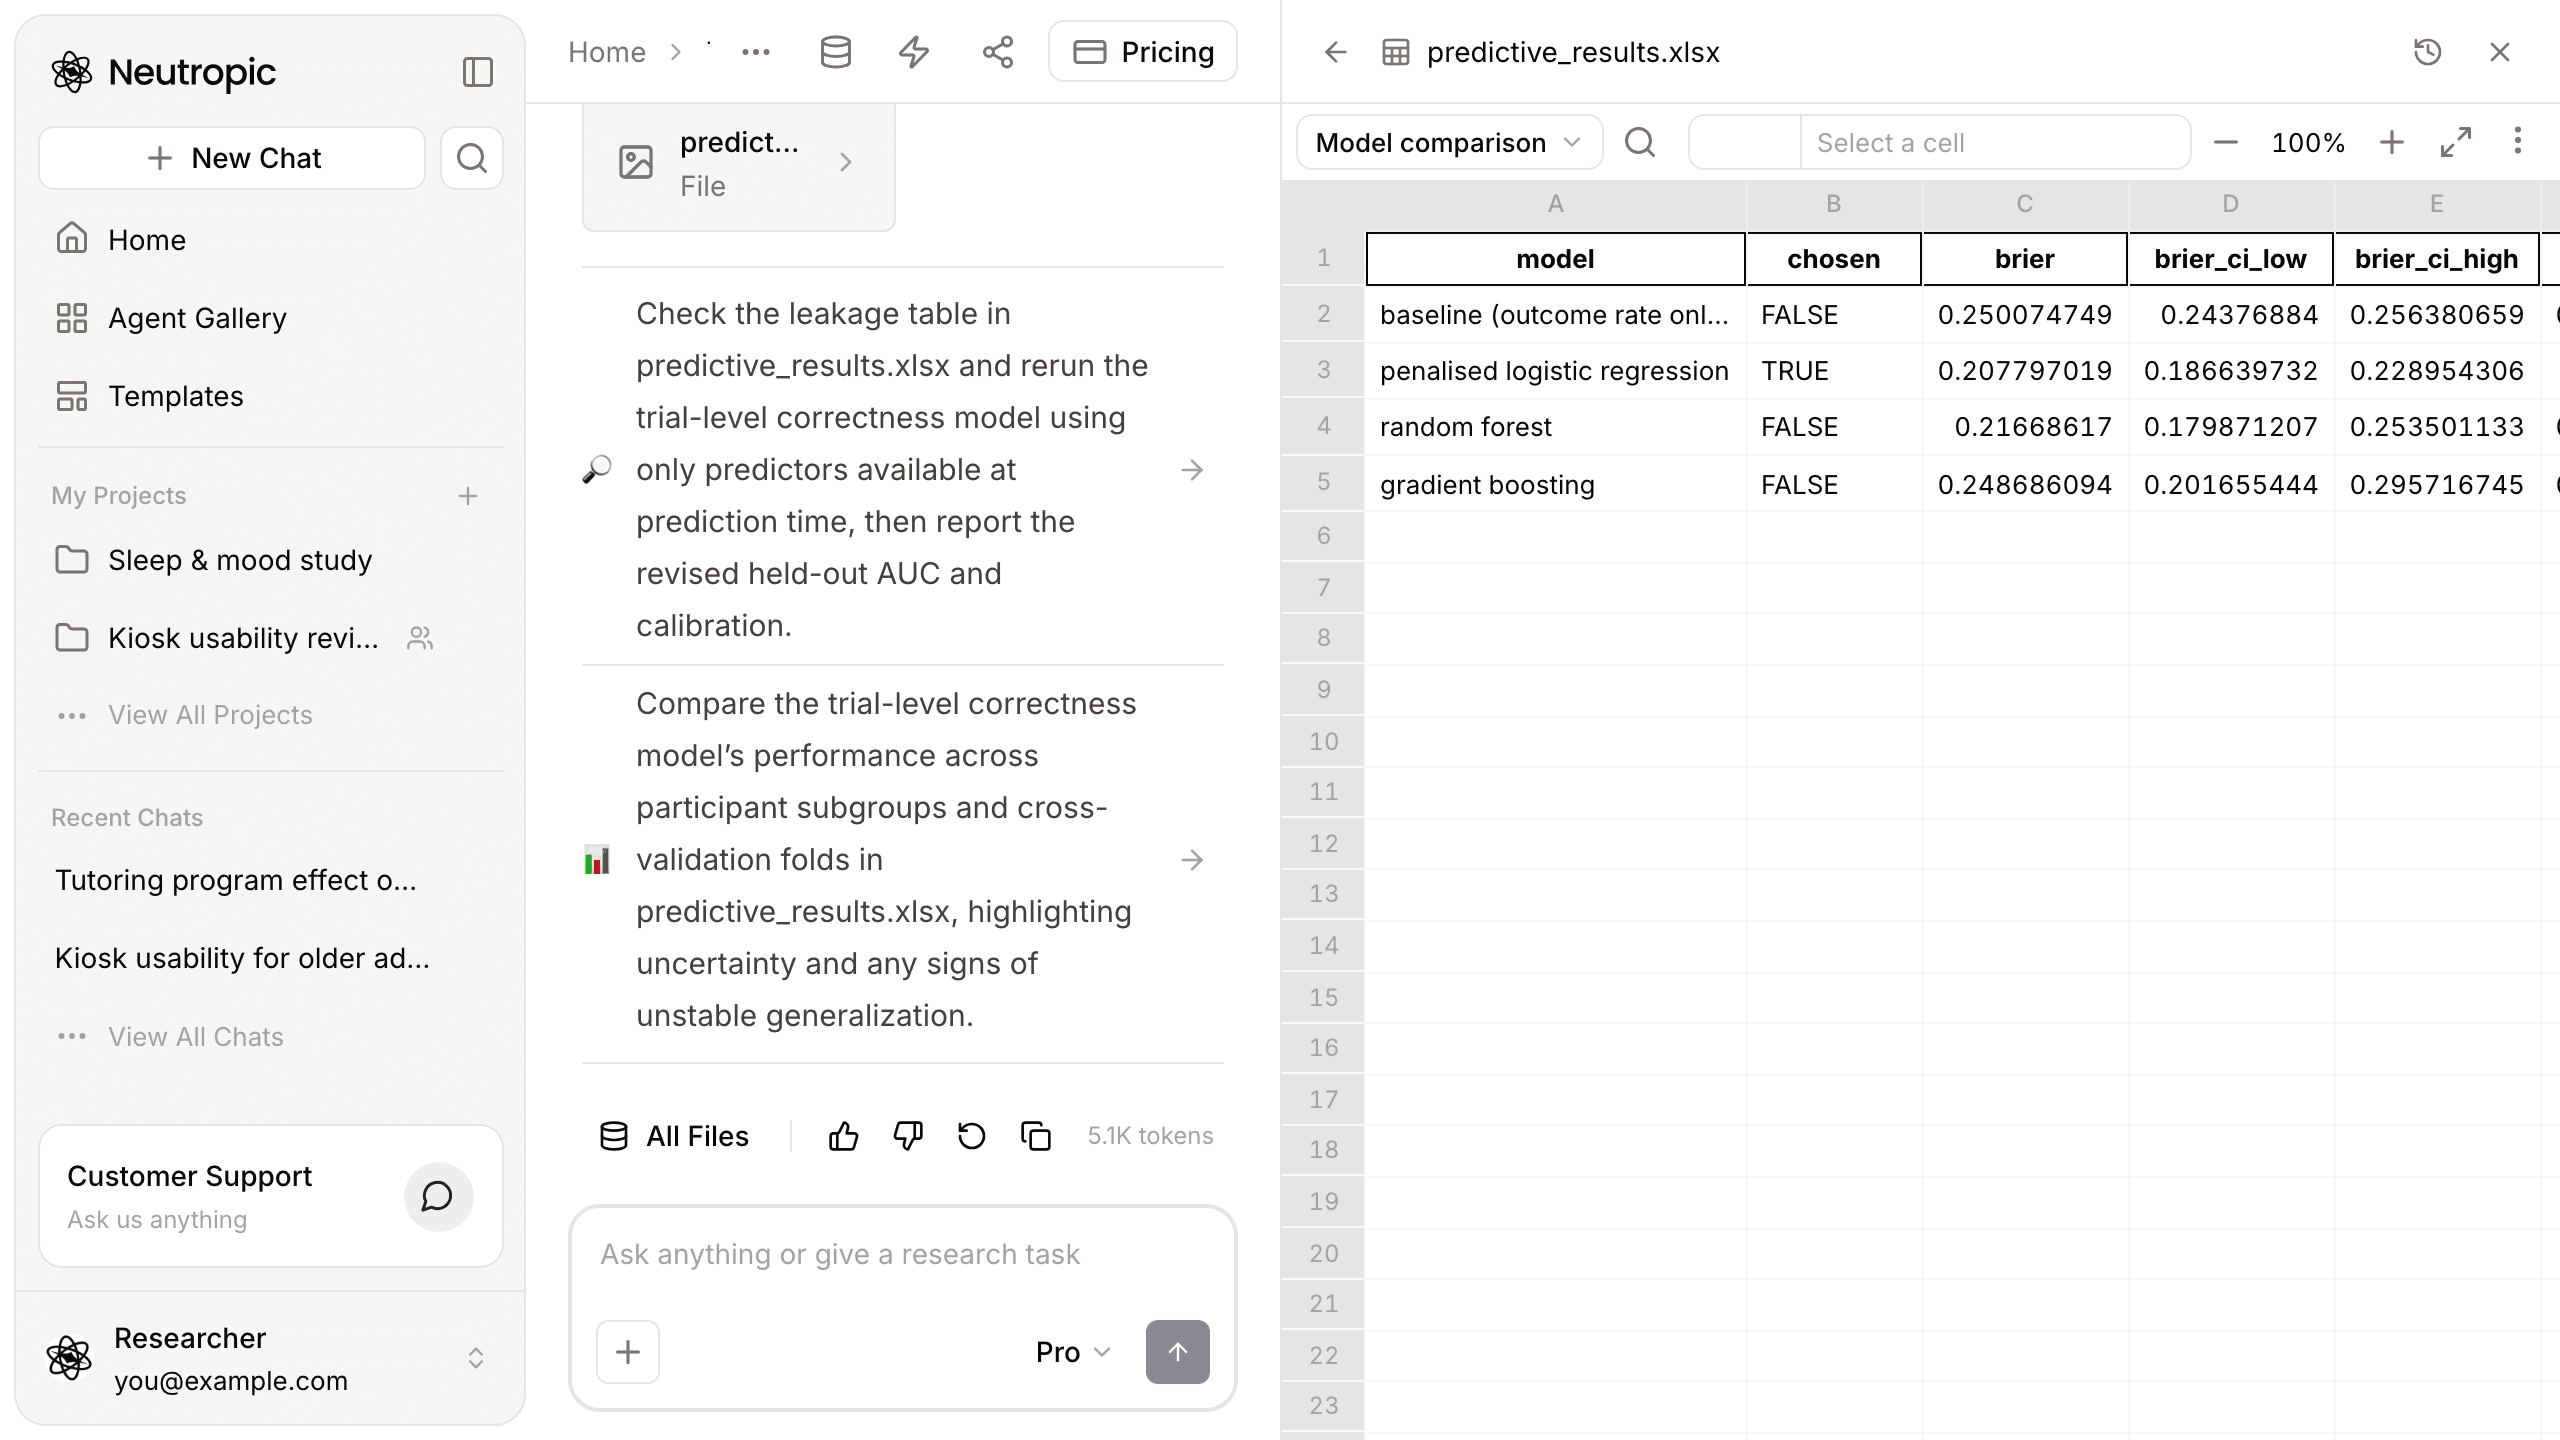
In step five, a penalised logistic regression, a random forest and gradient boosting were compared on the same folds. The best was penalised logistic regression, AUC 0.724, 95% CI [0.671, 0.777]. Brier scores in the results table told the same story: baseline 0.250, penalised logistic regression 0.208, random forest 0.217, gradient boosting 0.249.
Calibration and threshold reported a calibration slope of 0.97, an intercept of -0.00, and at a threshold of 0.504 a sensitivity of 0.60 and specificity of 0.75. Contribution and subgroups found baseline_score, difficulty and age contributed most, and compared 16 subgroups.
Jordan nearly missed that response time was still in the model
Seeing AUC 0.724, Jordan wanted to start writing the results section. Then the last line of the answer stood out: "Check the leakage table first — a predictor that is not known at prediction time inflates every number."
The five predictors included rt_ms, the response time. Response time is only recorded at the moment someone answers. If the goal is to predict correctness before the response, it has to go. The agent's first suggested next step was exactly that: check the leakage table and rerun the model using only predictors available at prediction time.
We checked this ourselves on the same file. In this dataset response time is almost unrelated to correctness (r ≈ 0.01), and the AUC stayed around 0.73 with or without it. Lucky. In real data, one variable like this can move the numbers a lot.
The results table came with next steps
There were two outputs: a report, predictive_report.md, and a workbook, predictive_results.xlsx, with sheets for model comparison, per-fold performance, calibration, feature importance, subgroup performance, trial-level predictions and the leakage check. Each step's code box shows the Python that actually ran.
Below the answer were two suggestions:
- Check the leakage table and rerun the model using only predictors available at prediction time, then report the revised held-out AUC and calibration
- Compare performance across participant subgroups and cross-validation folds, highlighting uncertainty and signs of unstable generalisation
Jordan would start with the first.
A number that could have been inflated became a number about new people
| At the start | Now | |
|---|---|---|
| Cross-validation | Was going to shuffle rows | 5-fold CV grouped by participant_id |
| Predictors | Every column | Five, participant ID removed, plus a leakage table |
| Models | No idea which to use | Four compared, penalised logistic regression chosen |
| Performance | A single number | AUC 0.724 [0.671, 0.777], calibration slope 0.97 |
| Outputs | None | Report, results workbook, code for each step |
There are limits. An AUC around 0.72 is fair discrimination, and whether that is useful depends on a purpose you should fix in advance. Grouped cross-validation estimates performance on new participants, not on the next trial of someone already known. And whether a variable recorded at the same time as the outcome, like response time, belongs in the model is a call you make from your research question.
This walkthrough used Pro and took about 100 seconds. Pro adds calibration, thresholds, contributions and subgroups. Lite (the free plan) stops after the model comparison; Expert adds robustness checks and a longer discussion.
With repeated-measures data, predictive performance has to be measured on new people. One file and one line get you that baseline.
This week, upload your experiment log and ask in one line, just like Jordan. Start with Neutropic for free