Hi, this is the Neutropic team!
Say you have built a model to flag students at risk of dropping out, and it scores 95% accuracy. Before you show it to your supervisor, a doubt creeps in. Only about 5% of students drop out. Wouldn't a model that predicts "nobody drops out" also score 95%? 🥲
It would. When positives are rare, accuracy tells you almost nothing. But knowing what to look at instead, when class weights or resampling help, and how to choose a decision threshold is a lot to sort out at once.
In this post we follow Riley, an education PhD student, as they test that doubt and rebuild their evaluation. Riley is fictional, but every screen below comes from a real chat in Neutropic.
Riley turned the doubt into a question
Riley didn't upload any data. They described the situation and asked for a run.
My binary classification problem has about 5% positives, and the model reaches 95% accuracy. How should I evaluate and train models on imbalanced data like this? I'll use Python — please run a comparison on simulated data.
Three things make this a good request. The prevalence (5%) and the suspicious number (95%) are both there, so the problem is obvious. It asks about evaluation and training. And "please run a comparison" means you get results from executed code, not just advice.
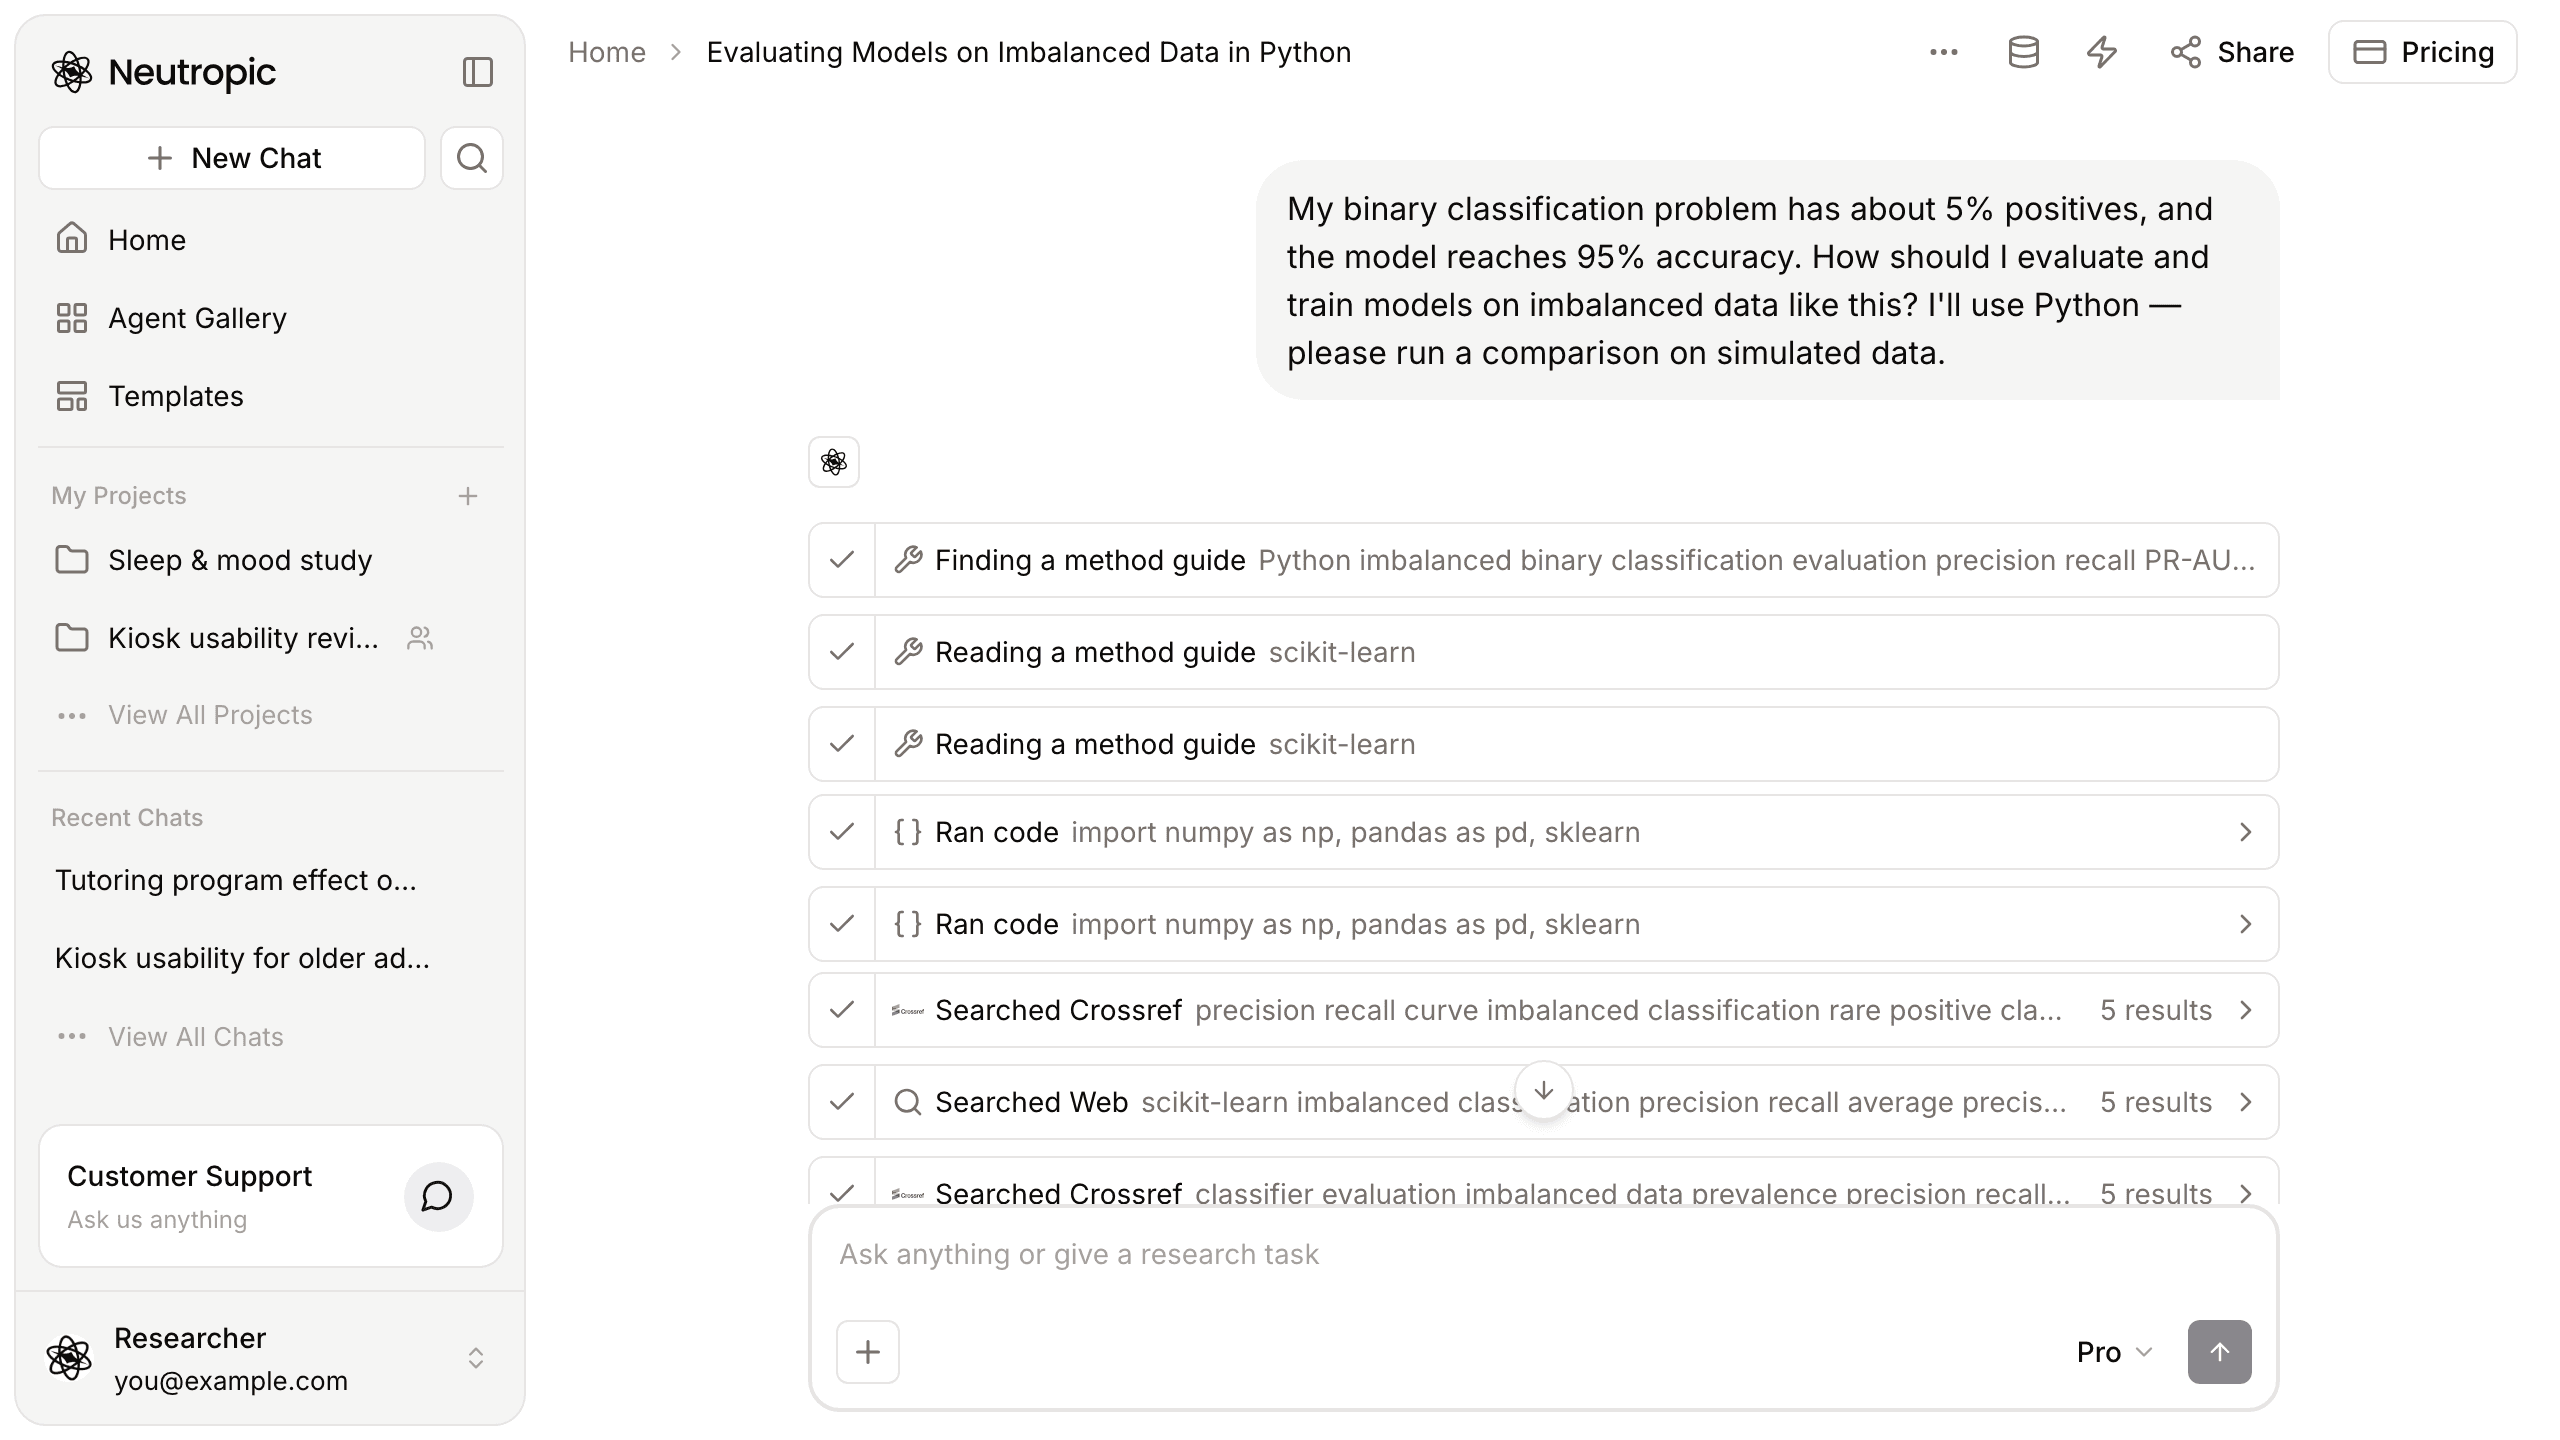
It read a scikit-learn guide, then ran the comparison
Steps appeared: Finding a method guide, then Reading a method guide for scikit-learn, two Ran code steps and several searches of Crossref and the web. The narration was candid along the way: the first execution printed no results, so it reran a smaller simulation with explicit output checks before reporting anything.
The always-negative baseline scored 94.5%
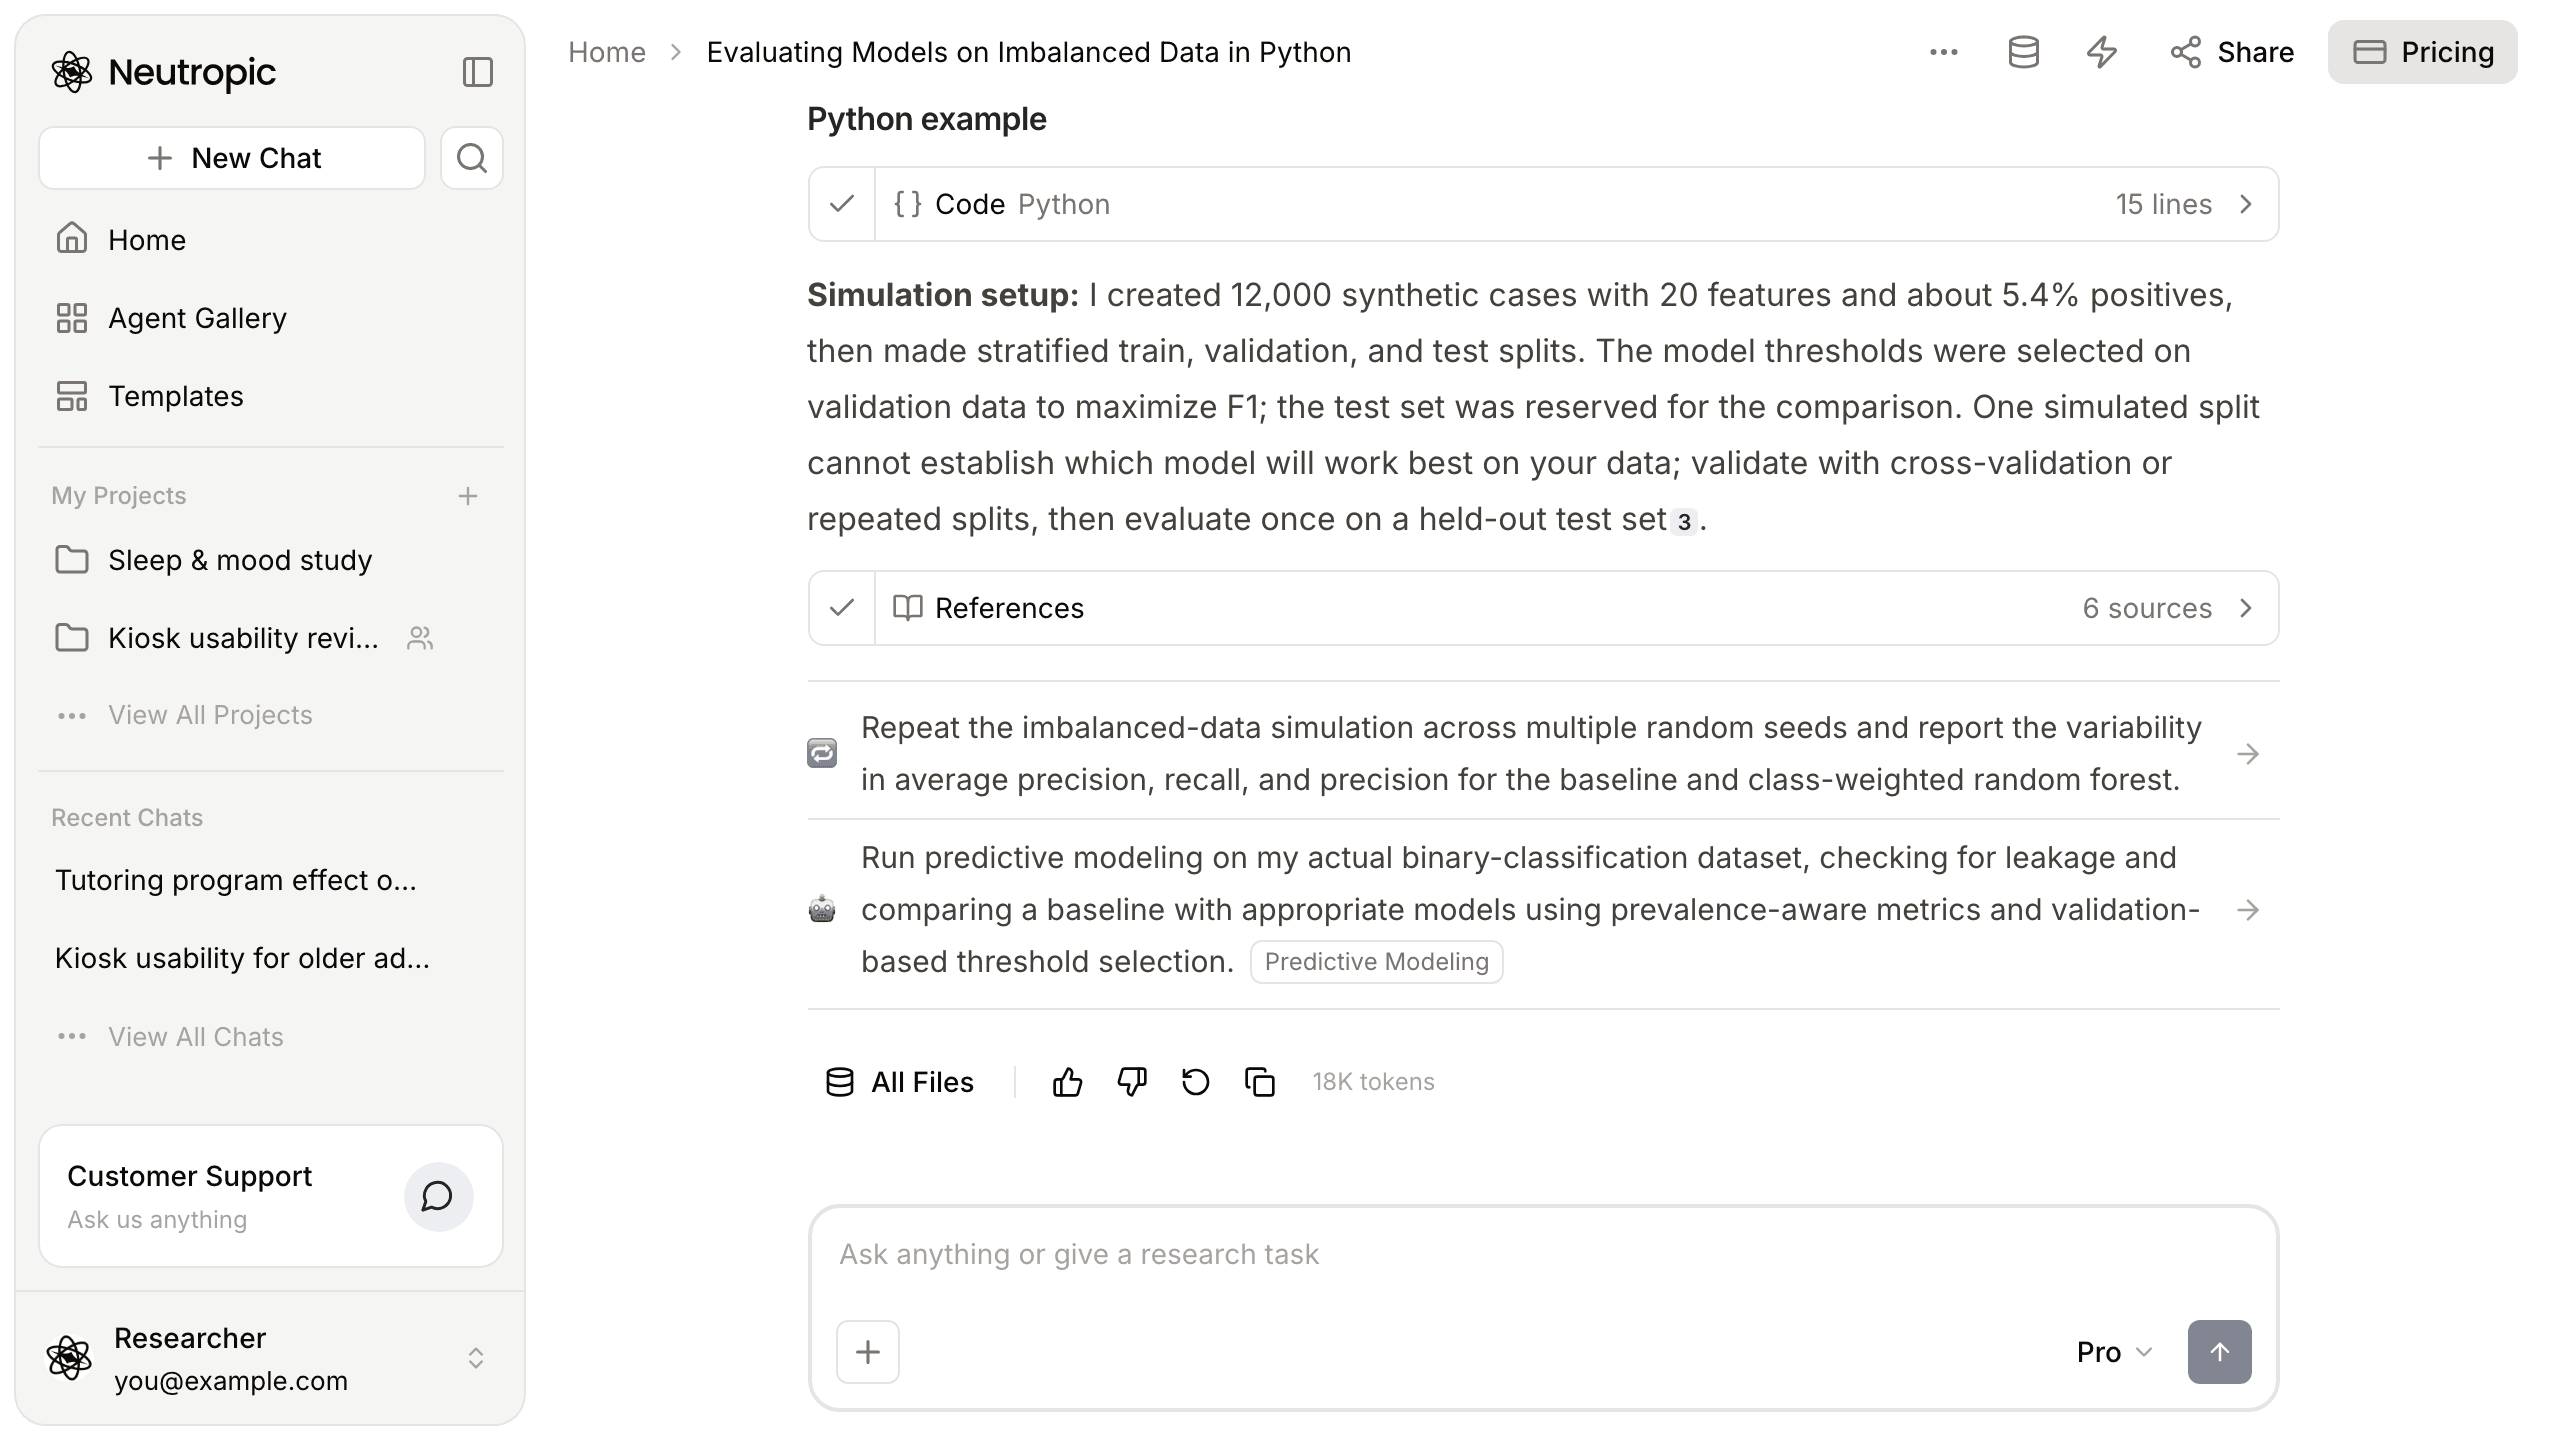
The simulation used 12,000 synthetic cases with 20 features and about 5.4% positives, split into stratified training, validation and test sets. Each model's decision threshold was chosen on the validation set to maximise F1, and the test set was kept for the final comparison only.
The headline confirms Riley's fear. The always-negative baseline reached 94.5% accuracy, 0% recall and 0.055 average precision. A class-weighted random forest reached 96.6% accuracy, 72.5% recall, 67.4% precision and 0.722 average precision. It found 95 of the 131 test positives, missed 36 and raised 46 false alarms.
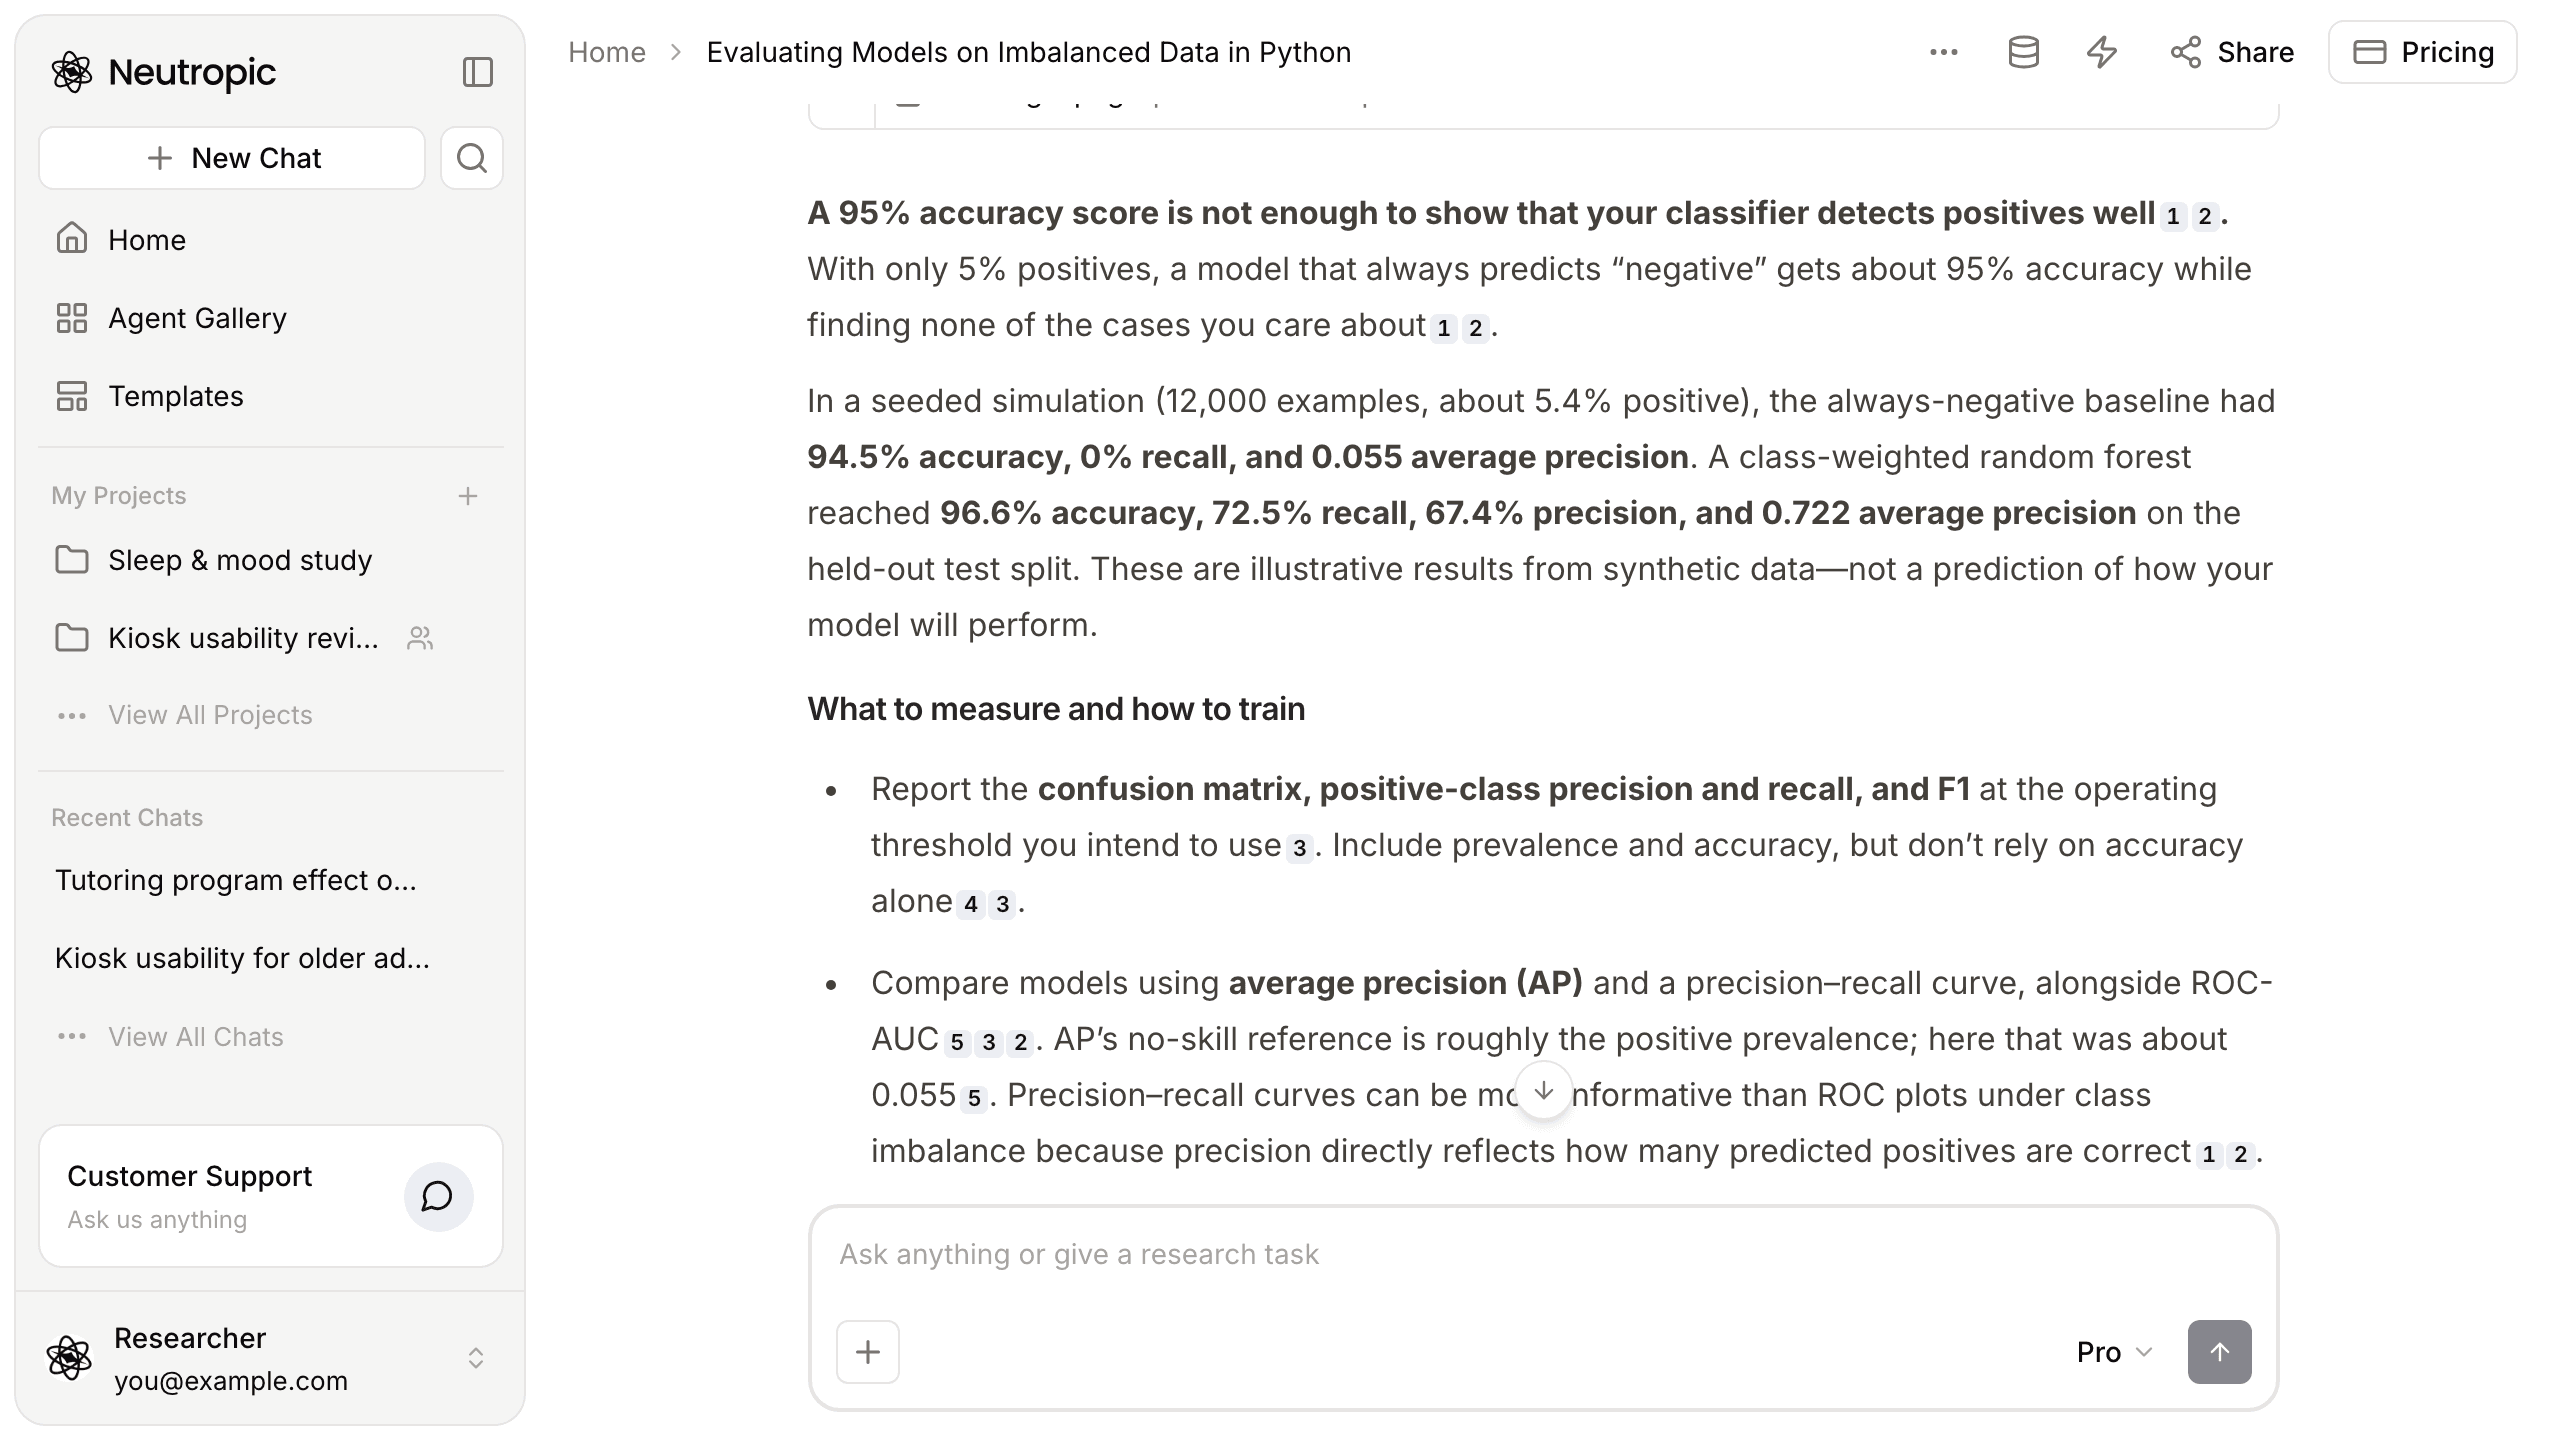
The comparison it ran also included a class-weighted logistic regression and gradient boosting. The logistic regression is a nice illustration of how accuracy misleads in both directions: at 89.9% accuracy it scored below the do-nothing baseline, yet it found about half of the positives.
Riley nearly crowned a winner
This is where Riley nearly made a mistake. The forest has the best accuracy and solid recall, so it is tempting to write "random forest performs best" and move on. But gradient boosting edged it on average precision (0.731 against 0.722), and the answer says plainly that one simulated split cannot establish which model will work best on your data. It recommends validating with cross-validation or repeated splits, then evaluating once on a held-out test set. The numbers are illustrative, not a forecast for Riley's dataset.
It laid out what to measure and how to train
The answer then turned the run into a checklist:
- Report the confusion matrix, positive-class precision and recall, and F1 at the threshold you intend to use. Include prevalence and accuracy, but don't rely on accuracy alone.
- Compare models with average precision and a precision–recall curve, alongside ROC-AUC. Average precision's no-skill reference is roughly the prevalence, about 0.055 here.
- Set the threshold from the relative costs of missed positives and false alarms, using validation data, never the final test set.
- Try class weighting first. Resample only inside training folds, and use group-based or time-based splits if observations are related.
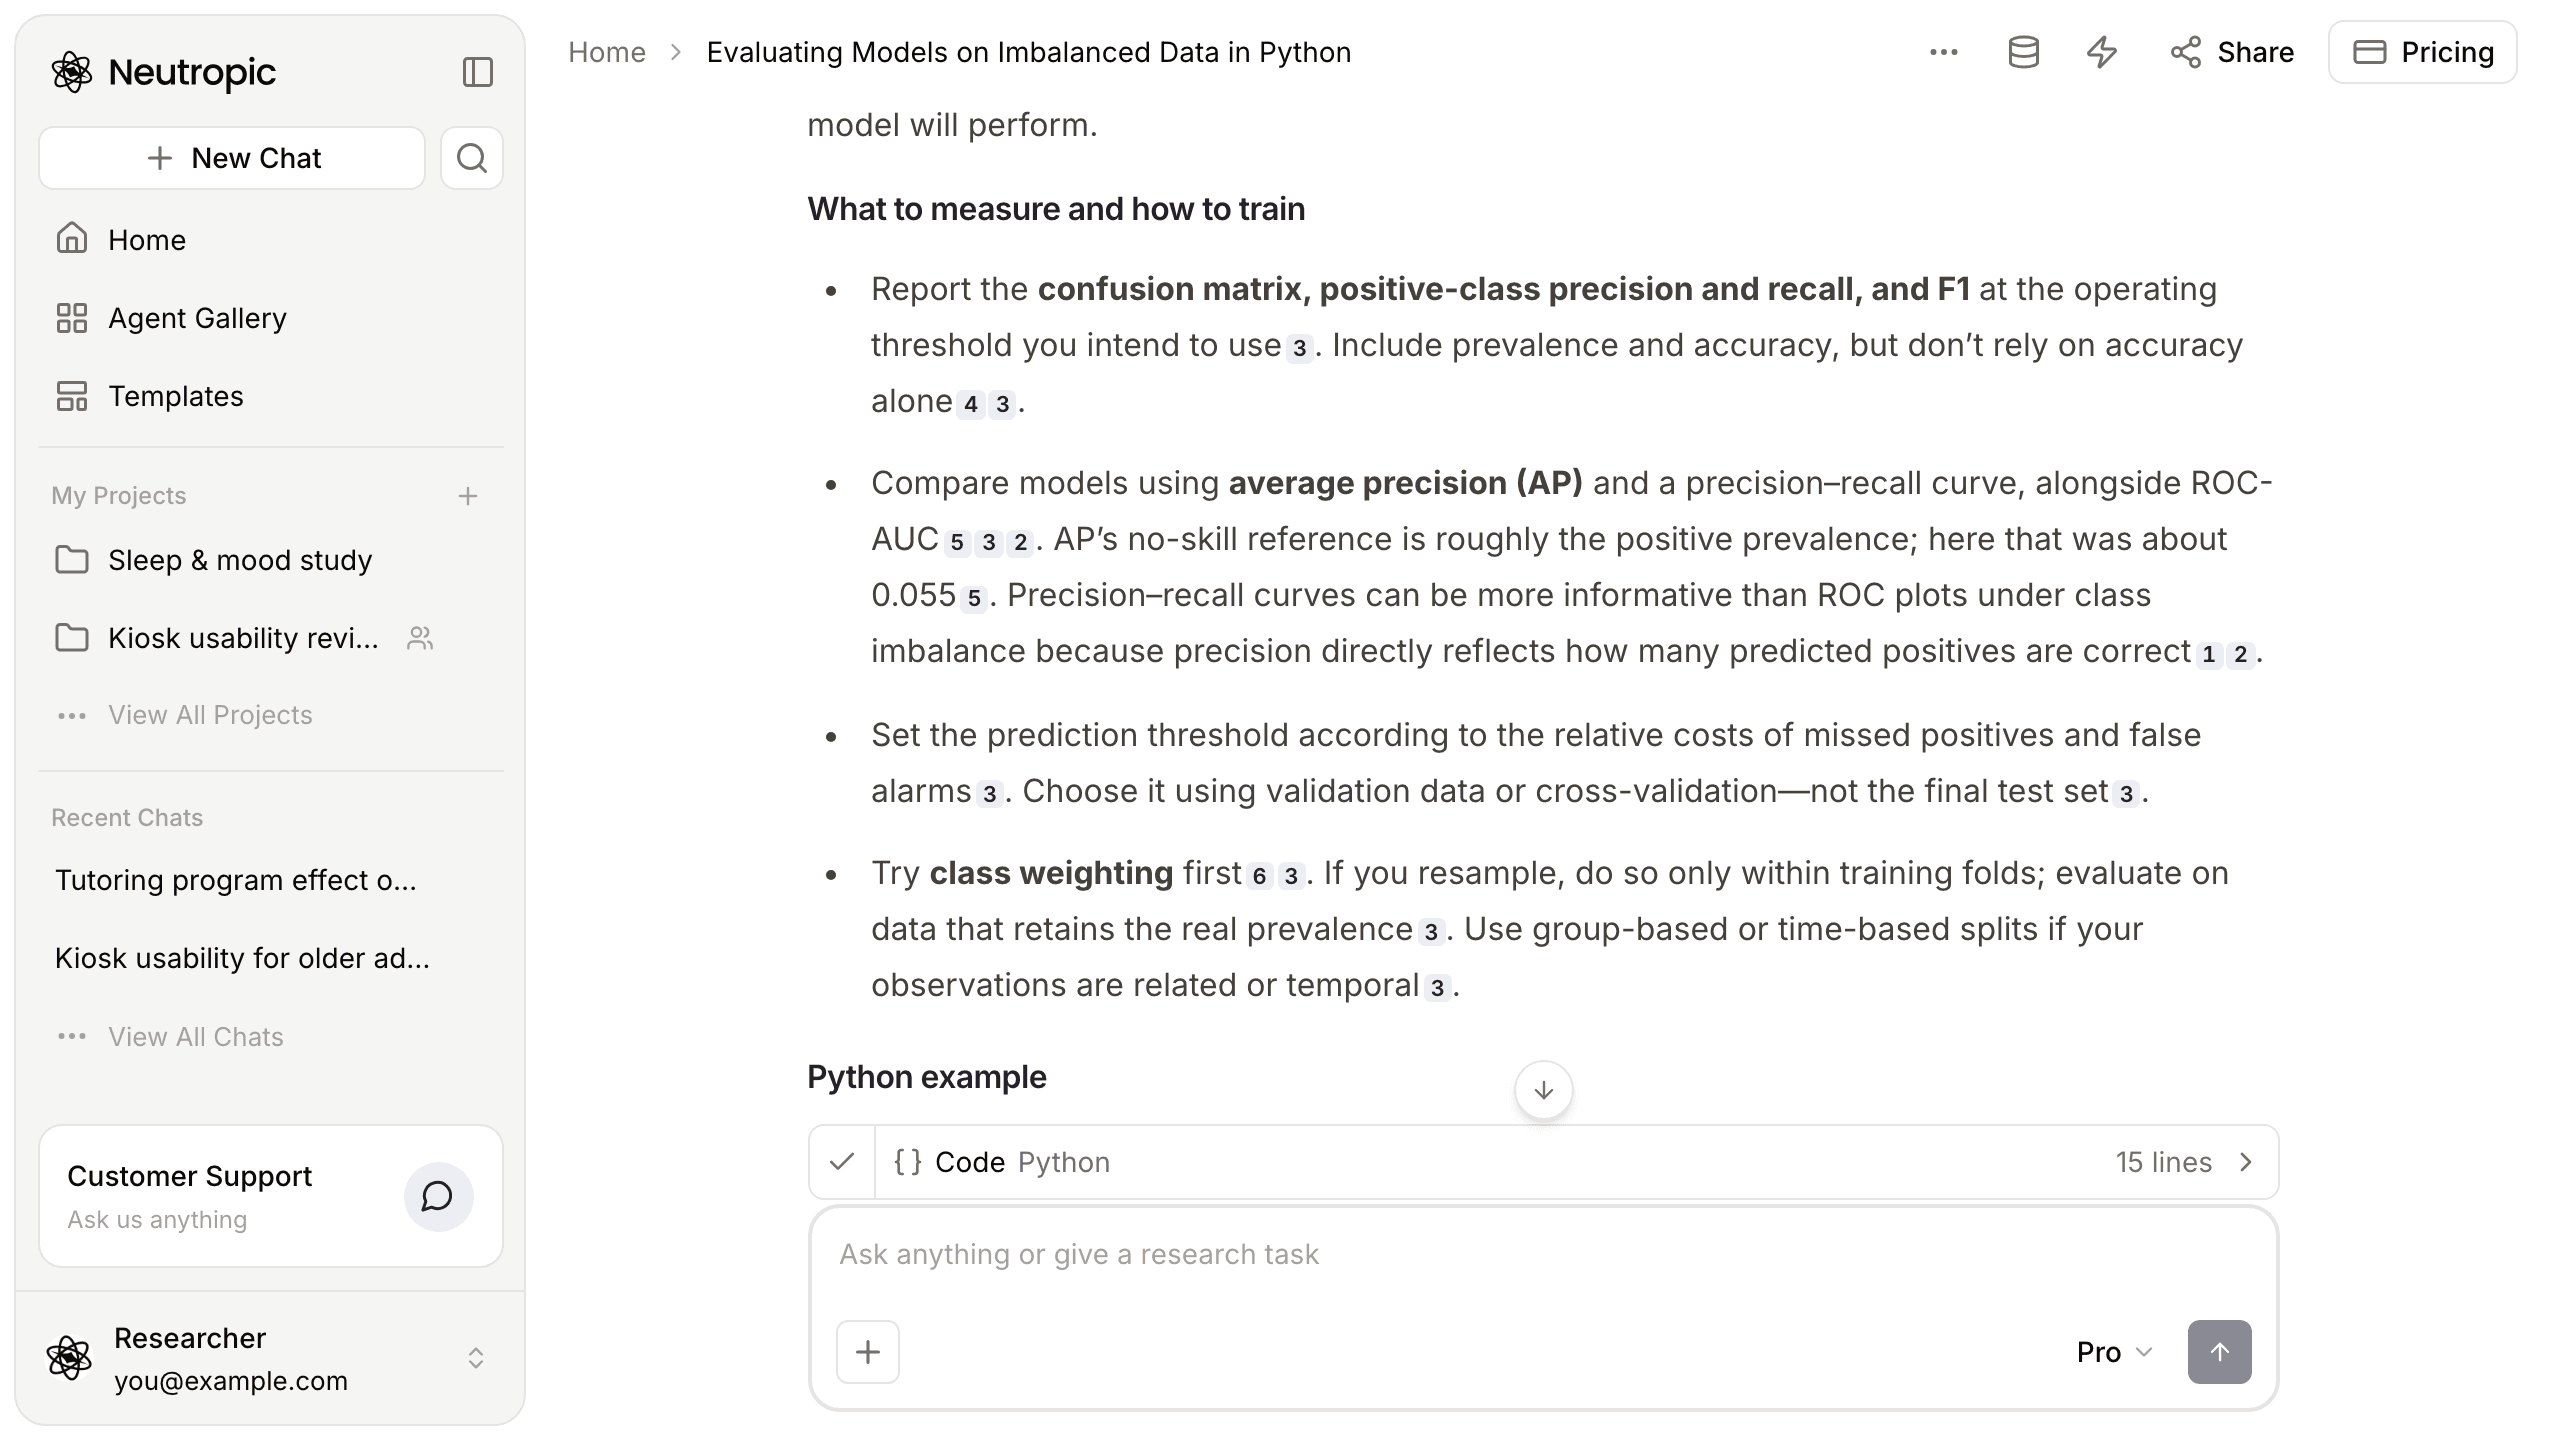
The code is a template, not the simulation
The answer included 15 lines of Python, and the card opens them in the right-hand pane with a copy button. To be clear about what it is: a pattern to drop your own fitted model into. It scores validation and test data, applies an example threshold of 0.30 and prints prevalence, average precision, the confusion matrix and a classification report. It is not the simulation itself, so we did not treat it as a reproduction of the numbers above; those came from the code steps.
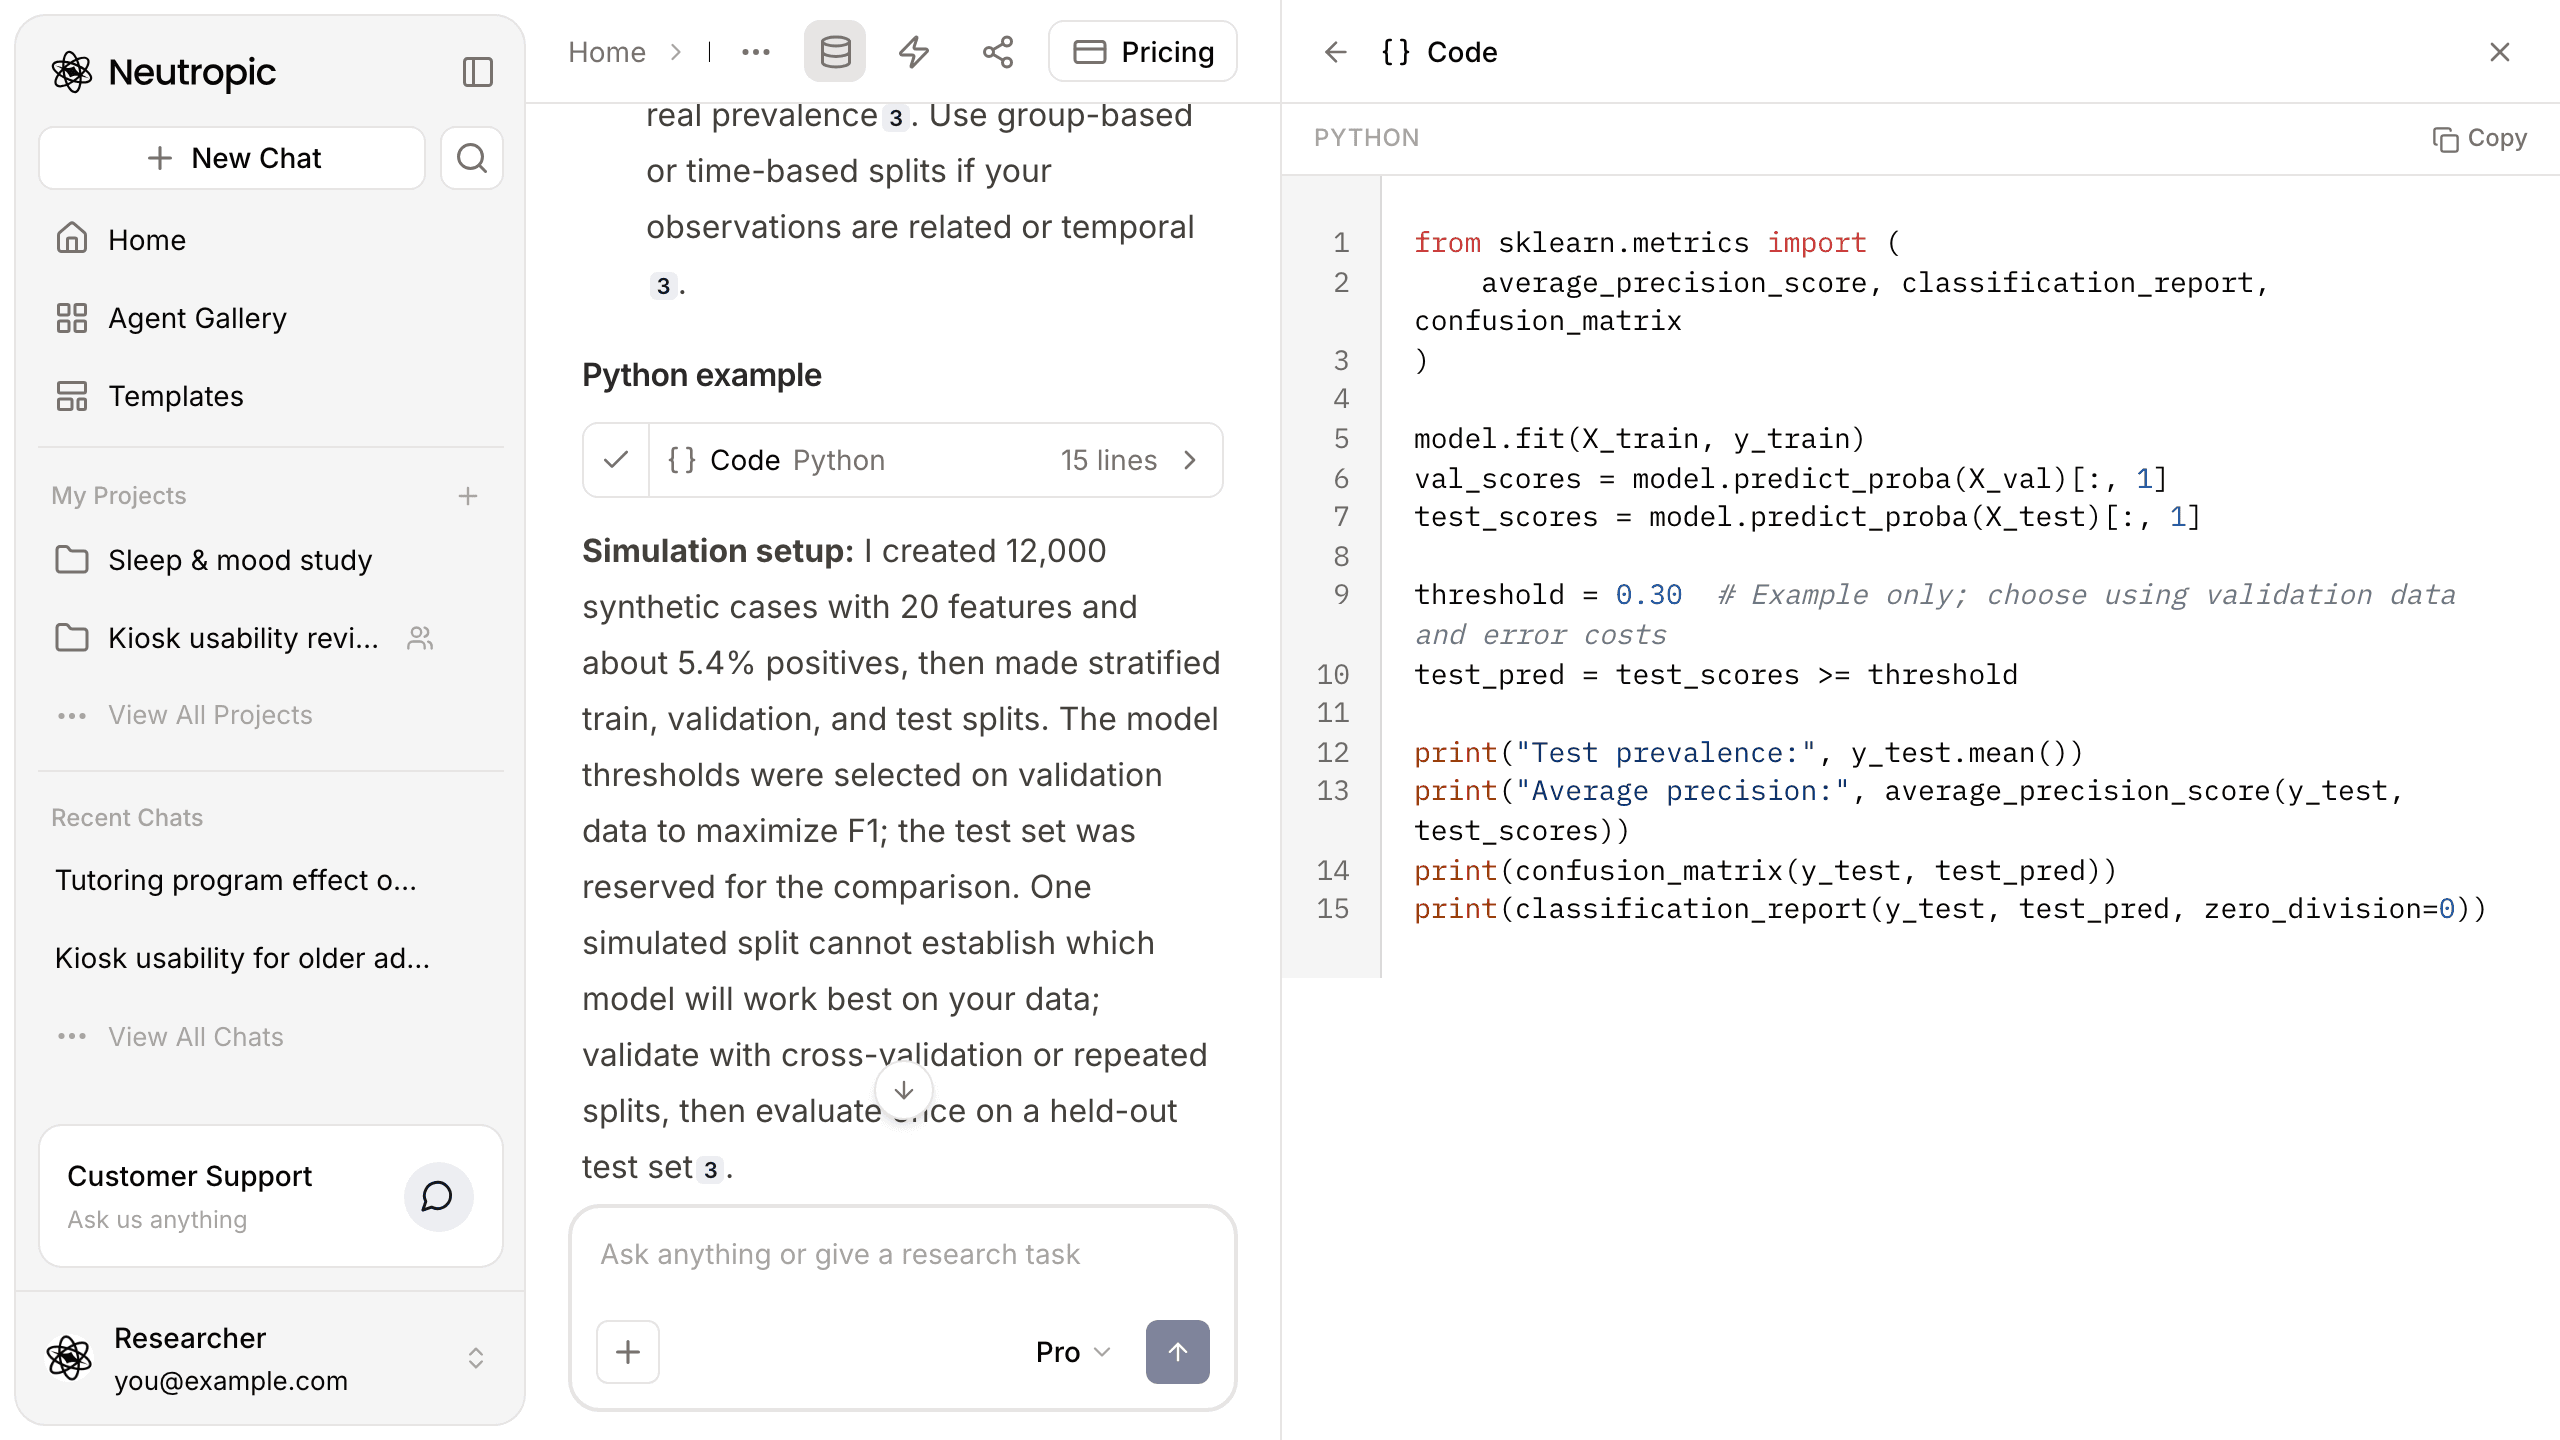
The sources came with it
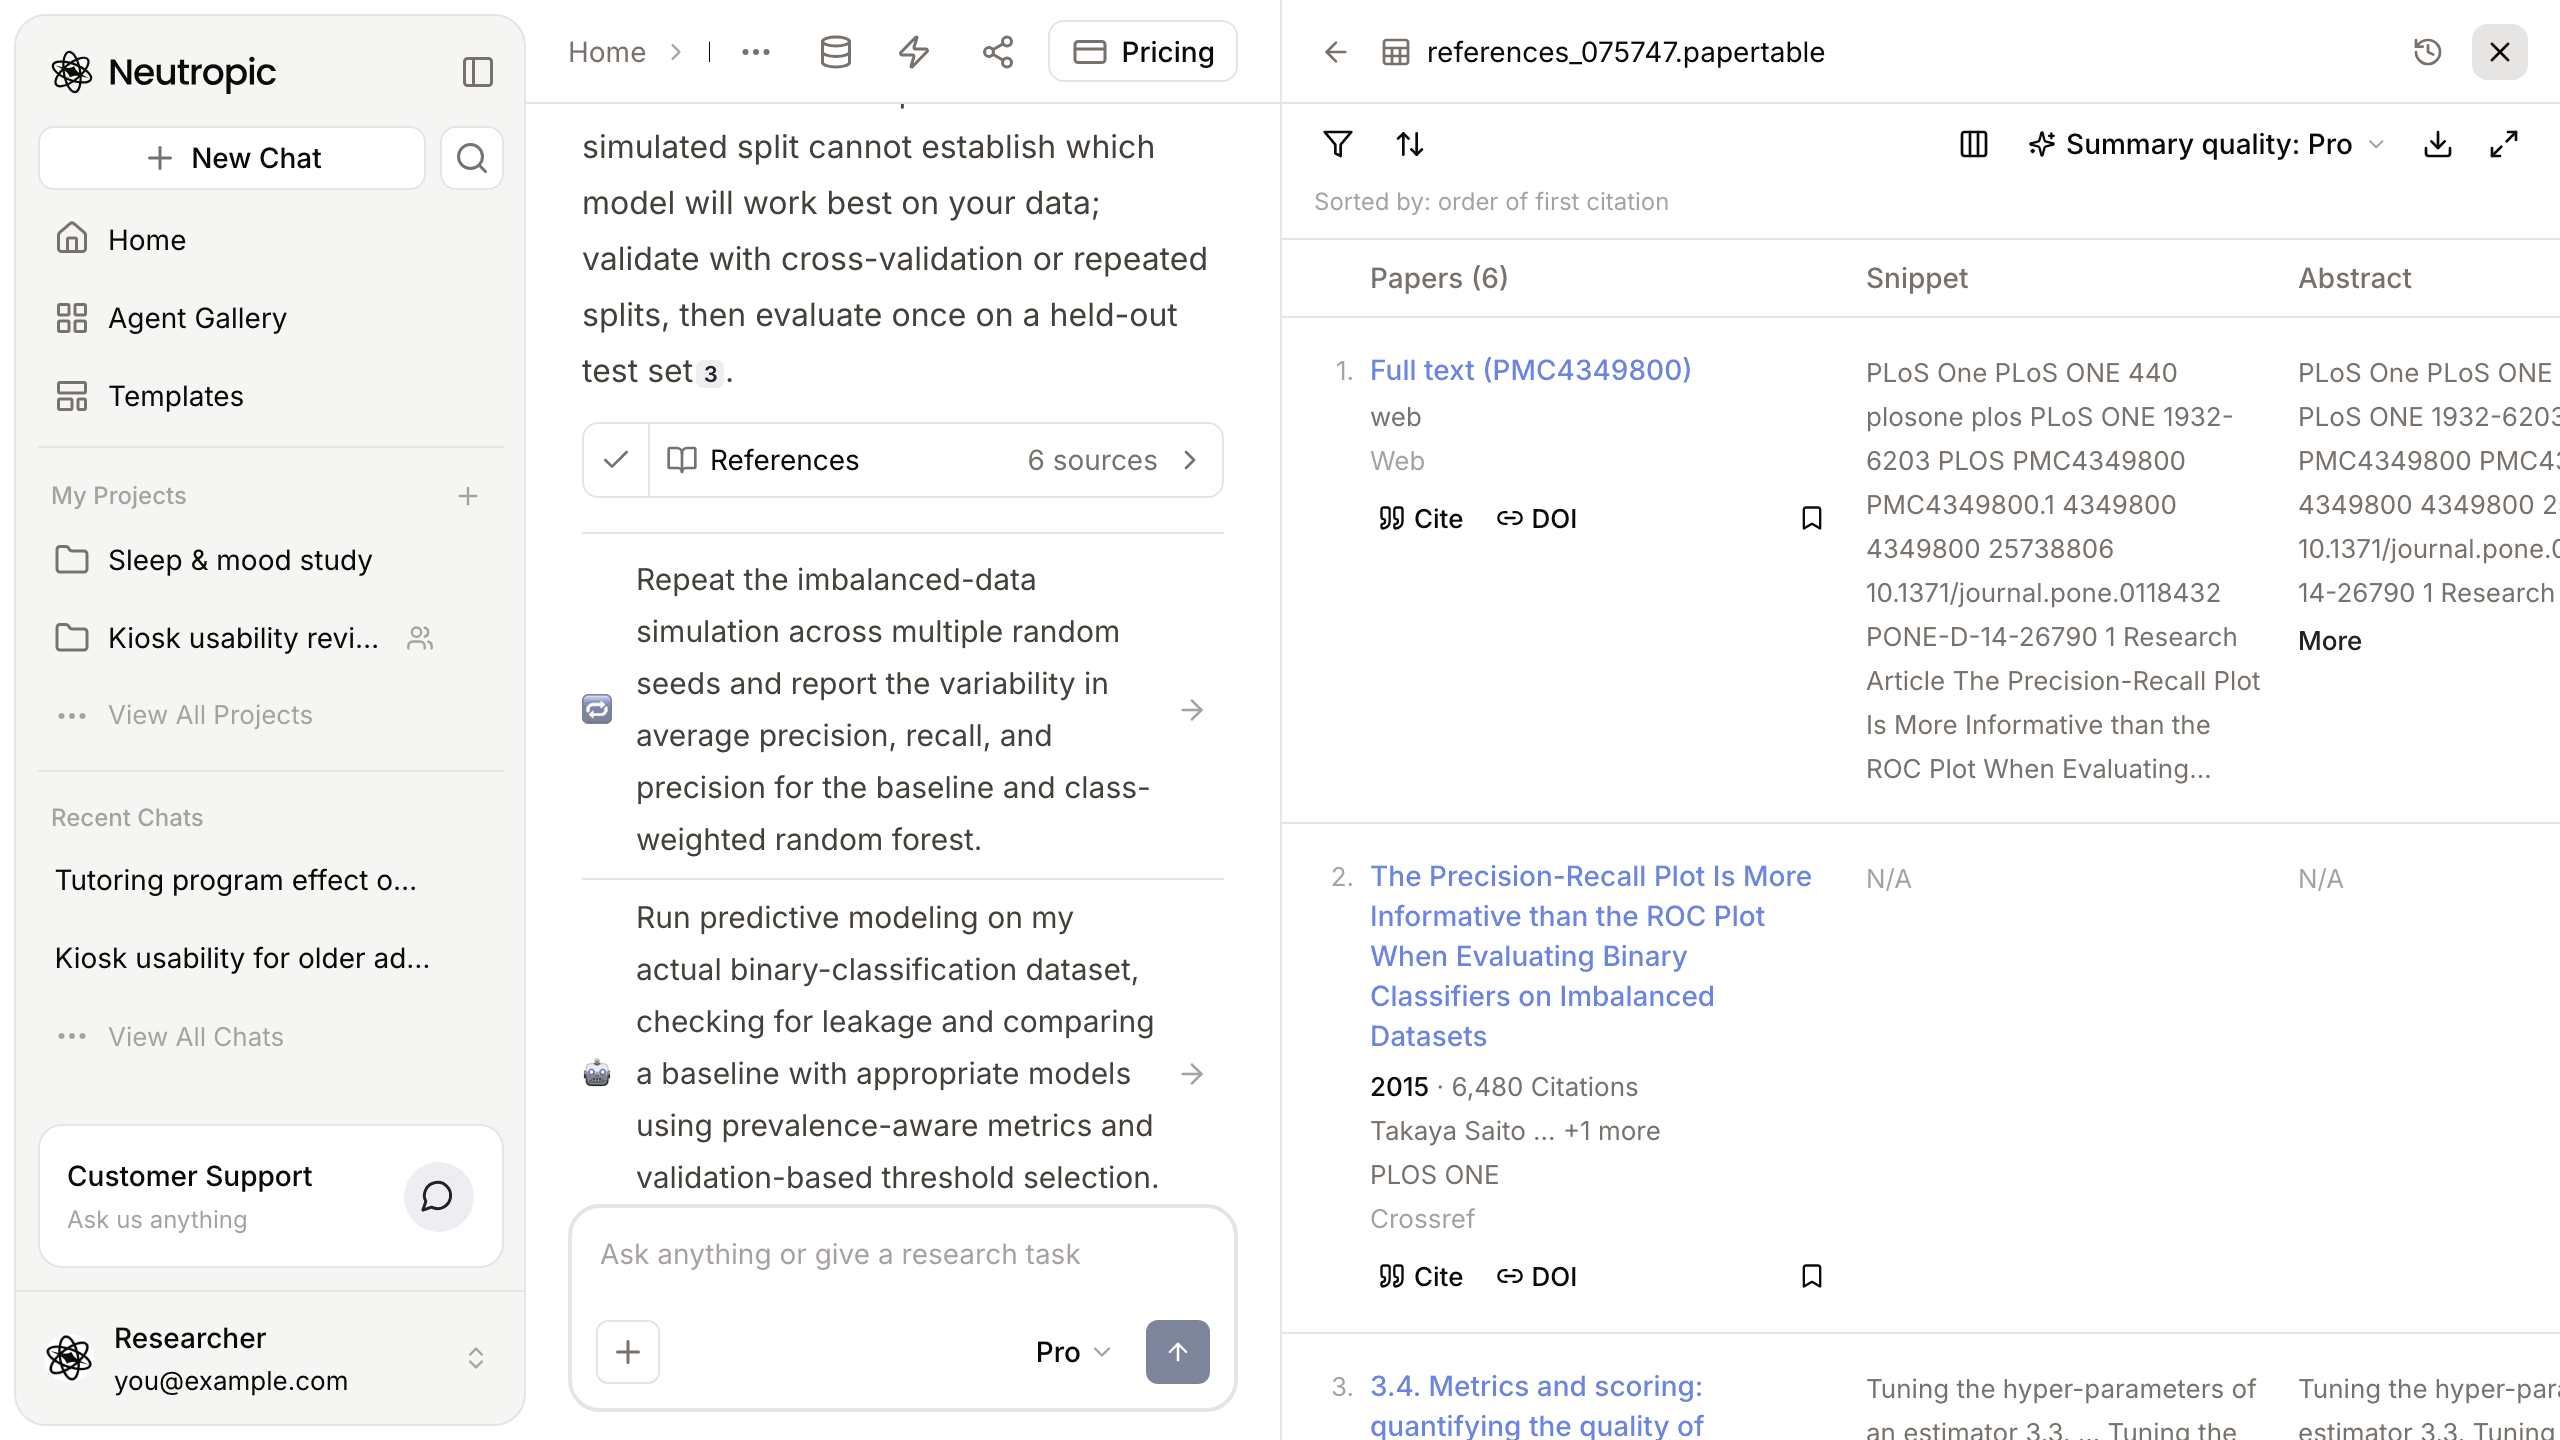
The small numbers in the text are citations. The References card opens six sources: the 2015 paper showing that precision–recall plots are more informative than ROC plots on imbalanced data, scikit-learn's metric pages, and a community Q&A thread. Two of the six entries point to the same paper (the paper and its full text), so there are really five distinct sources. When writing up, lean on the paper and the official documentation.
It suggested what to do next
At the bottom were two suggestions:
- Repeat the simulation across multiple random seeds and report the variability in average precision, recall and precision for the baseline and the class-weighted random forest
- Run predictive modelling on your actual dataset, checking for leakage and comparing a baseline with appropriate models using prevalence-aware metrics and validation-based thresholds — Predictive Modeling agent
Click one and the conversation continues in the same chat. Riley, still unsure about crowning the forest, would probably start with the first.
A reassuring number turned into the right questions
| At the start | Now | |
|---|---|---|
| Yardstick | 95% accuracy | Precision, recall, F1, average precision, confusion matrix |
| Comparison | One model | Baseline vs three models on the same test set |
| Threshold | Fixed at 0.5 | Chosen on validation data from error costs |
| Training | Hoping resampling fixes it | Class weights first; resampling only inside training folds |
| Next | Unsure what to try | Seed-variability check, or a run on the real data |
Of course this is synthetic data from one seeded split. Real data with a different prevalence, groups or time structure can change the picture completely. And the attached code is an evaluation template, so if you want the simulation itself, ask for it in a follow-up.
This walkthrough used Pro. Lite (the free plan) explains the metrics without running a simulation; Expert also compares resampling methods and calibrates the probabilities.
When positives are rare, ask how many cases the model found and missed before you ask how accurate it is.
This week, write down your prevalence and the number that worries you, and ask — just like Riley. Start with Neutropic for free