Hi, this is the Neutropic team!
Picture this: your conference poster is due in a week. A labmate swears by LaTeX for posters and points you to beamerposter. Then the decisions pile up: paper size, columns, block colours, font sizes. And when the results box looks a little empty, it is tempting to fill it with numbers you never actually reported. 🥲
In this post we follow Priya, a master's student in clinical psychology, preparing a first conference poster in LaTeX. Priya is fictional, but every screen below comes from a real chat in Neutropic.
Priya pasted in the study summary
All Priya had was the one-paragraph summary from the abstract, so that went straight into the request:
I want to make a conference poster in LaTeX (beamerposter). The study: a cross-sectional survey of 120 university students on sleep quality (PSQI) and depression (PHQ-9); correlation r = .41, poorer sleep went with higher depression scores. Please make an A0 portrait poster as a .tex file and tell me what to check before printing.
Three things make this a good request. It pins down the format (beamerposter, A0 portrait, a .tex file). It states the facts the poster should carry: sample size, measures, correlation and direction. And it asks for a print checklist too. Stating the results yourself matters most, because it sets the limit on which numbers can appear on the poster.
It wrote the file in one step
This run was quick. Neutropic said it would draft a self-contained A0 portrait source using the details supplied, with clear placeholders for anything missing, and a single Writing step produced the file. It did not open a method guide or look up the questionnaires this time; it worked from Priya's summary.
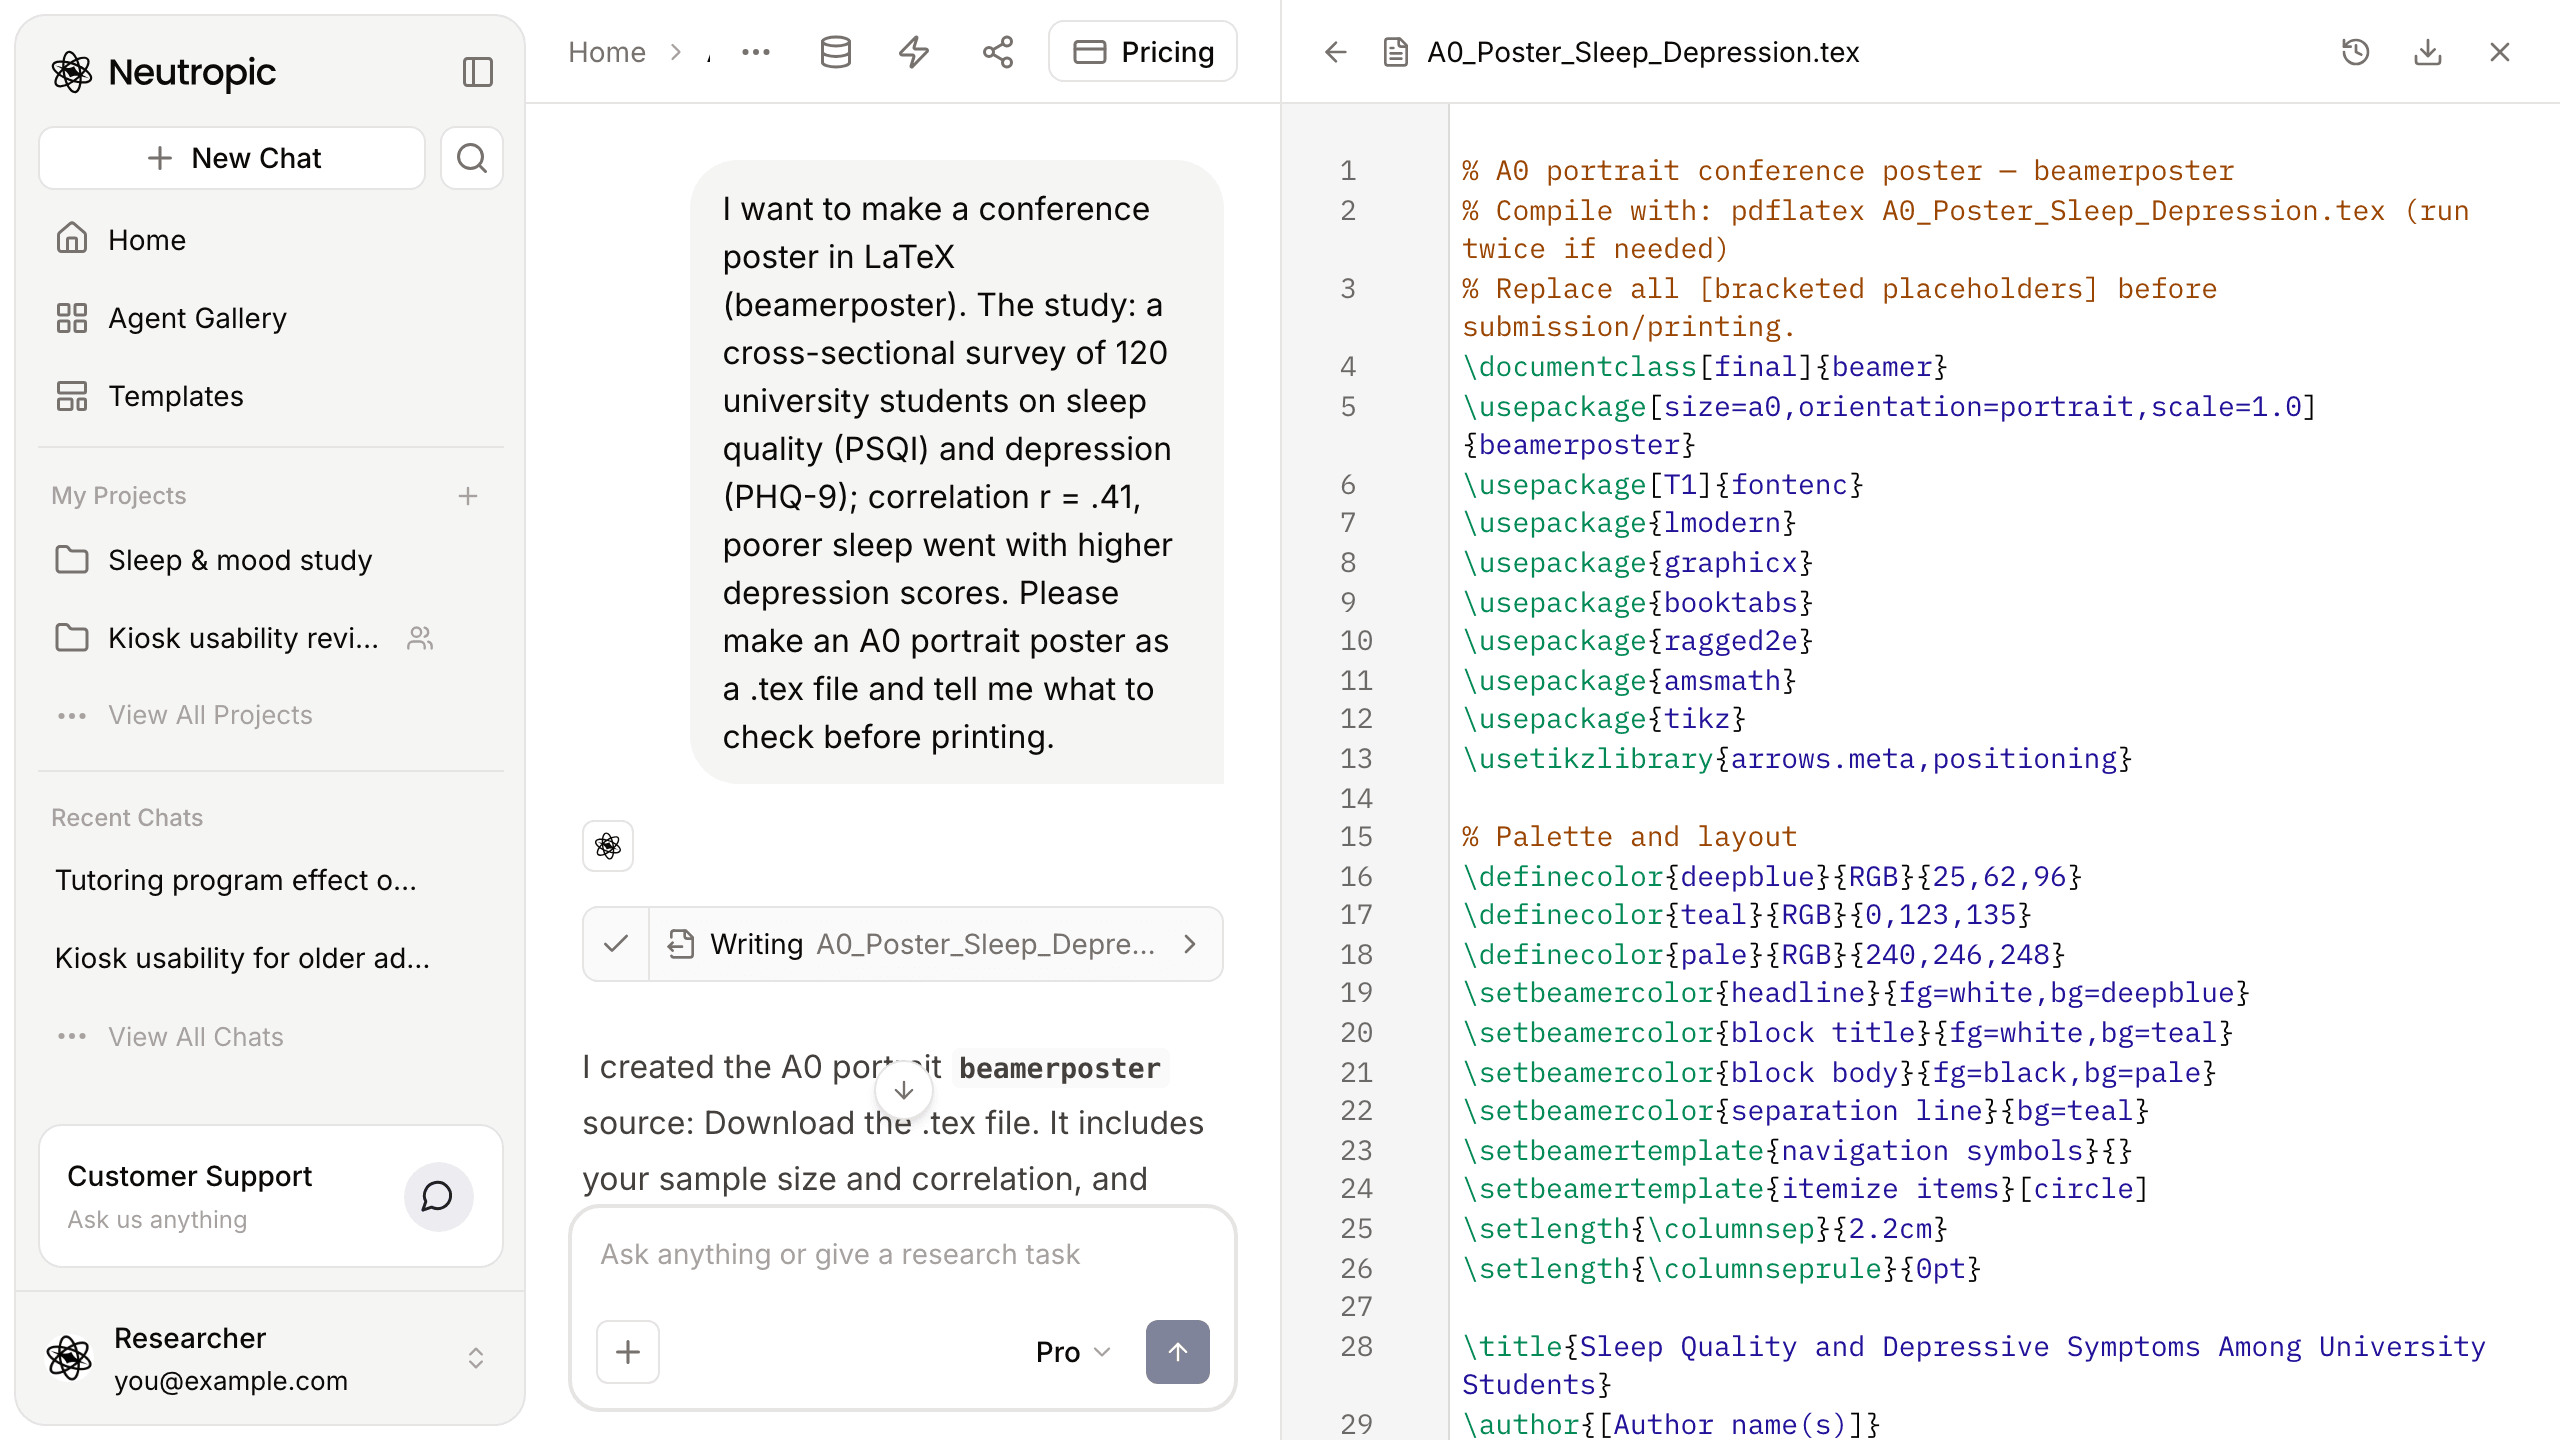
An A0 portrait .tex file opened beside the chat
The result was a beamerposter file of about 160 lines. It sets A0 portrait at the top, defines a deep-blue and teal palette for the title band and blocks, and lays the content out in three columns:
- Left: Background, Aim, Methods, Measures at a glance
- Centre: Key result (a large r = .41 with a small diagram of the positive association), Results, Suggested figure
- Right: Discussion, Limitations, Conclusion, Practical implications, References and contact
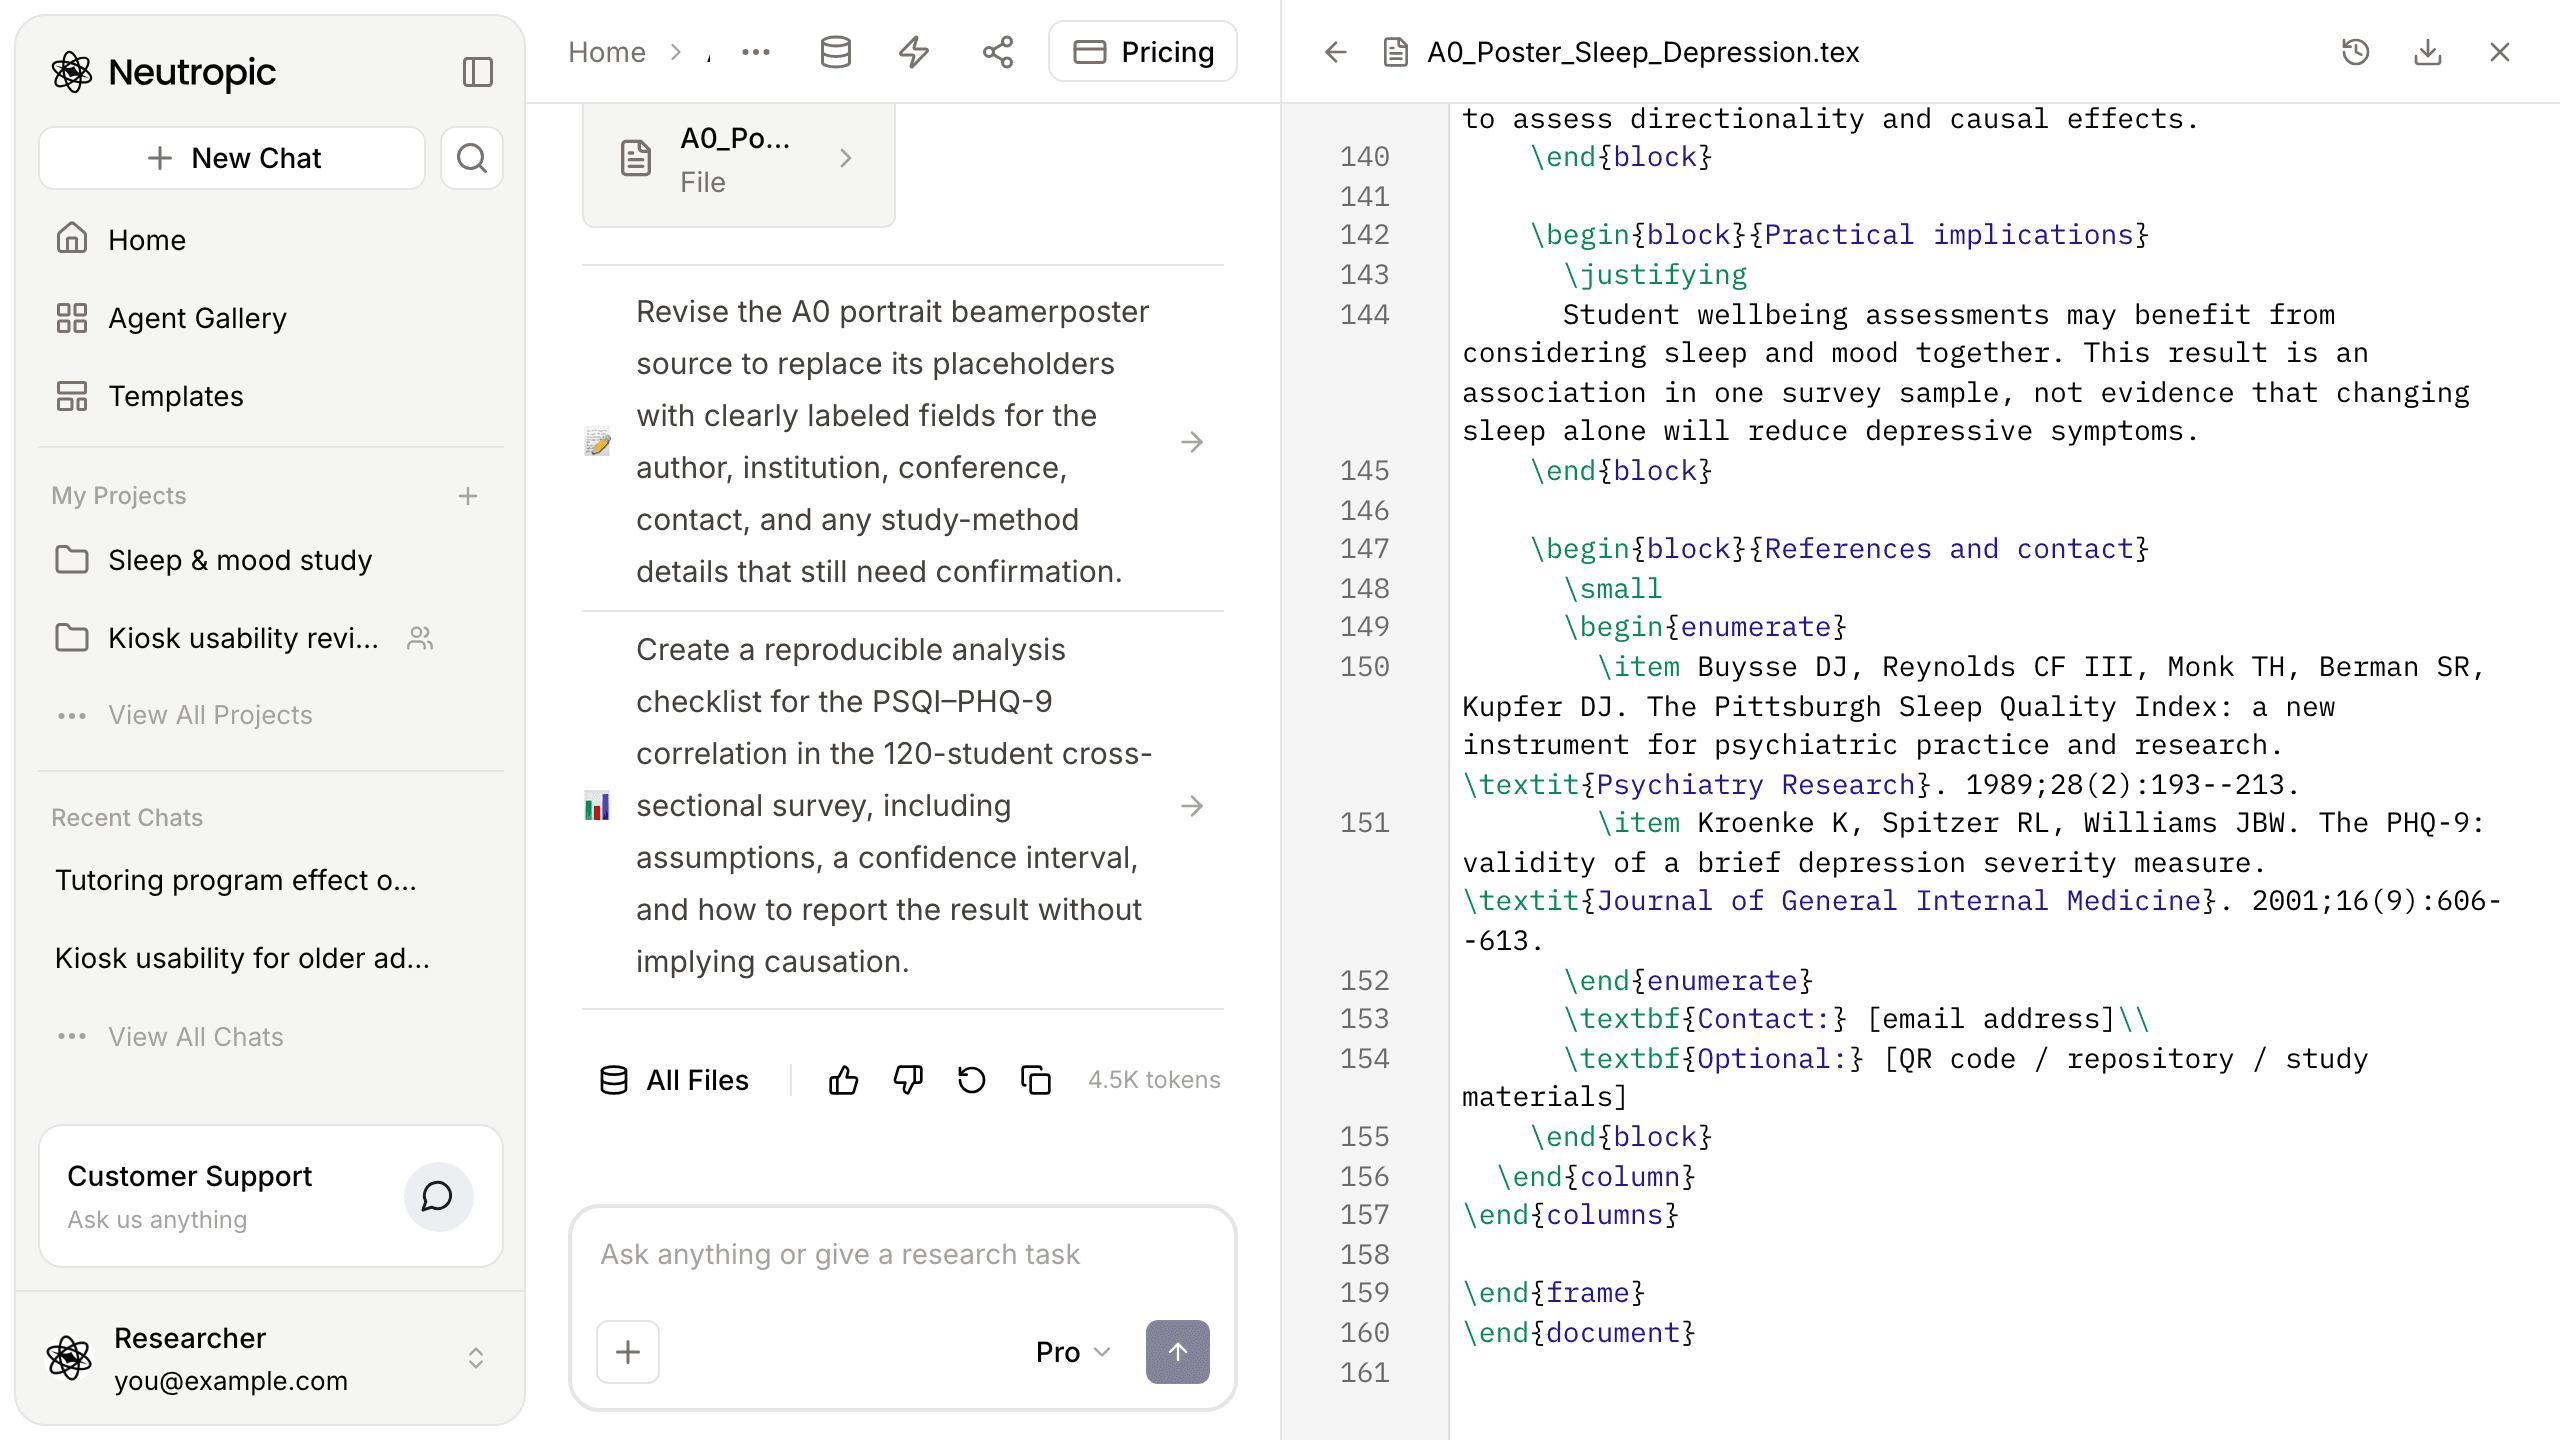
Author names, department, conference and contact details are left as bracketed placeholders. The references block lists the original PSQI and PHQ-9 papers.
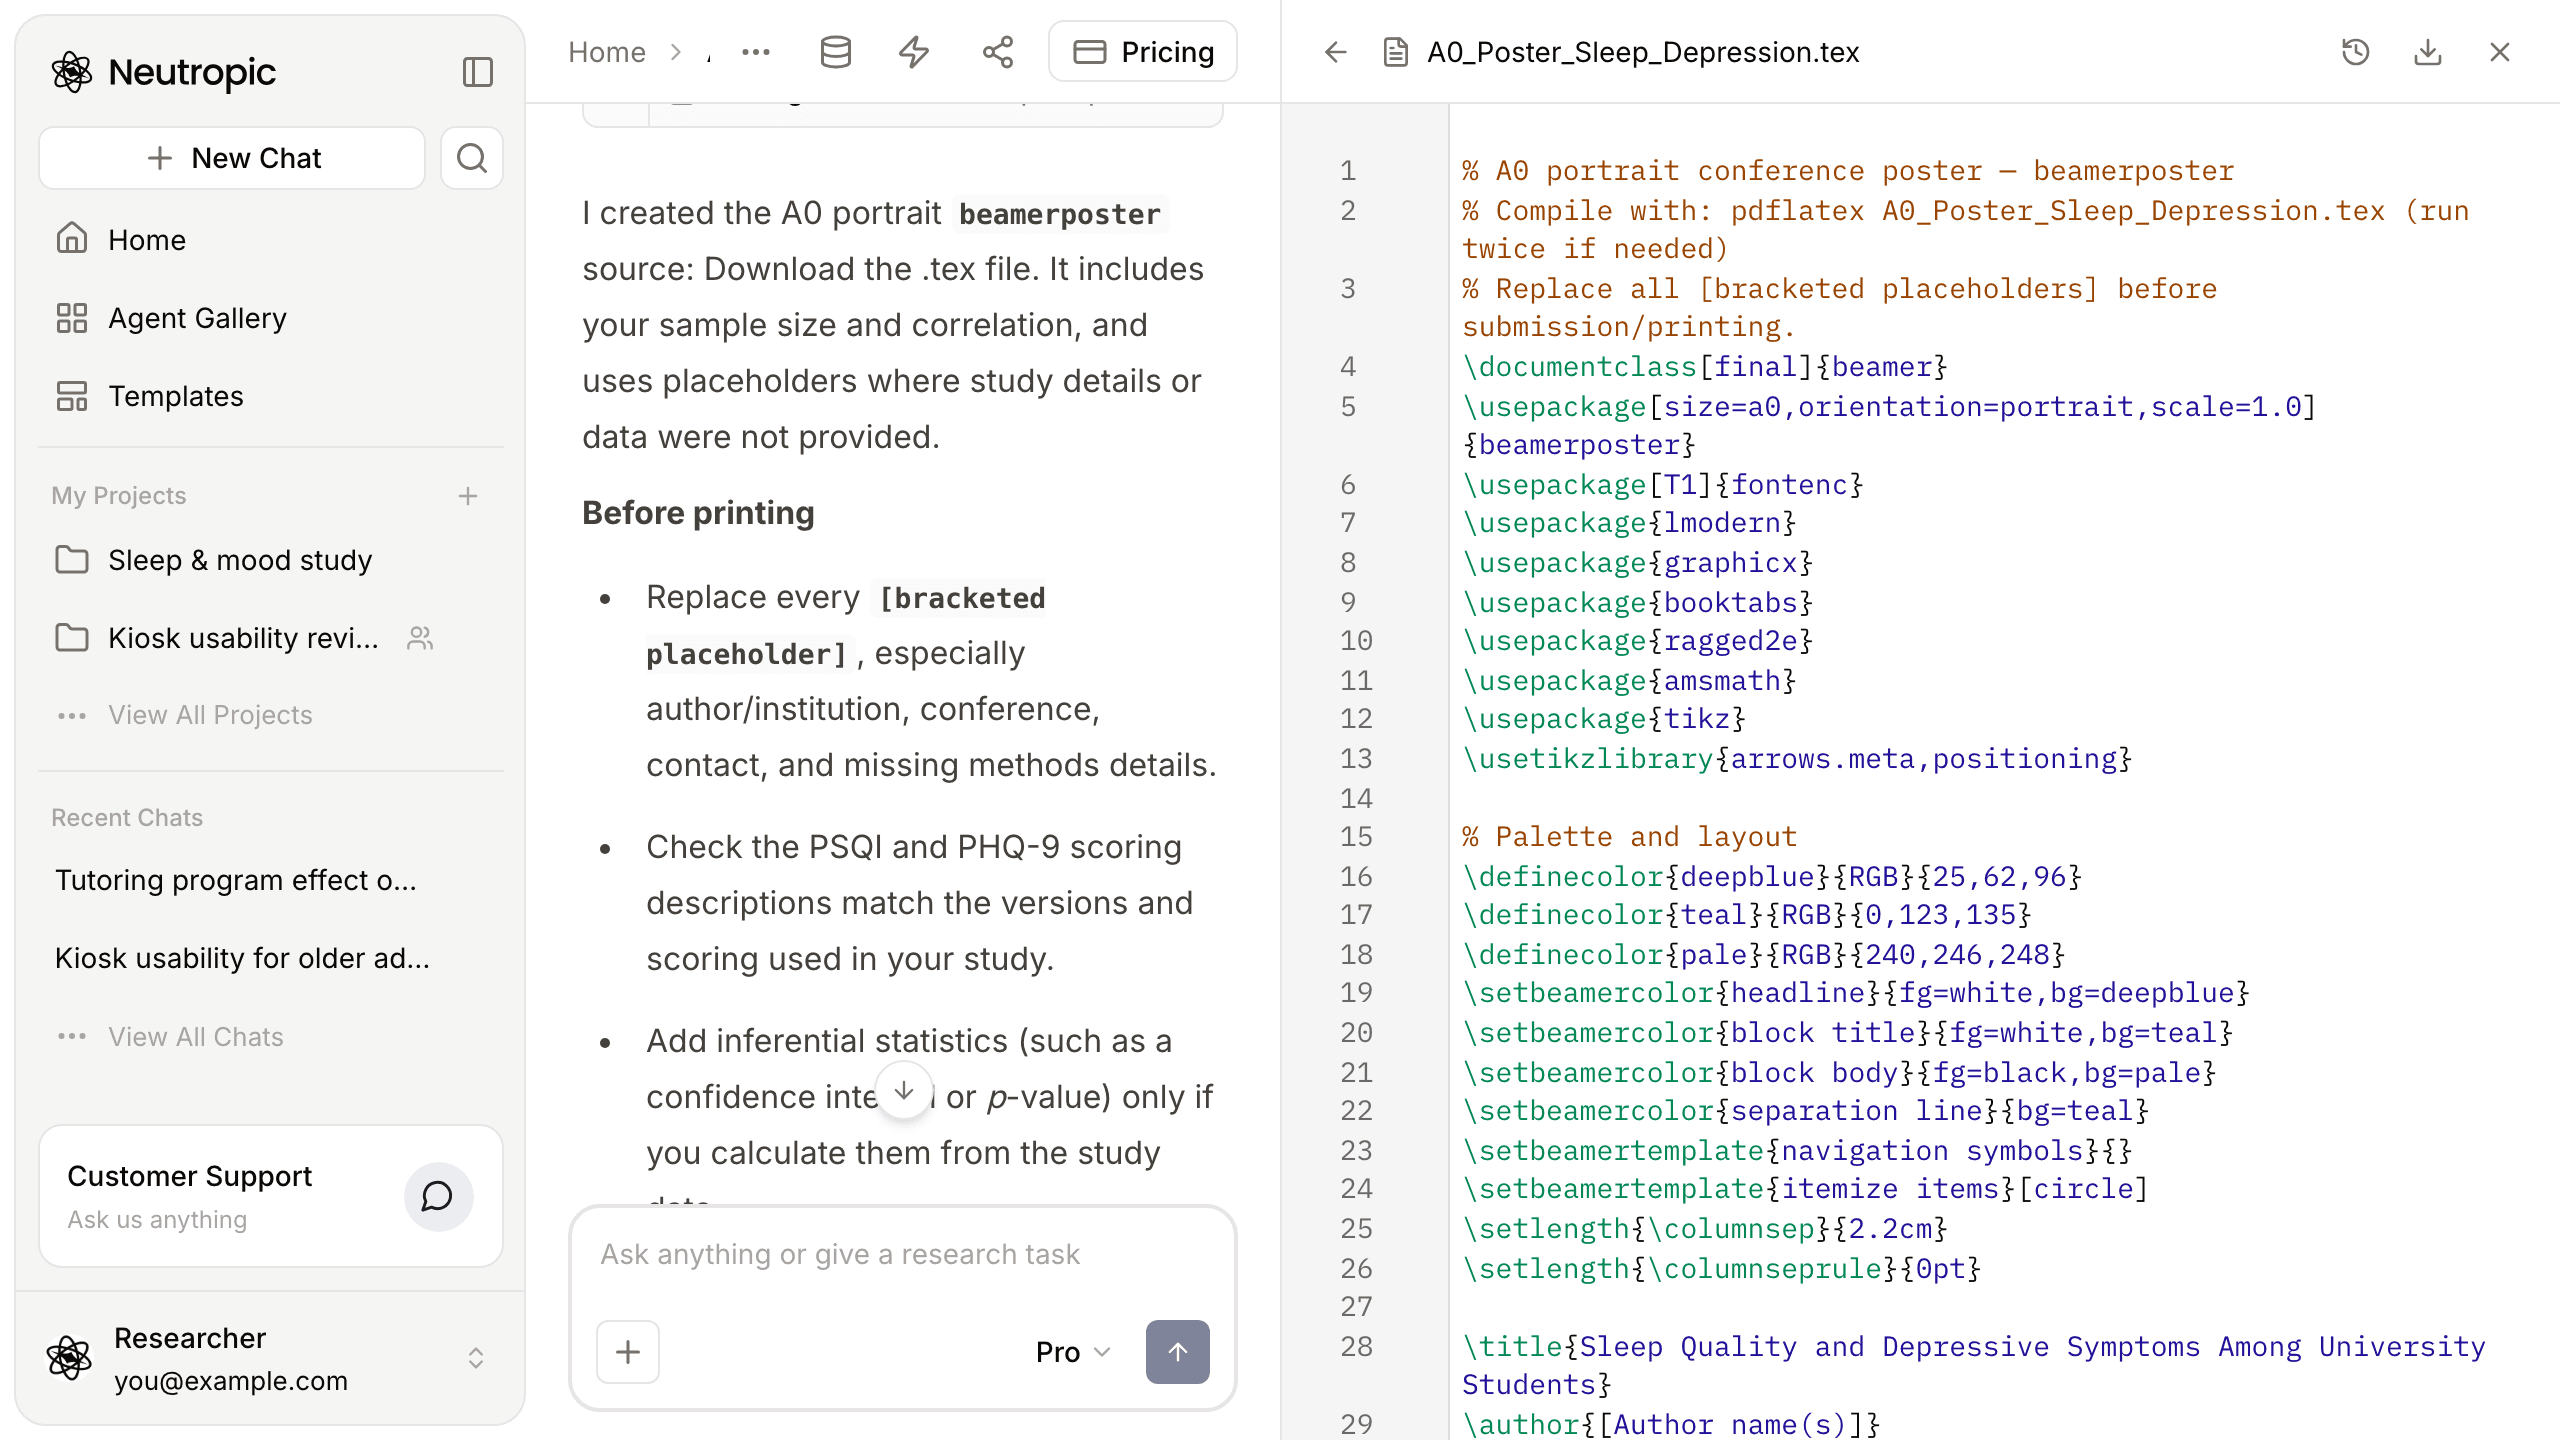
It added nothing beyond the numbers Priya gave
The answer says it plainly: the file includes the sample size and correlation, and uses placeholders where study details or data were not provided. Inside the file, the Key result block carries an "Interpret with care" note: a cross-sectional association does not establish temporal order or causation, and no confidence interval or p-value was reported, so add them only if they are calculated from the study data.
Priya nearly filled the empty figure box with a mock plot
The centre column has a big empty box labelled "Suggested figure". It looks unfinished, and Priya's first thought was to drop in a quick plot made from made-up points. The file and the answer both rule that out. The box says to insert a scatterplot of PSQI against PHQ-9 from the observed data, and the checklist repeats it: replace the placeholder with a scatterplot made from observed data, and don't use simulated points.
There is one more thing to know before printing: the file was written, not compiled. Nothing in this chat ran LaTeX. The checklist's own step is to compile to PDF and confirm the page size, fonts and layout, so Priya still has to do that.
The checklist and the next steps were ready
The print checklist had six items:
- Replace every bracketed placeholder, especially author, institution, conference, contact and missing methods details
- Check that the PSQI and PHQ-9 scoring descriptions match the versions used in the study
- Add inferential statistics, such as a confidence interval or p-value, only if calculated from the study data
- Replace the figure placeholder with a scatterplot from observed data
- Compile to PDF and confirm A0 portrait (841 × 1189 mm), with no overflow, missing fonts or clipped content
- Inspect the PDF at full size, then confirm the printer's PDF, colour, bleed and margin requirements
Below it were two suggestions: revise the placeholders into clearly labelled fields, and create a reproducible analysis checklist for the correlation, including assumptions, a confidence interval and how to report it without implying causation.
A blank editor became a poster file with clear gaps
| At the start | Now | |
|---|---|---|
| Format | Knew the name "beamerposter" | A0 portrait .tex file in three columns |
| Content | One paragraph from the abstract | Background to conclusion, plus limitations and references |
| Numbers | Tempted to fill the space | Only N = 120 and r = .41; nothing invented |
| Figure | Considering a quick mock plot | A marked box for a scatterplot from real data |
| Printing | No plan | A six-item checklist and two next steps |
To be honest about the limits: the file has not been compiled, so check the PDF at full size before it goes to the printer. Any confidence interval or p-value has to come from Priya's own analysis. Still, filling in a ready layout takes far less time than starting with columns in an empty editor.
This walkthrough used Pro. Lite (the free plan) gives layout advice and a short skeleton; Expert also refines the layout and the reading order.
If the poster deadline is close, one paragraph about your study gets you a .tex skeleton to start from. 😎
This week, put your actual results in the request, just like Priya. Start with Neutropic for free