Hi, this is the Neutropic team!
Right before submitting a paper, a last look at the figures often raises two worries. "Will these colours survive a black-and-white printout?" and "What will a colour-blind reviewer see?" Red–green colour-vision deficiency affects roughly one man in twelve, so it is far from rare. But if the colours look fine to you, it is hard to know where to start. 🥲
The trouble is that hue and lightness are separate things. Blue and red look nothing alike, yet if their lightness is nearly the same they turn into the same grey. Colour-vision simulations are similar: until you compute them, you cannot tell which pairs will collapse.
In this post we follow Noor, a PhD student in psychology, checking a figure palette before submission. Noor is fictional, but every screen below comes from a real chat in Neutropic.
Noor pasted the four hex codes as they were
Noor's figures used the four default colours of a plotting library. Instead of colour names, Noor pasted the hex codes:
Tell me how to check whether the colour palette in my paper's figures stays distinguishable for colour-blind readers and in black-and-white print, and actually check this palette: #1f77b4, #ff7f0e, #2ca02c, #d62728
Two things make this a good request. It asks for the method and an actual check, so you get both a verdict now and a way to repeat it for the next figure. And it gives exact hex codes rather than "blue, orange", because the calculation runs on numbers, not names.
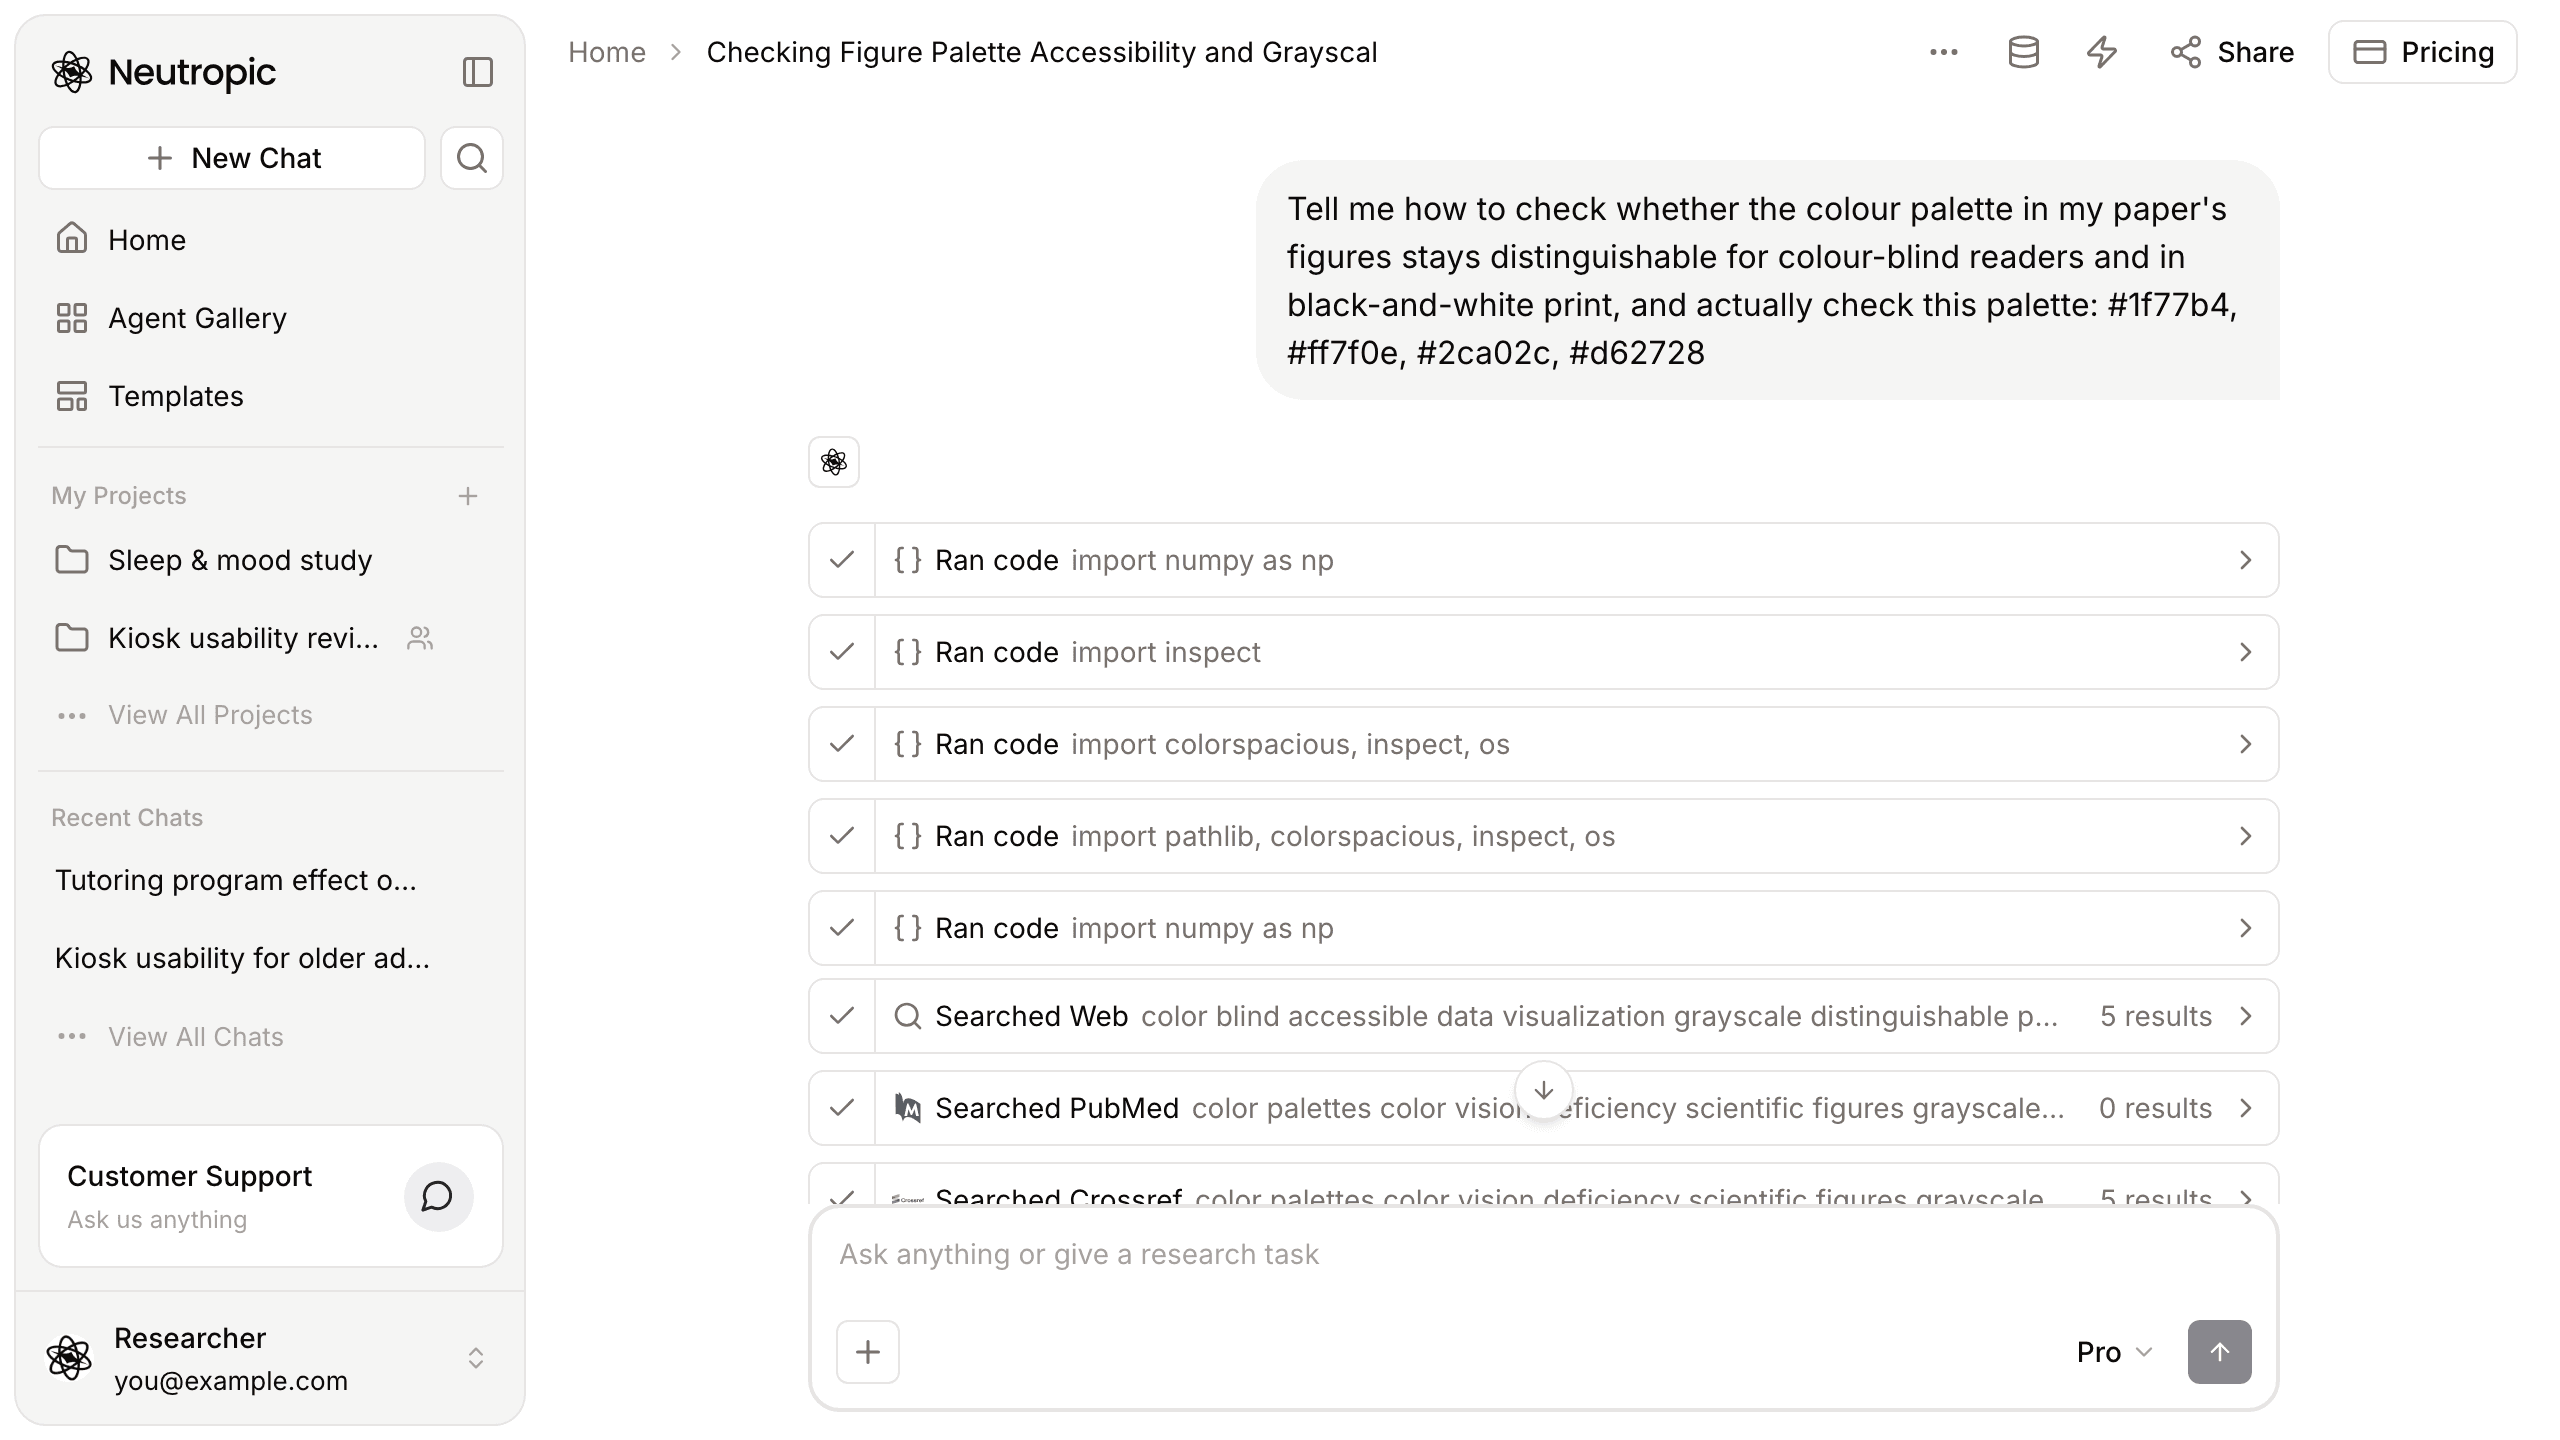
Its first simulation looked wrong, so it checked before trusting it
Steps appeared right away, mostly Ran code. This is the part worth slowing down for. The narration between steps said the first simulation clipped colours to extremes, which suggested the conversion was set up wrongly. Rather than interpret it, Neutropic inspected the colour library's own code to confirm which deficiency types and severity settings it accepts, then reran the simulation. You can see this in the steps: several of them import inspect and the colour library itself.
Only after that check did the narration move on to the corrected simulation and its close colour pairs. That is the behaviour you want: a calculation that looks broken is flagged and rerun, not quietly passed on.
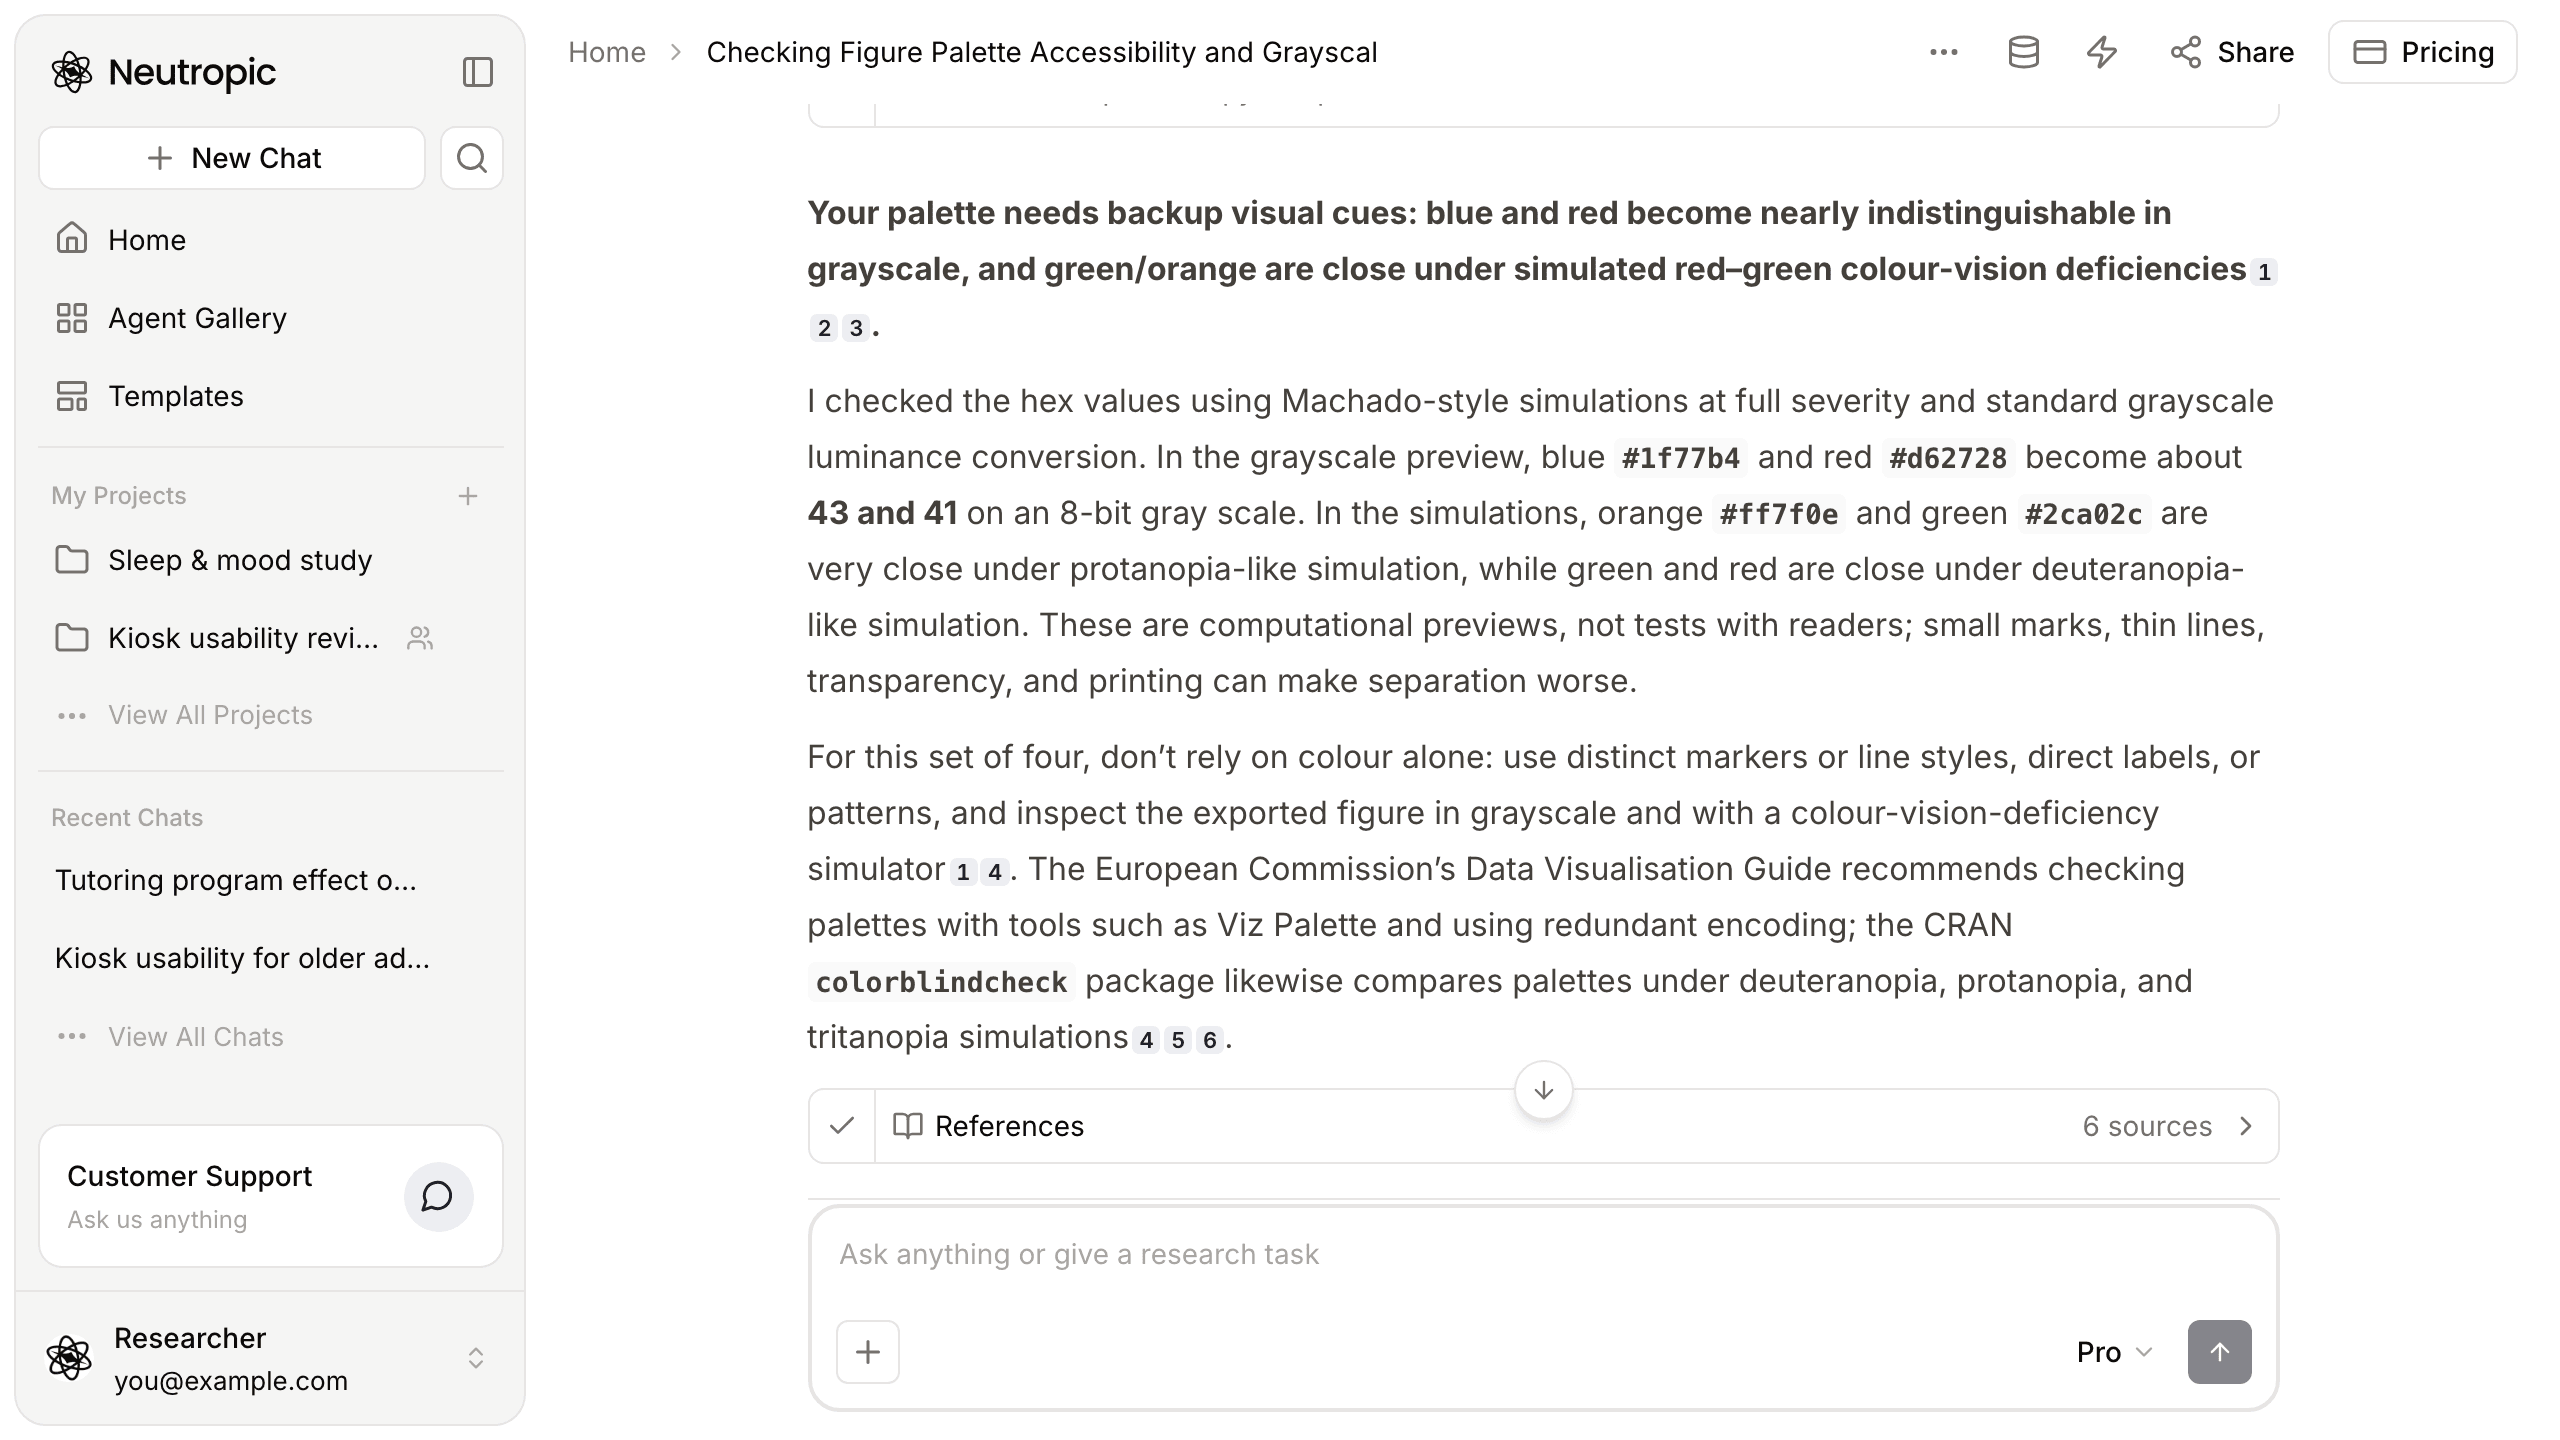
Blue and red become the same grey
The verdict came first, in bold: the palette needs backup visual cues. Blue and red become nearly indistinguishable in greyscale, and green and orange are close under simulated red–green colour-vision deficiencies.
The details:
- Greyscale: using standard relative luminance, blue #1f77b4 and red #d62728 come out at about 43 and 41 on a 0–255 scale. These are luminance values rather than the grey levels a printer would use, but the point holds: the two are almost identical in lightness.
- Simulations: checked with Machado-style simulations at full severity, orange #ff7f0e and green #2ca02c are very close under a protanopia-like simulation, and green and red are close under a deuteranopia-like one.
Noor nearly called the palette "fine for screens"
This is where Noor nearly made a mistake. Most readers will see the figure on screen in colour, so it is tempting to fix only the greyscale problem and move on. The answer warns that these are computational previews, not tests with readers, and that small marks, thin lines, transparency and printing can make separation worse than the swatches suggest. The orange–green problem also affects screen readers with colour-vision deficiency, not just printouts.
So the advice is not "swap one colour". It is: don't rely on colour alone. Use distinct markers or line styles, direct labels or patterns, and inspect the exported figure in greyscale and with a colour-vision simulator.
The sources came with it
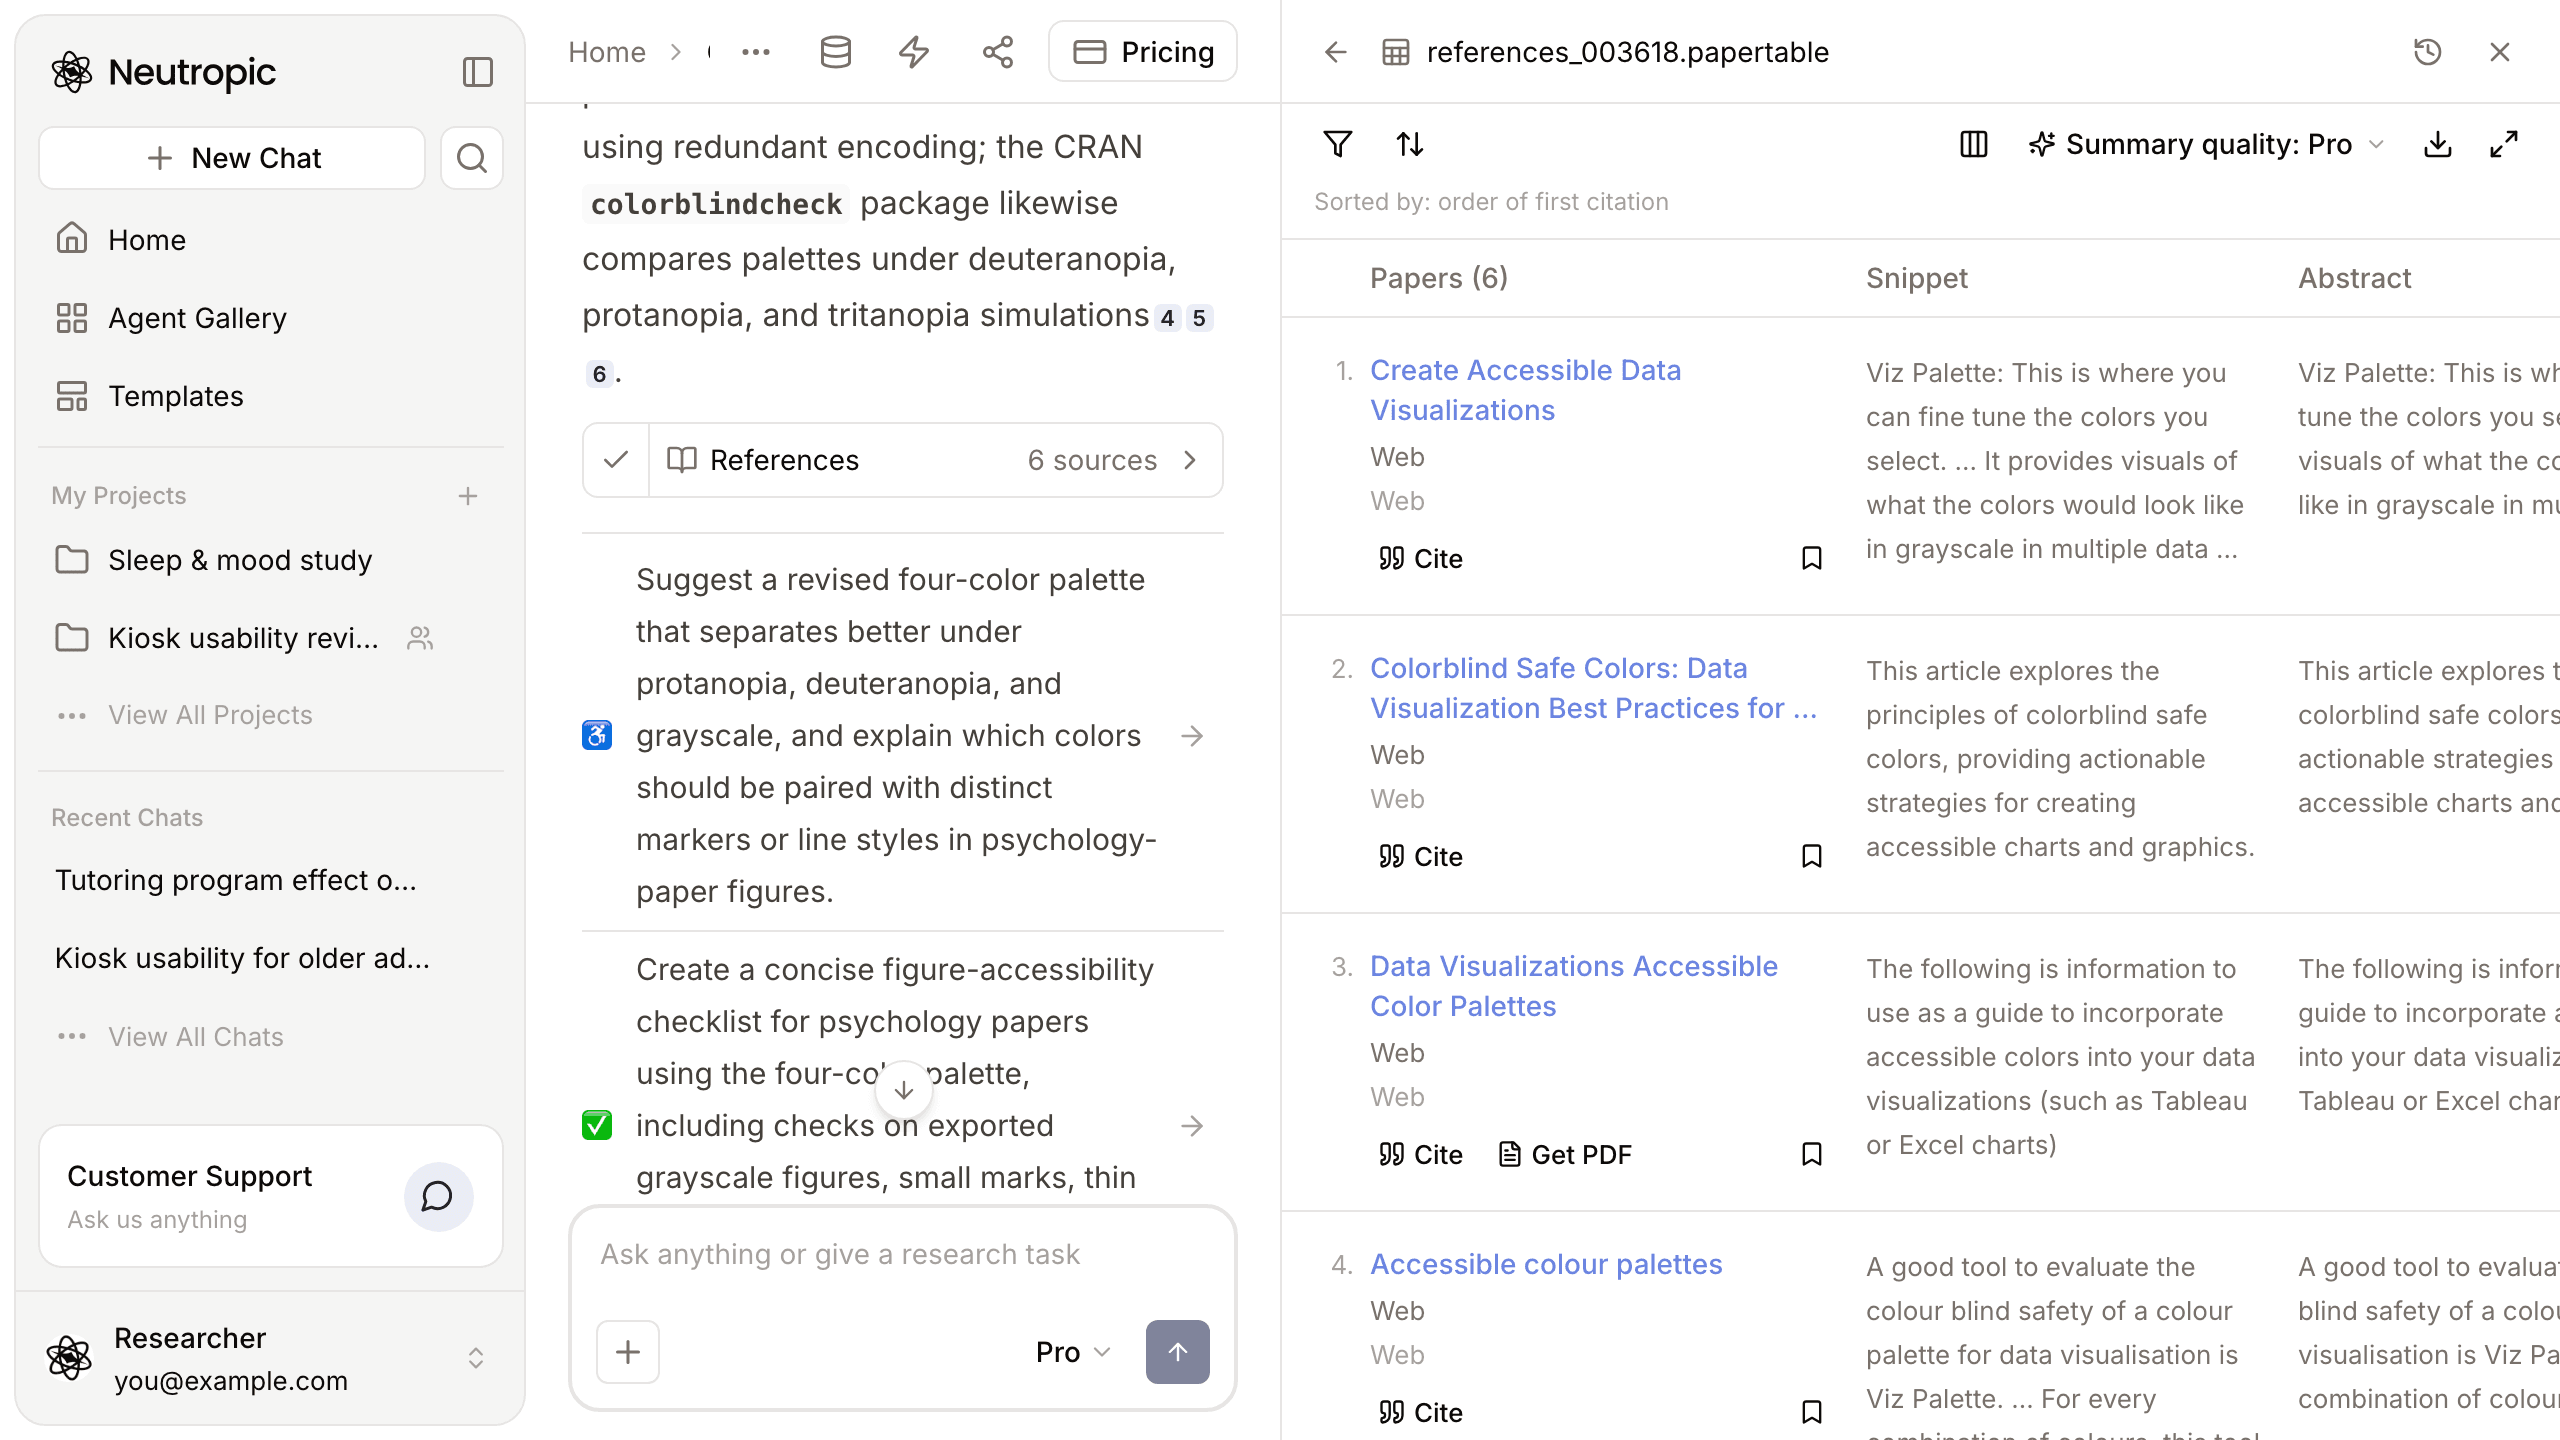
The small numbers at the ends of sentences are citations. Open the References card and 6 sources appear: accessibility guidance on data visualisation, the European Commission's guide to accessible colour palettes, which recommends checking palettes with tools such as Viz Palette and using redundant encoding, and the CRAN colorblindcheck package, which compares palettes under deuteranopia, protanopia and tritanopia simulations.
It suggested what to do next
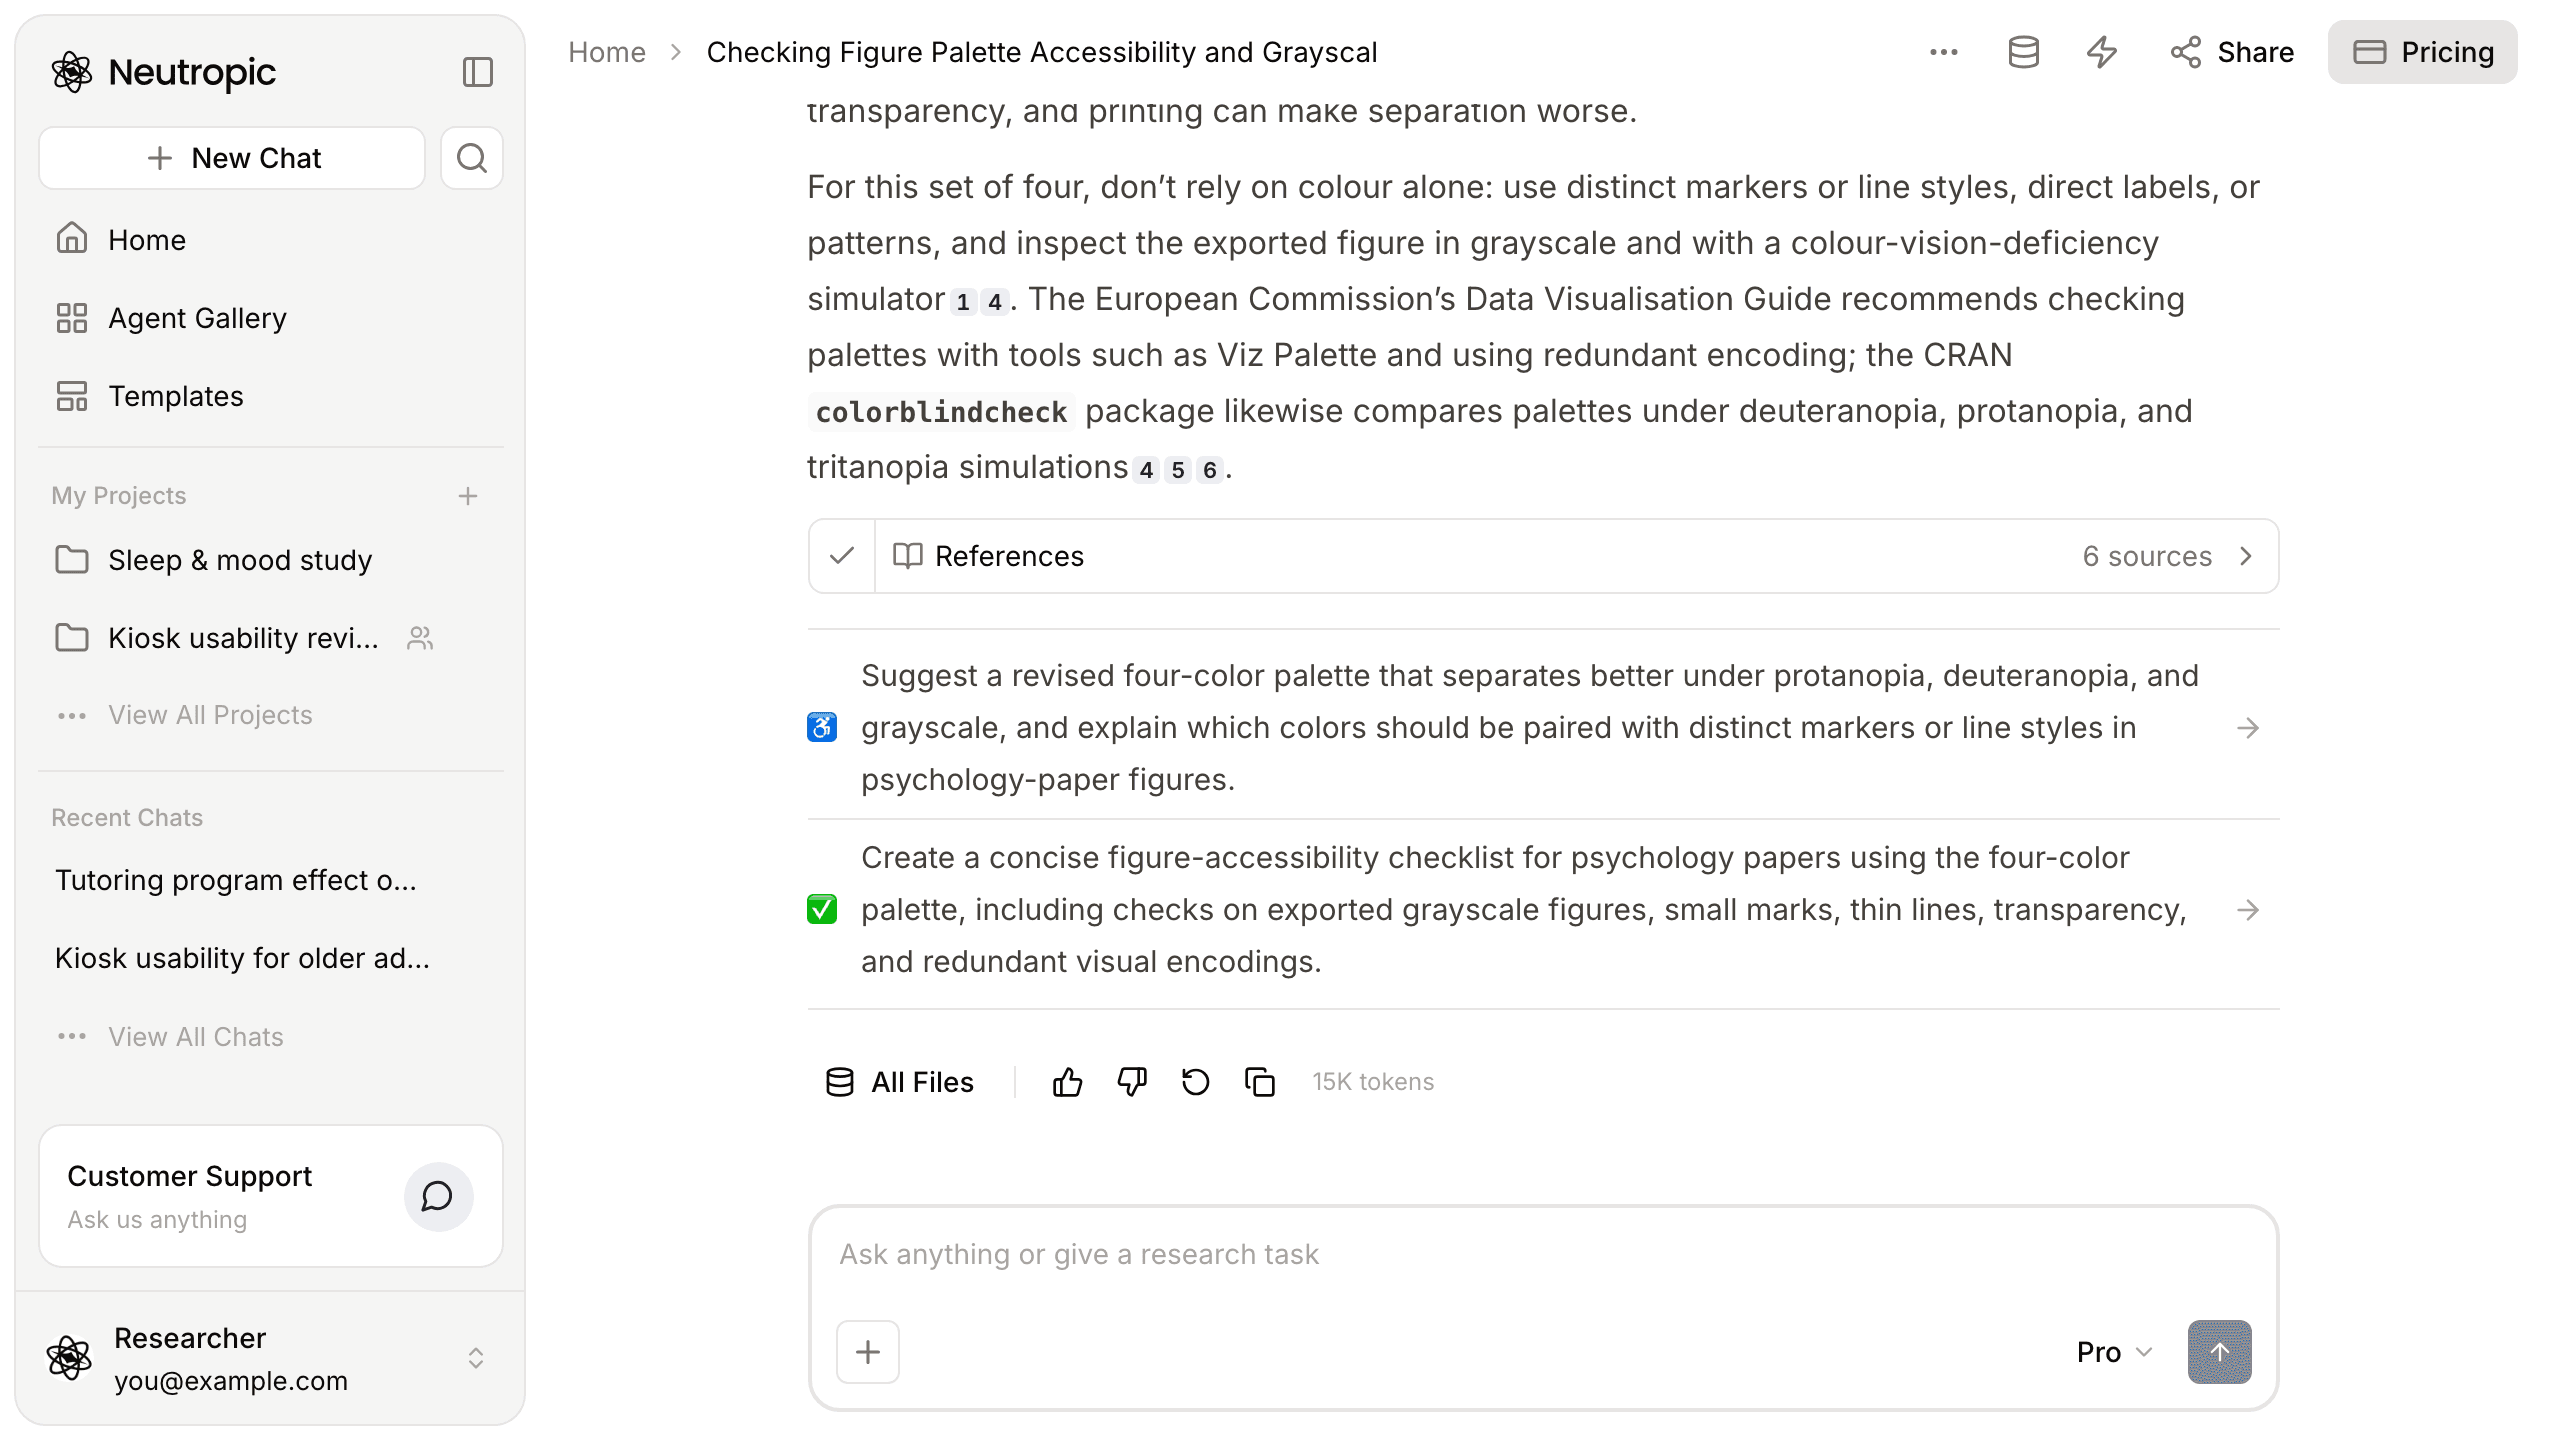
At the bottom of the answer were two follow-ups:
- Suggest a revised four-colour palette that separates better under protanopia, deuteranopia and greyscale, and explain which colours should be paired with distinct markers or line styles in psychology-paper figures
- Create a concise figure-accessibility checklist for psychology papers using the four-colour palette, including checks on exported greyscale figures, small marks, thin lines, transparency and redundant visual encodings
Click one and the conversation continues in the same chat. With a deadline close, Noor would probably start with the first.
"Looks fine to me" became "checked, with a fix"
| At the start | Now | |
|---|---|---|
| Evidence | Looks distinct to me | Luminance values and simulated colour-vision results |
| Greyscale | Unknown | Blue and red almost identical in lightness |
| Colour vision | Unknown | Orange/green (protan-like) and green/red (deutan-like) close |
| Reliability | Not considered | A broken first simulation caught and rerun |
| Fix | Thinking of replacing every colour | Markers, line styles, direct labels, plus next steps |
Simulations are a screening tool. They do not replace printing the final figure at size, and people with colour-vision deficiency do not all see the same way. This answer also gave no code, so the numbers cannot be rerun from the chat itself. Still, stopping at "looks fine to me" is very different from naming the weak pairs.
This walkthrough used Pro. Lite (the free plan) explains the method and gives a quick check; Expert also proposes a replacement palette and re-checks it.
If your figure colours worry you, paste the hex codes and ask for an actual check.
This week, check your figures before you submit, just like Noor. Start with Neutropic for free